. 1999 Oct 15;13(20):2678-90.
doi: 10.1101/gad.13.20.2678.

Bmi-1 collaborates with c-Myc in tumorigenesis by inhibiting c-Myc-induced apoptosis via INK4a/ARF

Affiliations

Bmi-1 collaborates with c-Myc in tumorigenesis by inhibiting c-Myc-induced apoptosis via INK4a/ARF

J J Jacobs et al. Genes Dev. .

Abstract

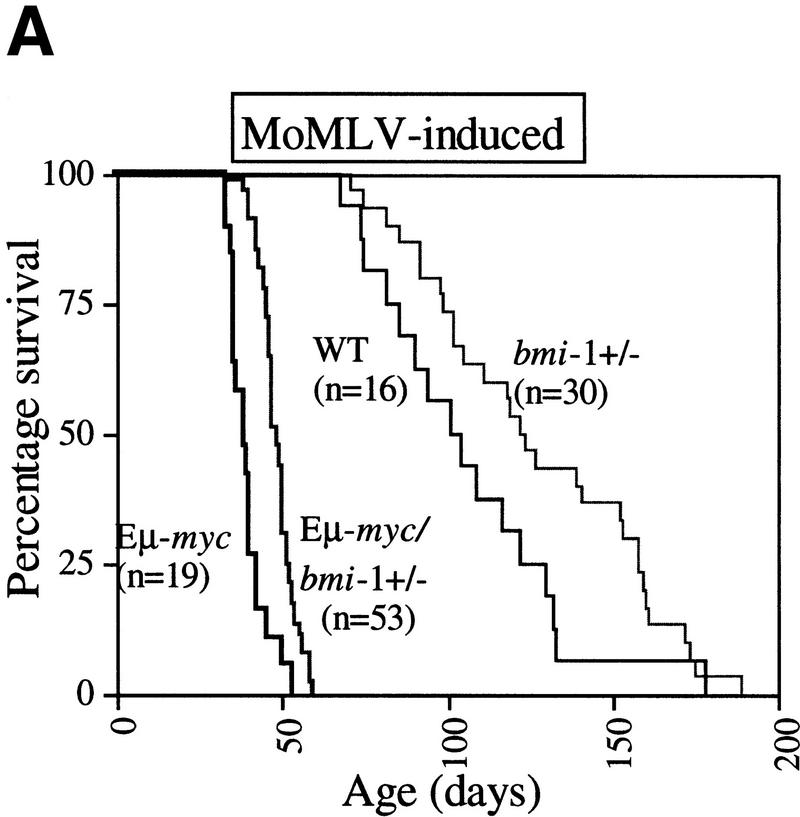
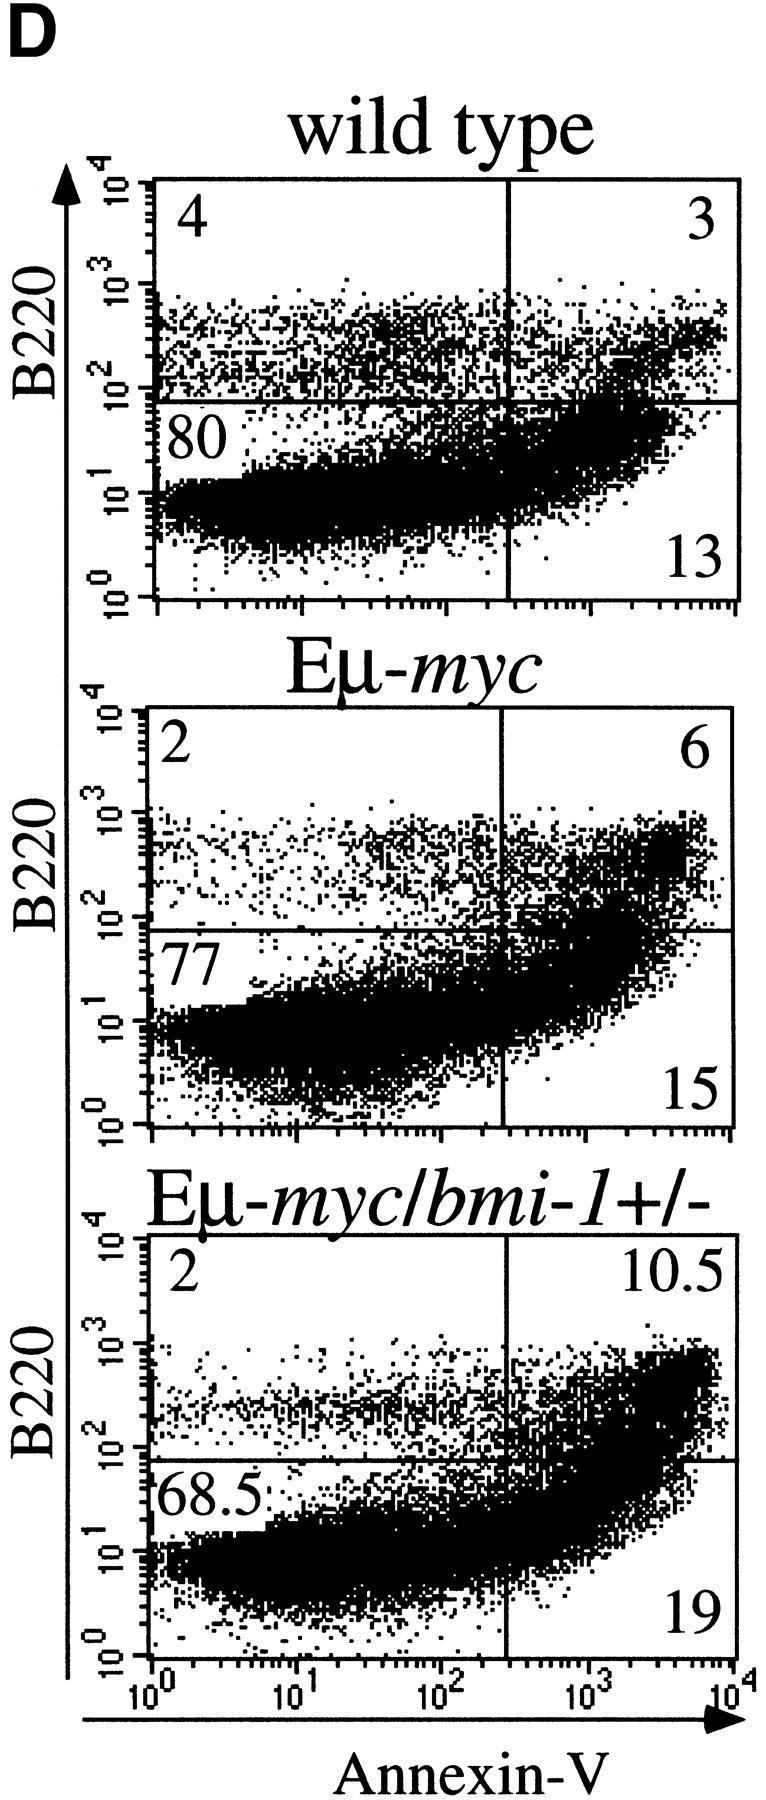
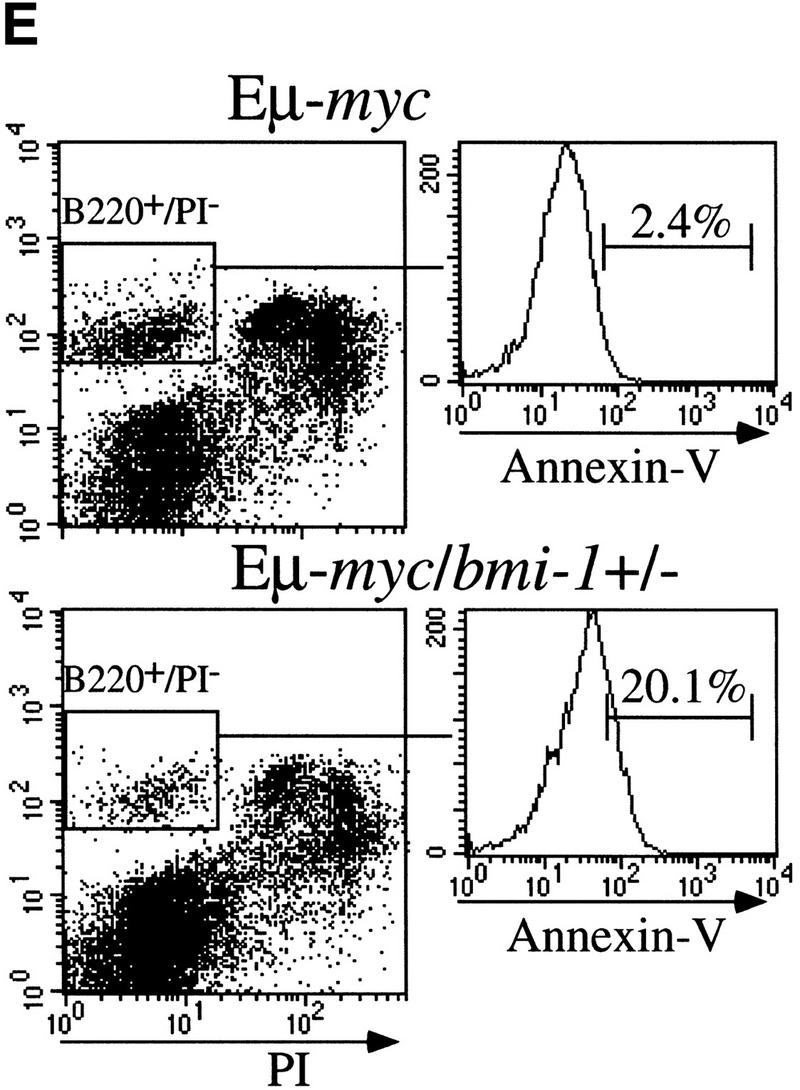
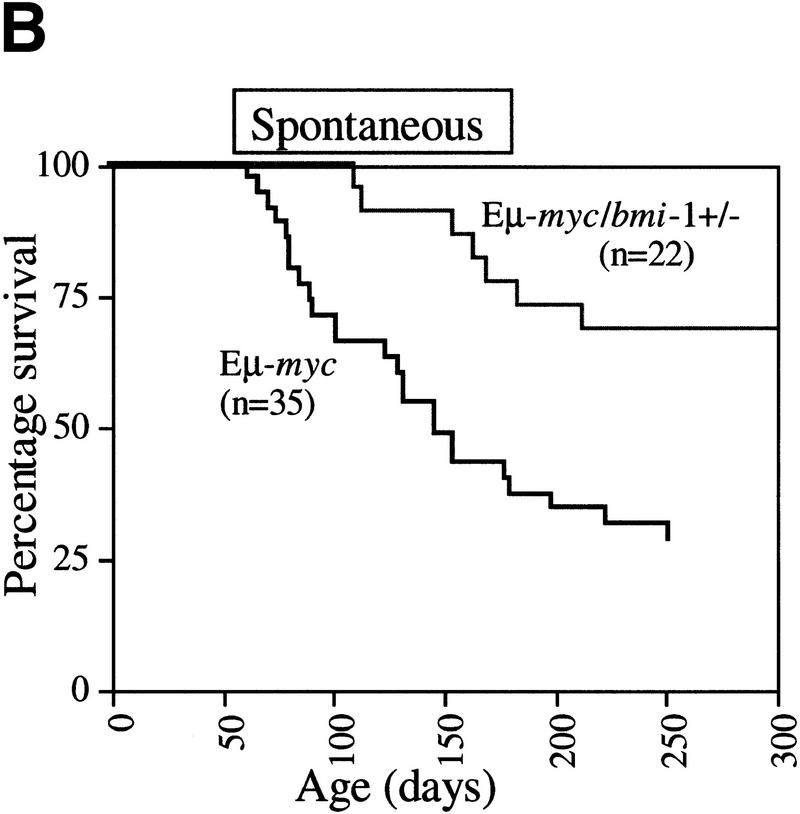
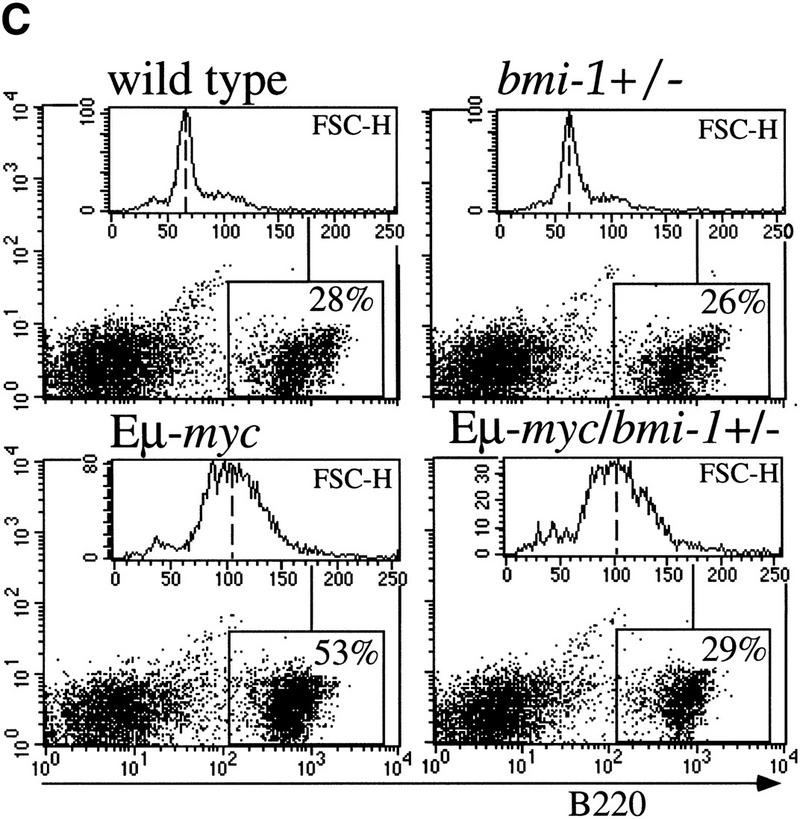
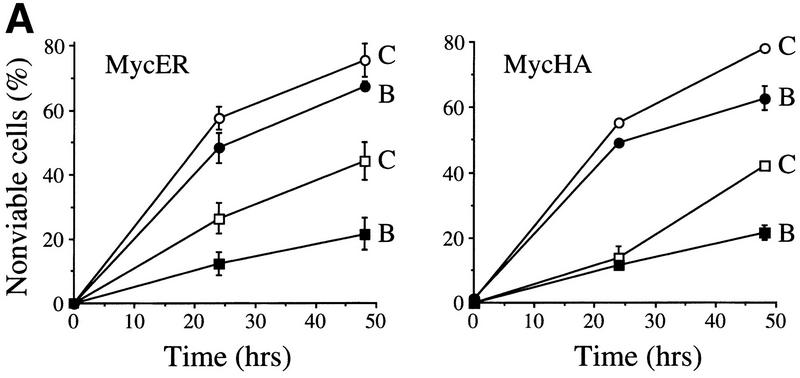
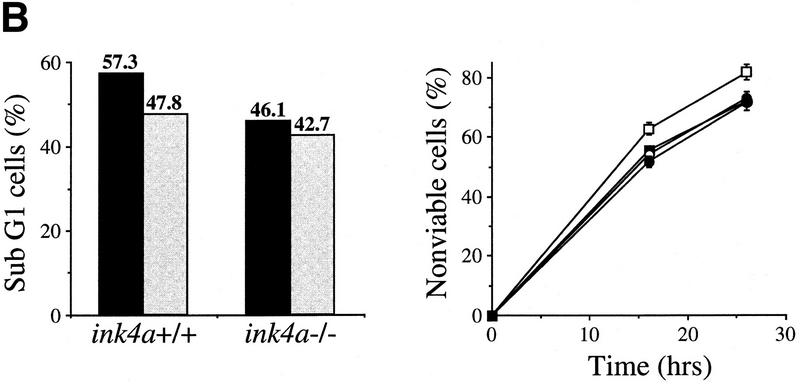
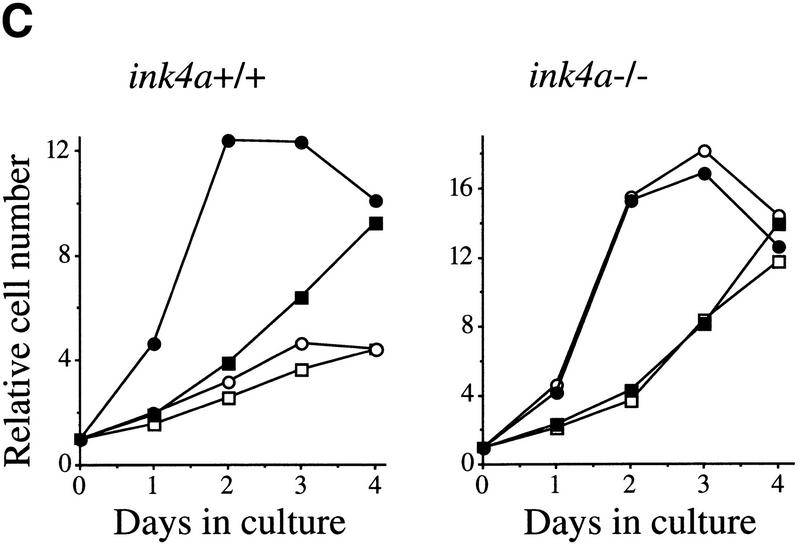
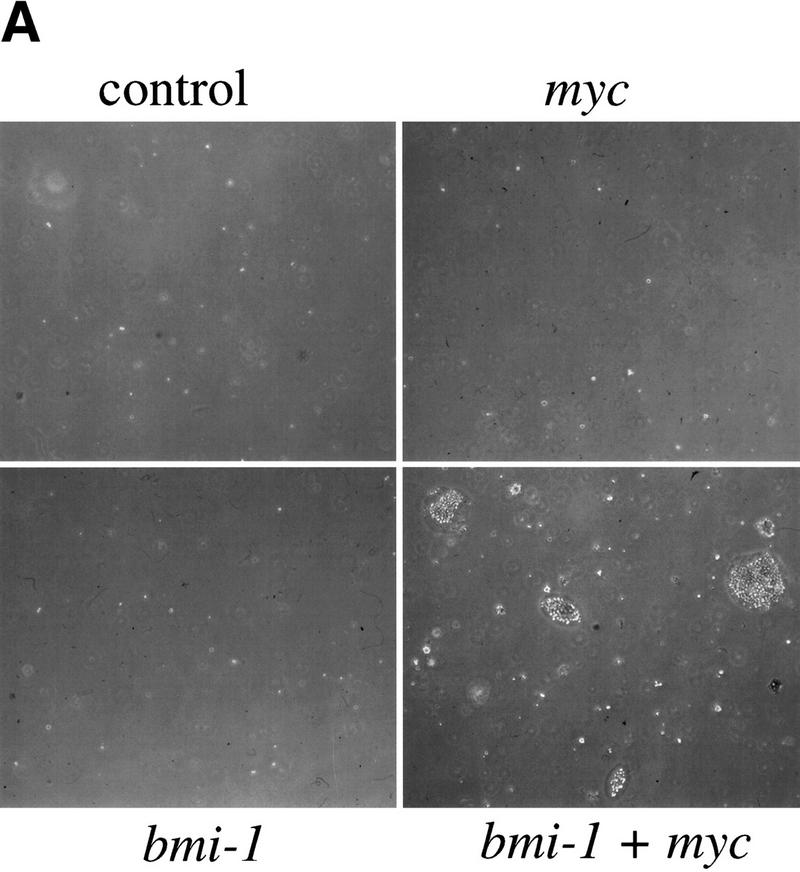
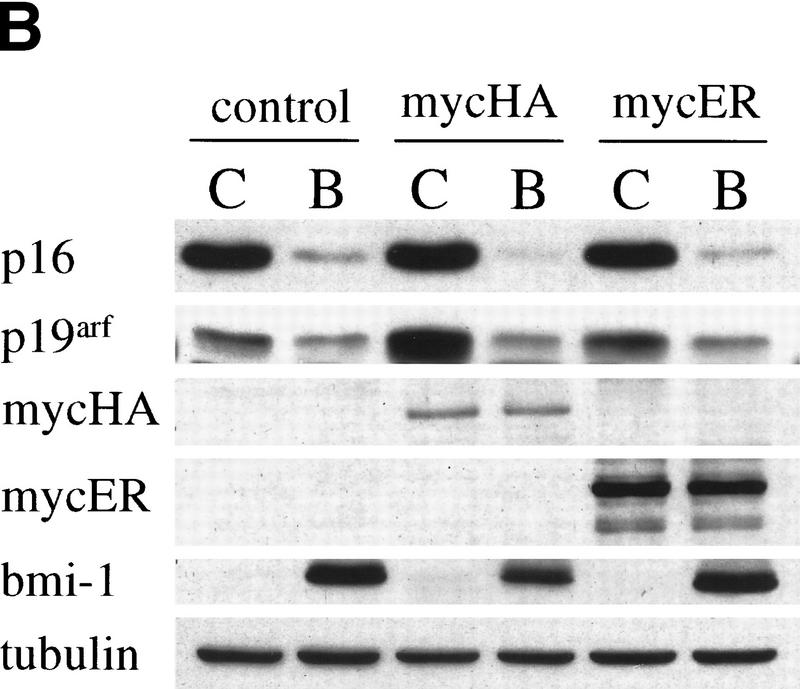
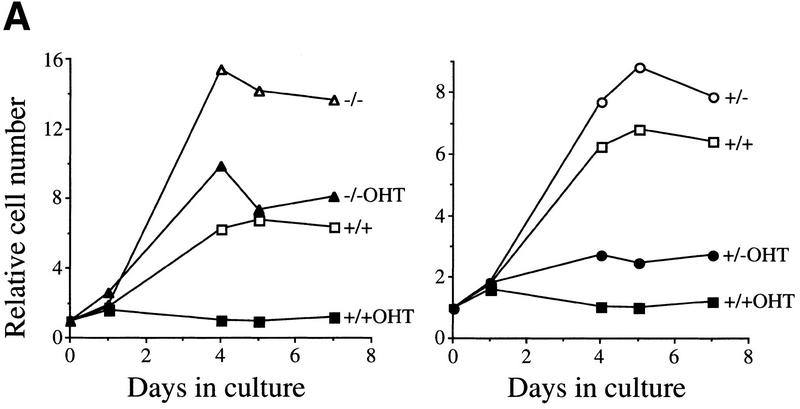
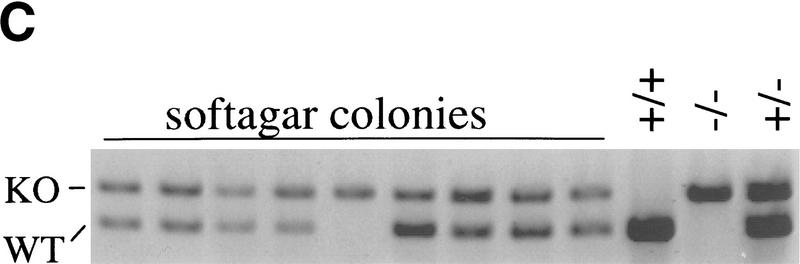
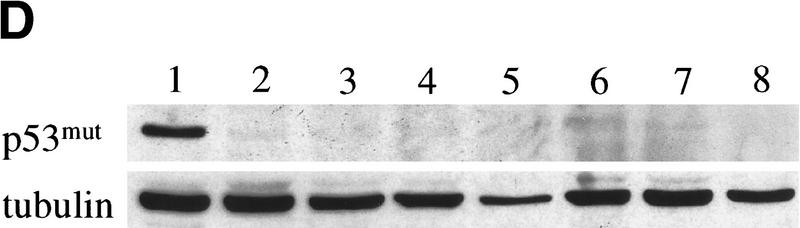
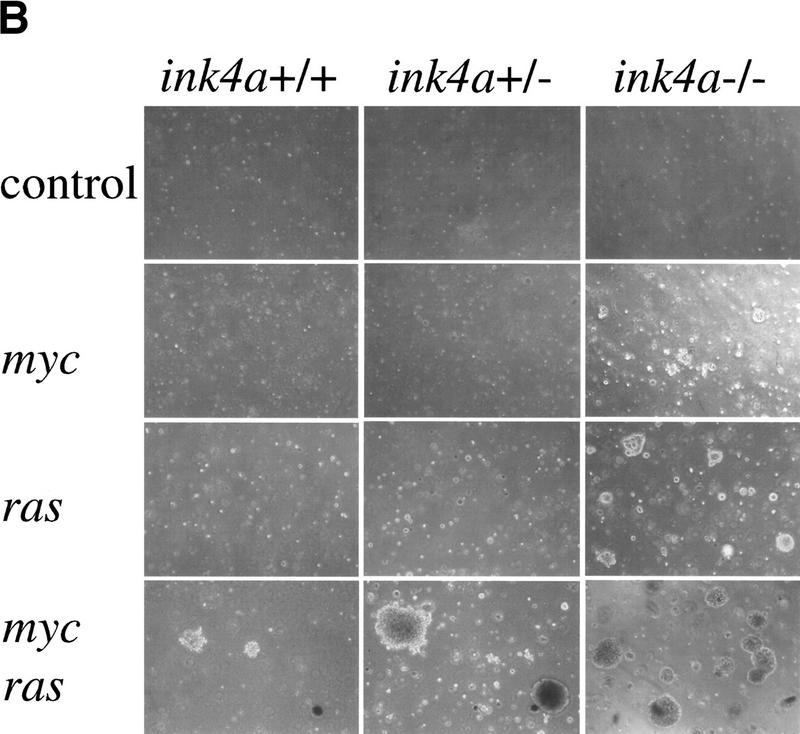
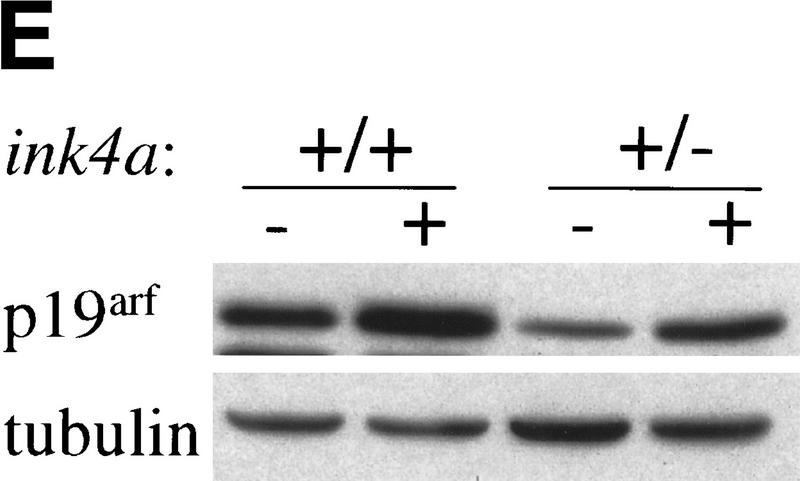
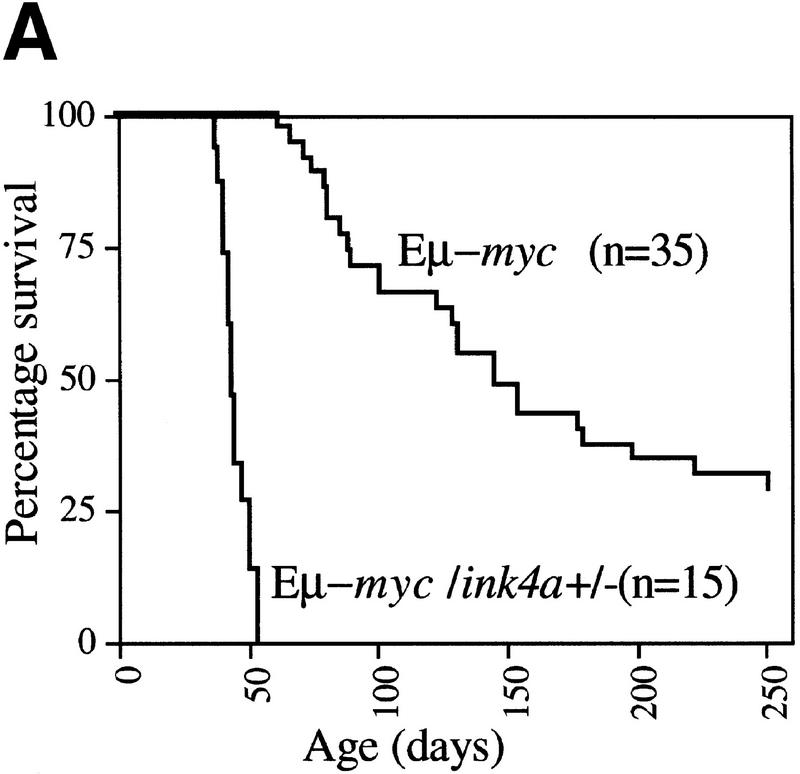
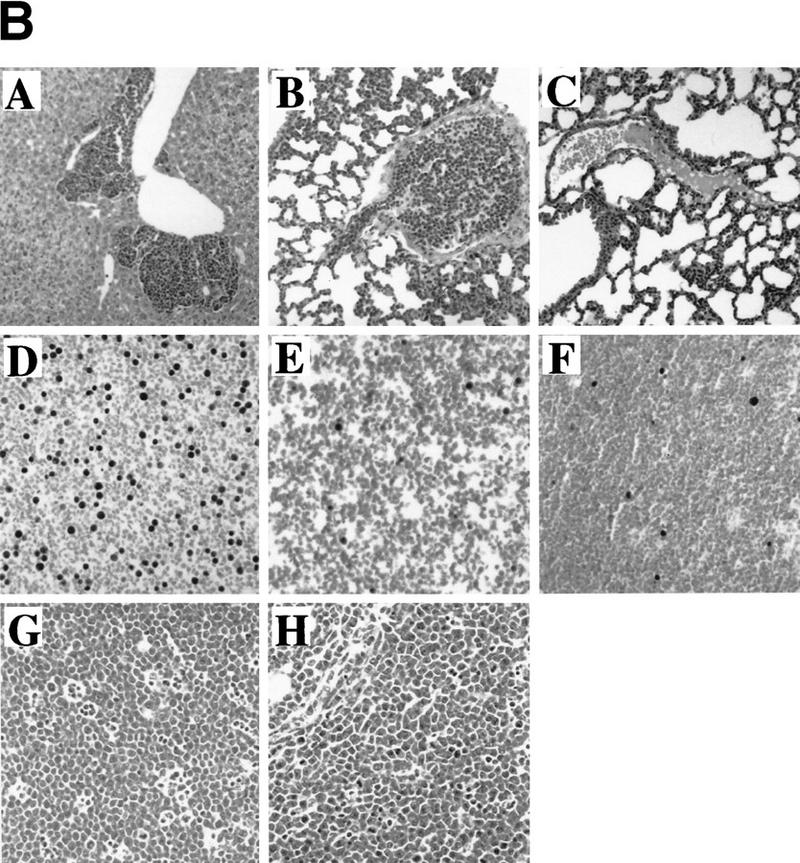
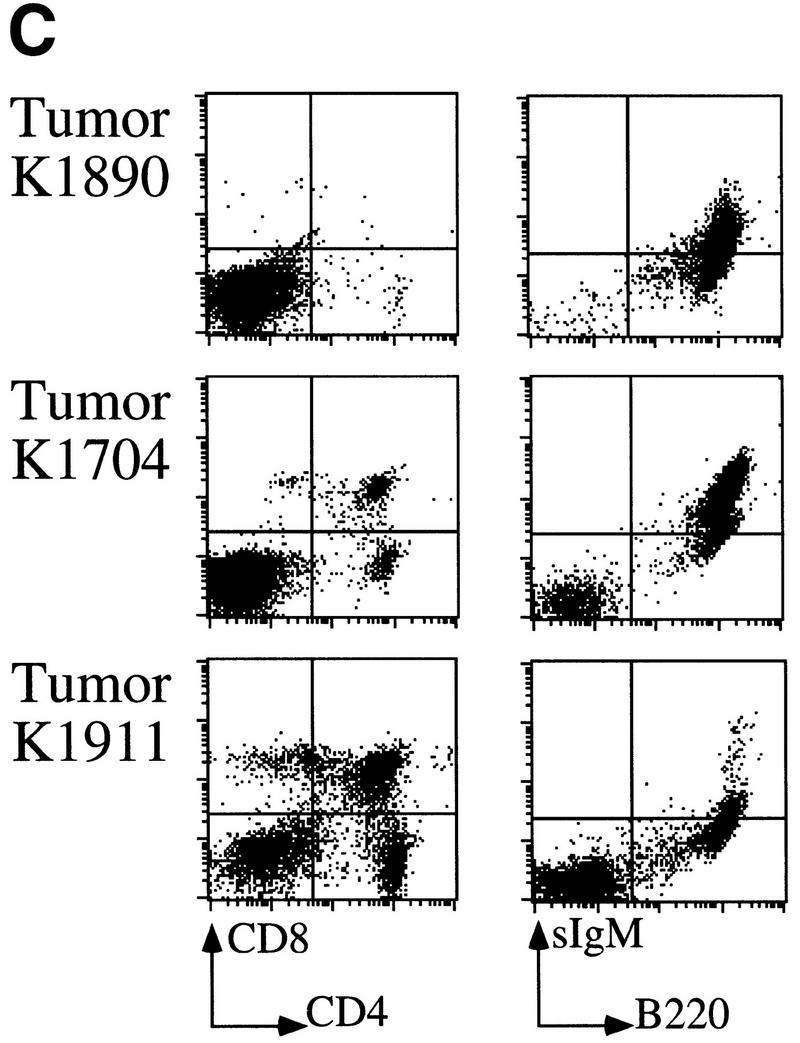
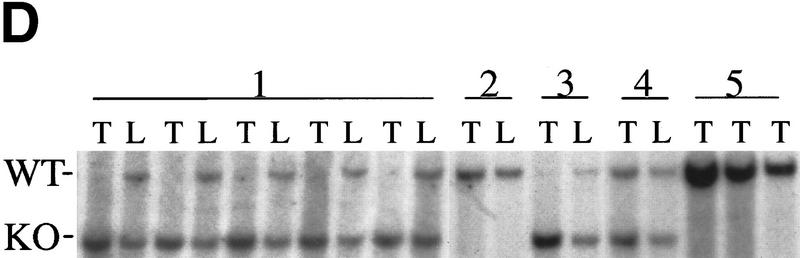
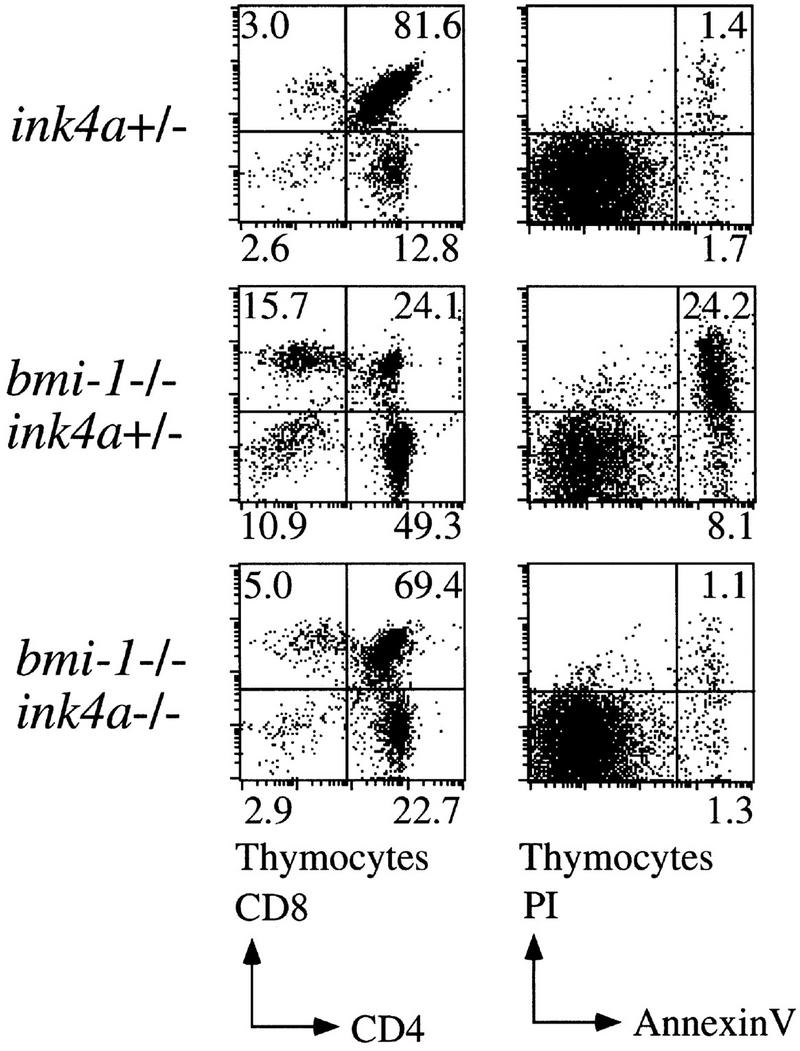
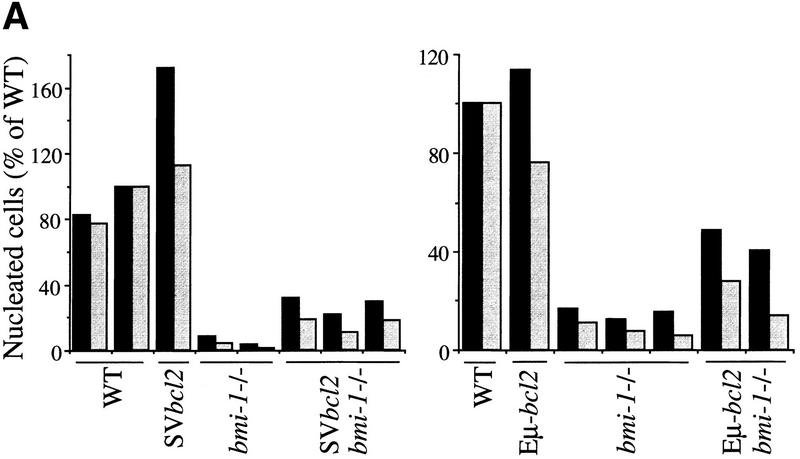
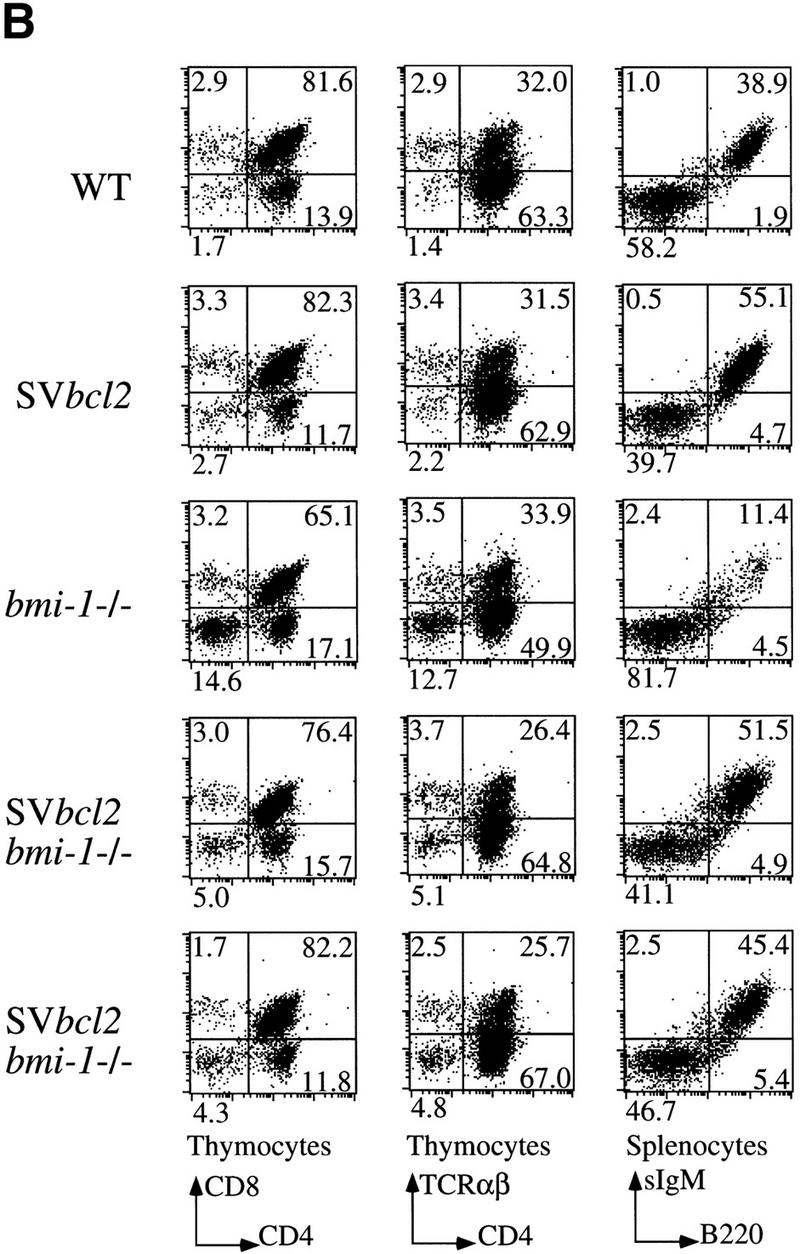
The bmi-1 and myc oncogenes collaborate strongly in murine lymphomagenesis, but the basis for this collaboration was not understood. We recently identified the ink4a-ARF tumor suppressor locus as a critical downstream target of the Polycomb-group transcriptional repressor Bmi-1. Others have shown that part of Myc's ability to induce apoptosis depends on induction of p19arf. Here we demonstrate that down-regulation of ink4a-ARF by Bmi-1 underlies its ability to cooperate with Myc in tumorigenesis. Heterozygosity for bmi-1 inhibits lymphomagenesis in Emu-myc mice by enhancing c-Myc-induced apoptosis. We observe increased apoptosis in bmi-1(-/-) lymphoid organs, which can be rescued by deletion of ink4a-ARF or overexpression of bcl2. Furthermore, Bmi-1 collaborates with Myc in enhancing proliferation and transformation of primary embryo fibroblasts (MEFs) in an ink4a-ARF dependent manner, by prohibiting Myc-mediated induction of p19arf and apoptosis. We observe strong collaboration between the Emu-myc transgene and heterozygosity for ink4a-ARF, which is accompanied by loss of the wild-type ink4a-ARF allele and formation of highly aggressive B-cell lymphomas. Together, these results reinforce the critical role of Bmi-1 as a dose-dependent regulator of ink4a-ARF, which on its turn acts to prevent tumorigenesis on activation of oncogenes such as c-myc.


Figures

Figure 1
Figure 1
Heterozygosity for bmi-1 causes reduced susceptibility to lymphomagenesis, abrogation of c-Myc-induced pre-B cell expansion and increased c-Myc-induced apoptosis. (A) Kaplan-Meier survival plots of MoMLV-induced tumors in Eμ–myc, Eμ–myc;bmi-1+/−, bmi-1+/−, and wild-type control mice and (B) of spontaneous (pre-) B-cell lymphomas in Eμ–myc and Eμ–myc;bmi-1+/− mice. (C) Flow-cytometric analysis of bone marrow cell suspensions of wild-type, bmi-1+/−, Eμ–myc and Eμ–myc;bmi-1+/− mice at the age of 5–7 weeks. B220 cell-surface staining shows an increased cell size (FSC-H), due to higher cycling activity of pre-B cells (B220 positive lymphocytes) in Eμ–myc and Eμ–myc;bmi-1+/− mice and an expansion of the pre-B cell compartment in Eμ–myc but not in Eμ–myc;bmi-1+/− mice. (D) Flow-cytometric analysis of bone marrow cell suspensions of wild-type, Eμ–myc, and Eμ–myc;bmi-1+/− mice, cultured for 24 hr in 10% FBS/RPMI medium in the absence of specific growth factors and subsequently stained for B220 and Annexin-V. The apoptotic ratio Annexin-V+/Annexin-V of B220+ lymphocytes indicates the apoptosis susceptibility of bone marrow-derived pre-B cells. (E) Analysis of the percentage of Annexin-V+ cells within the pool of viable B220+/PIlymphocytes indicates a 10-fold increase in Eμ–myc;bmi-1+/− mice vs. Eμ–myc mice.
Figure 1
Figure 1
Heterozygosity for bmi-1 causes reduced susceptibility to lymphomagenesis, abrogation of c-Myc-induced pre-B cell expansion and increased c-Myc-induced apoptosis. (A) Kaplan-Meier survival plots of MoMLV-induced tumors in Eμ–myc, Eμ–myc;bmi-1+/−, bmi-1+/−, and wild-type control mice and (B) of spontaneous (pre-) B-cell lymphomas in Eμ–myc and Eμ–myc;bmi-1+/− mice. (C) Flow-cytometric analysis of bone marrow cell suspensions of wild-type, bmi-1+/−, Eμ–myc and Eμ–myc;bmi-1+/− mice at the age of 5–7 weeks. B220 cell-surface staining shows an increased cell size (FSC-H), due to higher cycling activity of pre-B cells (B220 positive lymphocytes) in Eμ–myc and Eμ–myc;bmi-1+/− mice and an expansion of the pre-B cell compartment in Eμ–myc but not in Eμ–myc;bmi-1+/− mice. (D) Flow-cytometric analysis of bone marrow cell suspensions of wild-type, Eμ–myc, and Eμ–myc;bmi-1+/− mice, cultured for 24 hr in 10% FBS/RPMI medium in the absence of specific growth factors and subsequently stained for B220 and Annexin-V. The apoptotic ratio Annexin-V+/Annexin-V of B220+ lymphocytes indicates the apoptosis susceptibility of bone marrow-derived pre-B cells. (E) Analysis of the percentage of Annexin-V+ cells within the pool of viable B220+/PIlymphocytes indicates a 10-fold increase in Eμ–myc;bmi-1+/− mice vs. Eμ–myc mice.
Figure 2
Figure 2
Bmi-1 inhibits c-Myc-induced apoptosis and strongly enhances proliferation in collaboration with myc in an ink4a–ARF-dependent manner. (A) Wild-type MEFs were infected at passage 1 with control (C) or bmi-1 (B) encoding retroviruses, at passage 2 with either control, mycER or mycHA-encoding retroviruses and analyzed for cell viability by trypan blue exclusion. mycER overexpressing cell populations were analyzed for cell death 0, 24, and 48 hr after transfer to 0.1% serum in the presence (circles) or absence (squares) of 125 nm 4-OHT (left). mycHA overexpressing cells were analyzed for cell death 0, 24, and 48 hr after transfer to 0.1% (circles) or 10% (squares) serum (right). Control-infected cultures remained viable for >95% during the entire experiment (not shown). Apoptotic cell death was confirmed by flow-cytrometric analysis of cells with a subdiploid DNA content. (B) Wild-type or ink4a–ARF−/− MEFs were infected at passage 1 with control (C, black bars) or bmi-1 (B, gray bars)-encoding retroviruses and subsequently at passage 2 with control or mycER retroviruses. After infection, cells were analyzed for subdiploid DNA content 24 hr after transfer to 0.1% serum (left), or for cell viability by trypan blue exclusion 0, 16, and 26 hr after transfer to 0.1% serum in the presence of 125 nm 4-OHT (right). (□ +/+C; █ +/+B; ○ −/−C; ● −/−B.) (C) Growth curves of wild-type (left) or ink4a–ARF−/− MEFs (right) infected at passage 1 with control (C) or bmi-1 (B) encoding retroviruses and at passage 2 with control or mycHA-encoding retroviruses. Experiments were performed at least three times, yielding highly reproducible results (all standard deviations were within 10% of the means shown) and similar data were obtained with lower levels of Myc by use of the mycER retrovirus in the absence of 4-OHT. (□ Control C; █ Control B; ○ MycHA C; ● MycHA B.)
Figure 2
Figure 2
Bmi-1 inhibits c-Myc-induced apoptosis and strongly enhances proliferation in collaboration with myc in an ink4a–ARF-dependent manner. (A) Wild-type MEFs were infected at passage 1 with control (C) or bmi-1 (B) encoding retroviruses, at passage 2 with either control, mycER or mycHA-encoding retroviruses and analyzed for cell viability by trypan blue exclusion. mycER overexpressing cell populations were analyzed for cell death 0, 24, and 48 hr after transfer to 0.1% serum in the presence (circles) or absence (squares) of 125 nm 4-OHT (left). mycHA overexpressing cells were analyzed for cell death 0, 24, and 48 hr after transfer to 0.1% (circles) or 10% (squares) serum (right). Control-infected cultures remained viable for >95% during the entire experiment (not shown). Apoptotic cell death was confirmed by flow-cytrometric analysis of cells with a subdiploid DNA content. (B) Wild-type or ink4a–ARF−/− MEFs were infected at passage 1 with control (C, black bars) or bmi-1 (B, gray bars)-encoding retroviruses and subsequently at passage 2 with control or mycER retroviruses. After infection, cells were analyzed for subdiploid DNA content 24 hr after transfer to 0.1% serum (left), or for cell viability by trypan blue exclusion 0, 16, and 26 hr after transfer to 0.1% serum in the presence of 125 nm 4-OHT (right). (□ +/+C; █ +/+B; ○ −/−C; ● −/−B.) (C) Growth curves of wild-type (left) or ink4a–ARF−/− MEFs (right) infected at passage 1 with control (C) or bmi-1 (B) encoding retroviruses and at passage 2 with control or mycHA-encoding retroviruses. Experiments were performed at least three times, yielding highly reproducible results (all standard deviations were within 10% of the means shown) and similar data were obtained with lower levels of Myc by use of the mycER retrovirus in the absence of 4-OHT. (□ Control C; █ Control B; ○ MycHA C; ● MycHA B.)
Figure 3
Figure 3
(A) Myc and Bmi-1 induce transformation of MEFs. Soft agar assay of MEFs infected at the first passage with control or bmi-1-encoding retroviruses and subsequently with control or myc-encoding retroviruses. (B) Bmi-1 inhibits induction of p19arf by Myc. Western blots showing p16, p19arf, MycHA, MycER, and Bmi-1 protein levels in wild-type MEFs infected first with control (C) or bmi-1 (B) retroviruses and subsequently with control, mycHA, or mycER retroviruses. Tubulin levels served as loading control. Bmi-1 overexpression leads to a down-regulation of p16 and p19arf levels, whereas overexpression of MycHA or MycER (in the absence of 4-OHT) induces p19arf but not p16. Combined overexpression of Bmi-1 and Myc completely abrogates the induction of p19arf by Myc.
Figure 3
Figure 3
(A) Myc and Bmi-1 induce transformation of MEFs. Soft agar assay of MEFs infected at the first passage with control or bmi-1-encoding retroviruses and subsequently with control or myc-encoding retroviruses. (B) Bmi-1 inhibits induction of p19arf by Myc. Western blots showing p16, p19arf, MycHA, MycER, and Bmi-1 protein levels in wild-type MEFs infected first with control (C) or bmi-1 (B) retroviruses and subsequently with control, mycHA, or mycER retroviruses. Tubulin levels served as loading control. Bmi-1 overexpression leads to a down-regulation of p16 and p19arf levels, whereas overexpression of MycHA or MycER (in the absence of 4-OHT) induces p19arf but not p16. Combined overexpression of Bmi-1 and Myc completely abrogates the induction of p19arf by Myc.
Figure 4
Figure 4
Dosage effects in ink4a–ARF+/− MEFs. (A) ink4a–ARF+/− MEFs proliferate faster than wild-type MEFs on overexpression of Myc. Growth curves of wild-type (+/+), ink4a–ARF+/− (right), and ink4a–ARF−/− (left) MEFs infected with mycER virus, in the presence (filled symbols) or absence (open symbols) of 250 nm 4-OHT. Analysis of GFP expression and Western analysis confirmed 100% infection and equal Myc protein levels for both wild-type and ink4a–ARF+/− MEFs. (B) ink4a–ARF+/− MEFs are more easily transformed by myc and ras oncogenes. First passage wild-type, ink4a–ARF+/−, and ink4a–ARF−/− MEFs were infected with control or rasV12-encoding retroviruses and subsequently infected with control or mycHA retroviruses, after which cells were analyzed for growth in soft agar. Photographs were taken 2 weeks after plating in soft agar. Similar data were obtained with the mycER virus in the absence of 4-OHT except that colonies were smaller. (C,D) ink4a–ARF+/−;ras/myc transformed colonies had retained the wild-type ink4a–ARF allele and wild-type p53. (C) PCR analysis of the wild-type (WT) and mutated (KO) ink4a–ARF allele for 9 of 16 tested ink4a–ARF+/−;ras/myc soft agar colonies, picked out of the agar 2 weeks after plating and directly subjected to DNA isolation and PCR. LOH was found for only one case. DNA isolated from wild-type, ink4a–ARF+/−, and ink4a–ARF−/− MEFs served as controls (D) Western blot analysis of mutant p53 in ink4a–ARF+/−;ras/myc soft agar colonies, picked out of the agar at 1.5 weeks after plating and expanded for 1.5 weeks prior to lysis. MEFs established as an immortal cell line according to a standard 3T3 protocol (lane 1) contained mutant p53, however primary wild-type MEFs (lane 2) and 6 of 12 tested ink4a–ARF+/−;ras/myc colonies (lanes 3–8) did not. Analysis of tubulin levels served as loading control. (E) Induction of p19arf in wild-type and ink4a–ARF+/− MEFs infected with mycER virus and cultured in the presence (+) or absence (−) of 250 nm 4-OHT.
Figure 4
Figure 4
Dosage effects in ink4a–ARF+/− MEFs. (A) ink4a–ARF+/− MEFs proliferate faster than wild-type MEFs on overexpression of Myc. Growth curves of wild-type (+/+), ink4a–ARF+/− (right), and ink4a–ARF−/− (left) MEFs infected with mycER virus, in the presence (filled symbols) or absence (open symbols) of 250 nm 4-OHT. Analysis of GFP expression and Western analysis confirmed 100% infection and equal Myc protein levels for both wild-type and ink4a–ARF+/− MEFs. (B) ink4a–ARF+/− MEFs are more easily transformed by myc and ras oncogenes. First passage wild-type, ink4a–ARF+/−, and ink4a–ARF−/− MEFs were infected with control or rasV12-encoding retroviruses and subsequently infected with control or mycHA retroviruses, after which cells were analyzed for growth in soft agar. Photographs were taken 2 weeks after plating in soft agar. Similar data were obtained with the mycER virus in the absence of 4-OHT except that colonies were smaller. (C,D) ink4a–ARF+/−;ras/myc transformed colonies had retained the wild-type ink4a–ARF allele and wild-type p53. (C) PCR analysis of the wild-type (WT) and mutated (KO) ink4a–ARF allele for 9 of 16 tested ink4a–ARF+/−;ras/myc soft agar colonies, picked out of the agar 2 weeks after plating and directly subjected to DNA isolation and PCR. LOH was found for only one case. DNA isolated from wild-type, ink4a–ARF+/−, and ink4a–ARF−/− MEFs served as controls (D) Western blot analysis of mutant p53 in ink4a–ARF+/−;ras/myc soft agar colonies, picked out of the agar at 1.5 weeks after plating and expanded for 1.5 weeks prior to lysis. MEFs established as an immortal cell line according to a standard 3T3 protocol (lane 1) contained mutant p53, however primary wild-type MEFs (lane 2) and 6 of 12 tested ink4a–ARF+/−;ras/myc colonies (lanes 3–8) did not. Analysis of tubulin levels served as loading control. (E) Induction of p19arf in wild-type and ink4a–ARF+/− MEFs infected with mycER virus and cultured in the presence (+) or absence (−) of 250 nm 4-OHT.
Figure 5
Figure 5
Severe acceleration of lymphomagenesis in Eμ–myc;ink4a–ARF+/− mice. (A) Eμ–myc;ink4a–ARF+/− mice quickly die of aggressive B-cell tumors. Kaplan-Meier survival plot of Eμ–myc; ink4a–ARF+/− mice and Eμ–myc mice. (B) Haematoxylin-eosin-stained sections of tumors that arose in Eμ–myc;ink4a–ARF+/− and Eμ–myc mice and of blood from these and ink4a–ARF−/− mice. (A) Representative example of an Eμ–myc;ink4a–ARF+/− tumor invading the liver; (B) a blood vessel in the lung of an Eμ–myc;ink4a–ARF+/− mouse filled with tumor cells. (C) A representative example of a blood vessel in the lung of an Eμ–myc mouse, which is free of tumor cells; (D-F) blood of Eμ–myc;ink4a–ARF+/− (D), Eμ–myc (E), and ink4a–ARF−/− (F) mice. Note that in contrast to the Eμ–myc and ink4a–ARF−/− mice, the blood of Eμ–myc;ink4a–ARF+/− mice is highly leukemic. (G, H) A higher magnification of a representative example of tumors that arose in Eμ–myc;ink4a–ARF+/− (G) and Eμ–myc (H) mice. Note the presence of more pyknotic tumor cells, which are indicative of apoptosis, in Eμ–myc tumors compared to Eμ–myc;ink4a–ARF+/− tumors. Photographs were taken at 10-fold (A-C) and 20-fold (D-H) magnification. (C) Flow-cytrometric analysis of cell suspensions of three Eμ–myc;ink4a–ARF+/− tumors after staining for cell surface CD8, CD4, sIgM, and B220. (D) Southern blot analysis of ink4a–ARF status of genomic DNA isolated from normal liver (L) or tumor (T) tissue showing LOH of the ink4a–ARF locus in tumors arising in Eμ–myc;ink4a–ARF+/− (lanes 1) and CD2–myc;ink4a–ARF+/− (lanes 3) mice but not in CD2–myc (lanes 2) Eμ–myc (lanes 5) and Eμ–bmi-1;ink4a–ARF+/− (lanes 4) mice.
Figure 5
Figure 5
Severe acceleration of lymphomagenesis in Eμ–myc;ink4a–ARF+/− mice. (A) Eμ–myc;ink4a–ARF+/− mice quickly die of aggressive B-cell tumors. Kaplan-Meier survival plot of Eμ–myc; ink4a–ARF+/− mice and Eμ–myc mice. (B) Haematoxylin-eosin-stained sections of tumors that arose in Eμ–myc;ink4a–ARF+/− and Eμ–myc mice and of blood from these and ink4a–ARF−/− mice. (A) Representative example of an Eμ–myc;ink4a–ARF+/− tumor invading the liver; (B) a blood vessel in the lung of an Eμ–myc;ink4a–ARF+/− mouse filled with tumor cells. (C) A representative example of a blood vessel in the lung of an Eμ–myc mouse, which is free of tumor cells; (D-F) blood of Eμ–myc;ink4a–ARF+/− (D), Eμ–myc (E), and ink4a–ARF−/− (F) mice. Note that in contrast to the Eμ–myc and ink4a–ARF−/− mice, the blood of Eμ–myc;ink4a–ARF+/− mice is highly leukemic. (G, H) A higher magnification of a representative example of tumors that arose in Eμ–myc;ink4a–ARF+/− (G) and Eμ–myc (H) mice. Note the presence of more pyknotic tumor cells, which are indicative of apoptosis, in Eμ–myc tumors compared to Eμ–myc;ink4a–ARF+/− tumors. Photographs were taken at 10-fold (A-C) and 20-fold (D-H) magnification. (C) Flow-cytrometric analysis of cell suspensions of three Eμ–myc;ink4a–ARF+/− tumors after staining for cell surface CD8, CD4, sIgM, and B220. (D) Southern blot analysis of ink4a–ARF status of genomic DNA isolated from normal liver (L) or tumor (T) tissue showing LOH of the ink4a–ARF locus in tumors arising in Eμ–myc;ink4a–ARF+/− (lanes 1) and CD2–myc;ink4a–ARF+/− (lanes 3) mice but not in CD2–myc (lanes 2) Eμ–myc (lanes 5) and Eμ–bmi-1;ink4a–ARF+/− (lanes 4) mice.
Figure 6
Figure 6
Increased apoptosis in the thymus of bmi-1−/− mice is rescued by deletion of ink4a–ARF. Flow-cytometric analysis of freshly isolated thymocytes of ∼6-week-old ink4a–ARF+/−, bmi-1−/−;ink4a–ARF+/−, and bmi-1−/−;ink4a–ARF−/− mice after staining for cell-surface CD4 and CD8 (left) and of CD4-positive thymocytes after staining for Annexin-V (right).
Figure 7
Figure 7
Bcl2 overexpression partially rescues cellularity in bmi-1−/− spleen (black bars) and thymus (gray bars). (A) Percent nucleated cells in thymus and spleen of ∼6-week-old wild-type, SVbcl2, bmi-1−/−, SVbcl2;bmi-1−/− mice (left) and of wild-type, Eμ–bcl2, bmi-1−/−, Eμ–bcl2;bmi-1−/− mice (right). (B) Flow-cytometric analysis of thymocytes and splenocytes of wild-type, SVbcl2, bmi-1−/−, and SVbcl2;bmi-1−/− mice.
Figure 7
Figure 7
Bcl2 overexpression partially rescues cellularity in bmi-1−/− spleen (black bars) and thymus (gray bars). (A) Percent nucleated cells in thymus and spleen of ∼6-week-old wild-type, SVbcl2, bmi-1−/−, SVbcl2;bmi-1−/− mice (left) and of wild-type, Eμ–bcl2, bmi-1−/−, Eμ–bcl2;bmi-1−/− mice (right). (B) Flow-cytometric analysis of thymocytes and splenocytes of wild-type, SVbcl2, bmi-1−/−, and SVbcl2;bmi-1−/− mice.

References

    1. Akashi K, Kondo M, von Freeden-Jeffry U, Murray R, Weissman I. Bcl-2 rescues T lymphopoieses in Interleukin-7 receptor-deficient mice. Cell. 1997;89:1033–1041. - PubMed
    1. Alkema MJ, Jacobs H, van Lohuizen M, Berns A. Perturbation of B and T cell development and predisposition to lymphomagenesis in Eμ-Bmi1 transgenic mice require the Bmi1 RING finger. Oncogene. 1997;15:899–910. - PubMed
    1. Assoian RK. Anchorage-dependent cell cycle progression. J Cell Biol. 1997;136:1–4. - PMC - PubMed
    1. Bissonette RP, Echeverri F, Mahboubi A, Green DR. Apoptotic cell death induced by c-myc is inhibited by bcl-2. Nature. 1992;359:522–554. - PubMed
    1. Blyth K, Terry A, O'Hara M, Baxter EW, Campbell M, Stewart M, Donehower LA, Onions DE, Neil JC, Cameron ER. Synergy between a human c-myc transgene and p53 null genotype in murine thymic lymphomas; contrasting effects of homozygous and heterozygous p53 loss. Oncogene. 1995;10:1717–1723. - PubMed

MeSH terms

LinkOut - more resources