

Metabolic flux ratio analysis of genetic and environmental modulations of Escherichia coli central carbon metabolism
- PMID: 10542169
- PMCID: PMC94132
- DOI: 10.1128/JB.181.21.6679-6688.1999
Metabolic flux ratio analysis of genetic and environmental modulations of Escherichia coli central carbon metabolism
Abstract
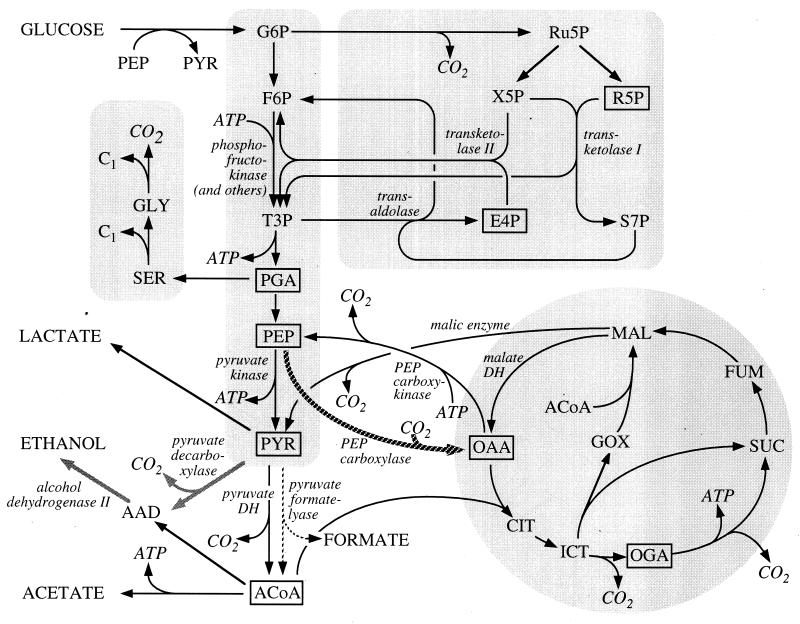
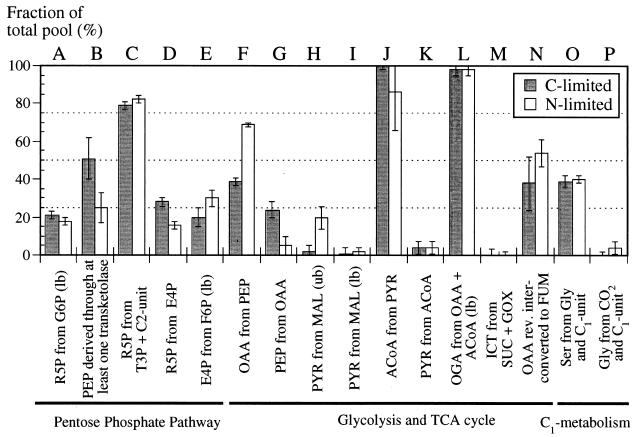
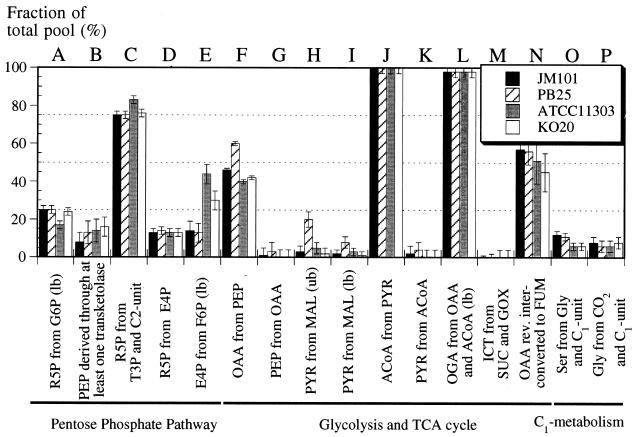
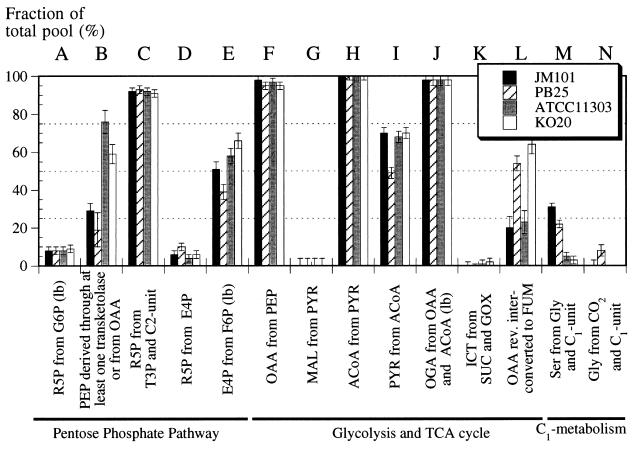
The response of Escherichia coli central carbon metabolism to genetic and environmental manipulation has been studied by use of a recently developed methodology for metabolic flux ratio (METAFoR) analysis; this methodology can also directly reveal active metabolic pathways. Generation of fluxome data arrays by use of the METAFoR approach is based on two-dimensional (13)C-(1)H correlation nuclear magnetic resonance spectroscopy with fractionally labeled biomass and, in contrast to metabolic flux analysis, does not require measurements of extracellular substrate and metabolite concentrations. METAFoR analyses of E. coli strains that moderately overexpress phosphofructokinase, pyruvate kinase, pyruvate decarboxylase, or alcohol dehydrogenase revealed that only a few flux ratios change in concert with the overexpression of these enzymes. Disruption of both pyruvate kinase isoenzymes resulted in altered flux ratios for reactions connecting the phosphoenolpyruvate (PEP) and pyruvate pools but did not significantly alter central metabolism. These data indicate remarkable robustness and rigidity in central carbon metabolism in the presence of genetic variation. More significant physiological changes and flux ratio differences were seen in response to altered environmental conditions. For example, in ammonia-limited chemostat cultures, compared to glucose-limited chemostat cultures, a reduced fraction of PEP molecules was derived through at least one transketolase reaction, and there was a higher relative contribution of anaplerotic PEP carboxylation than of the tricarboxylic acid (TCA) cycle for oxaloacetate synthesis. These two parameters also showed significant variation between aerobic and anaerobic batch cultures. Finally, two reactions catalyzed by PEP carboxykinase and malic enzyme were identified by METAFoR analysis; these had previously been considered absent in E. coli cells grown in glucose-containing media. Backward flux from the TCA cycle to glycolysis, as indicated by significant activity of PEP carboxykinase, was found only in glucose-limited chemostat culture, demonstrating that control of this futile cycle activity is relaxed under severe glucose limitation.
Figures
Similar articles
-
Metabolic flux responses to pyruvate kinase knockout in Escherichia coli.J Bacteriol. 2002 Jan;184(1):152-64. doi: 10.1128/JB.184.1.152-164.2002. J Bacteriol. 2002. PMID: 11741855 Free PMC article.
-
Consequences of phosphoenolpyruvate:sugar phosphotranferase system and pyruvate kinase isozymes inactivation in central carbon metabolism flux distribution in Escherichia coli.Microb Cell Fact. 2012 Sep 13;11:127. doi: 10.1186/1475-2859-11-127. Microb Cell Fact. 2012. PMID: 22973998 Free PMC article.
-
Analysis of Escherichia coli anaplerotic metabolism and its regulation mechanisms from the metabolic responses to altered dilution rates and phosphoenolpyruvate carboxykinase knockout.Biotechnol Bioeng. 2003 Oct 20;84(2):129-44. doi: 10.1002/bit.10692. Biotechnol Bioeng. 2003. PMID: 12966569
-
Alteration of the biochemical valves in the central metabolism of Escherichia coli.Ann N Y Acad Sci. 1994 Nov 30;745:21-34. doi: 10.1111/j.1749-6632.1994.tb44361.x. Ann N Y Acad Sci. 1994. PMID: 7832509 Review.
-
Flux analysis and control of the central metabolic pathways in Escherichia coli.FEMS Microbiol Rev. 1996 Dec;19(2):85-116. doi: 10.1111/j.1574-6976.1996.tb00255.x. FEMS Microbiol Rev. 1996. PMID: 8988566 Review.
Cited by
-
Synthesis of Metabolites and Metabolite-like Compounds Using Biocatalytic Systems.Metabolites. 2023 Oct 19;13(10):1097. doi: 10.3390/metabo13101097. Metabolites. 2023. PMID: 37887422 Free PMC article. Review.
-
Decoding the dynamics of cellular metabolism and the action of 3-bromopyruvate and 2-deoxyglucose using pulsed stable isotope-resolved metabolomics.Cancer Metab. 2014 Jun 30;2:9. doi: 10.1186/2049-3002-2-9. eCollection 2014. Cancer Metab. 2014. PMID: 25035808 Free PMC article.
-
Physiological and proteomic analysis of Escherichia coli iron-limited chemostat growth.J Bacteriol. 2014 Aug;196(15):2748-61. doi: 10.1128/JB.01606-14. Epub 2014 May 16. J Bacteriol. 2014. PMID: 24837288 Free PMC article.
-
13C based proteinogenic amino acid (PAA) and metabolic flux ratio analysis of Lactococcus lactis reveals changes in pentose phosphate (PP) pathway in response to agitation and temperature related stresses.PeerJ. 2017 Jul 5;5:e3451. doi: 10.7717/peerj.3451. eCollection 2017. PeerJ. 2017. PMID: 28695065 Free PMC article.
-
A comprehensive evaluation of constraining amino acid biosynthesis in compartmented models for metabolic flux analysis.Metab Eng Commun. 2017 Jul 11;5:34-44. doi: 10.1016/j.meteno.2017.07.001. eCollection 2017 Dec. Metab Eng Commun. 2017. PMID: 29188182 Free PMC article.
References
-
- Bachmann B J. Derivations and genotypes of some mutant derivatives of Escherichia coli K-12. In: Neidhardt F C, Curtiss III R, Ingraham J L, Lin E C C, Low K B, Magasanik B, Reznikoff W S, Riley M, Schaechter M, Umbarger H E, editors. Escherichia coli and Salmonella: cellular and molecular biology. 2nd ed. Washington, D.C.: ASM Press; 1996. pp. 2460–2488.
-
- Bax A, Pochapsky S. Optimized recording of heteronuclear multidimensional NMR spectra using pulsed field gradients. J Magn Reson. 1992;99:638–643.
-
- Bodenhausen G, Ruben D. Natural abundance nitrogen-15 NMR by enhanced heteronuclear spectroscopy. Chem Phys Lett. 1980;69:185–188.
-
- Brown A J P. Control of metabolic flux in yeasts and fungi. Trends Biotechnol. 1997;15:445–447. - PubMed
-
- DeMarco A, Wüthrich K. Digital filtering with a sinusoidal window function: an alternative technique for resolution enhancement in FT NMR. J Magn Reson. 1976;24:201–204.
Publication types
MeSH terms
Substances
LinkOut - more resources
Full Text Sources
Other Literature Sources
Molecular Biology Databases
Miscellaneous
