

Flagellate predation on a bacterial model community: interplay of size-selective grazing, specific bacterial cell size, and bacterial community composition
- PMID: 10543797
- PMCID: PMC91655
- DOI: 10.1128/AEM.65.11.4863-4872.1999
Flagellate predation on a bacterial model community: interplay of size-selective grazing, specific bacterial cell size, and bacterial community composition
Abstract
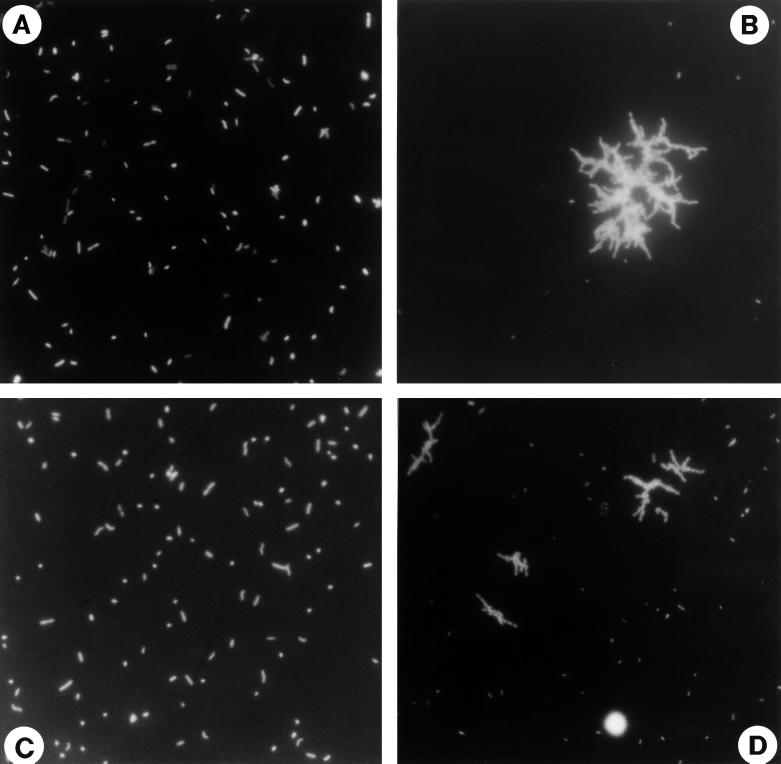
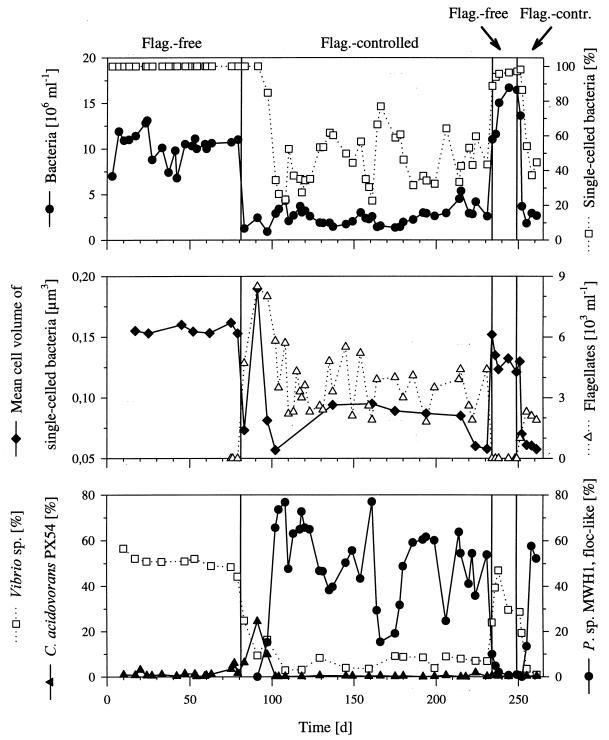
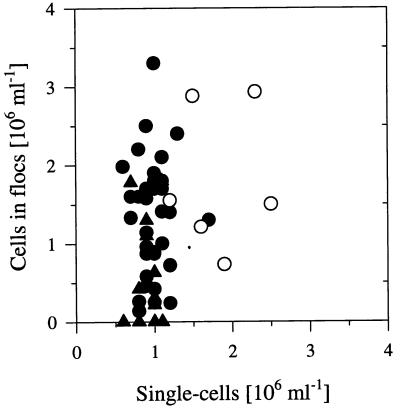
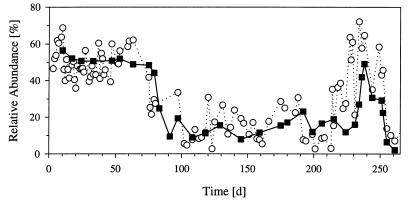
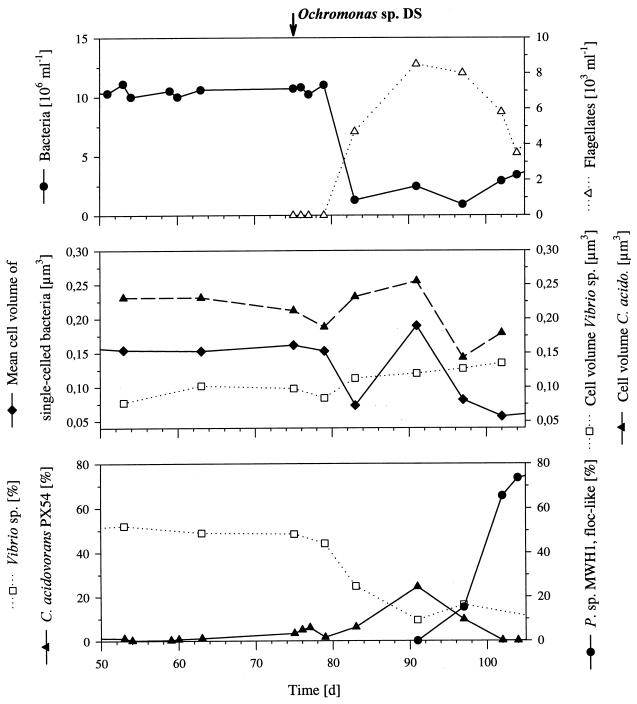
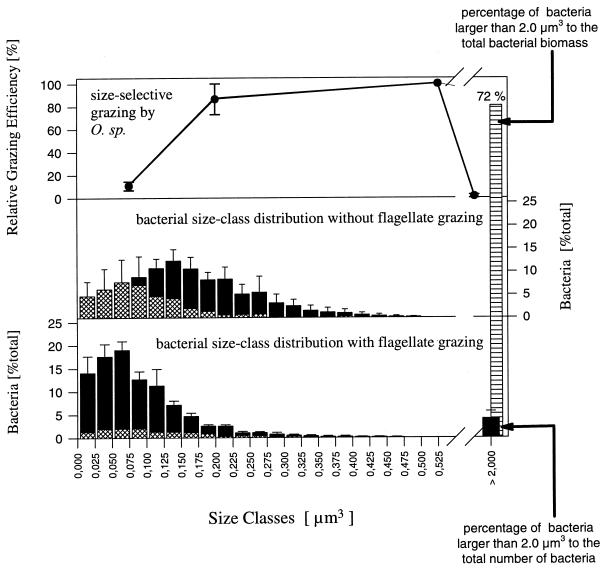
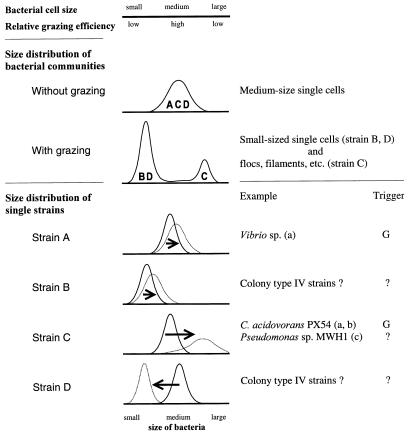
The influence of grazing by the bacterivorous nanoflagellate Ochromonas sp. strain DS on the taxonomic and morphological structures of a complex bacterial community was studied in one-stage chemostat experiments. A bacterial community, consisting of at least 30 different strains, was fed with a complex carbon source under conditions of low growth rate (0.5 day(-1) when nongrazed) and low substrate concentration (9 mg liter(-1)). Before and after the introduction of the predator, the bacterial community composition was studied by in situ techniques (immunofluorescence microscopy and fluorescent in situ hybridization), as well as by cultivation on agar media. The cell sizes of nonspecifically stained and immunofluorescently labeled bacteria were measured by image analysis. Grazing by the flagellate caused a bidirectional change in the morphological structure of the community. Medium-size bacterial cells, which dominated the nongrazed community, were largely replaced by smaller cells, as well as by cells contained in large multicellular flocs. Cell morphological changes were combined with community taxonomic changes. After introduction of the flagellate, the dominating strains with medium-size cells were largely replaced by single-celled strains with smaller cells on the one hand and, on the other hand, by Pseudomonas sp. strain MWH1, which formed the large, floc-like forms. We assume that size-selective grazing was the major force controlling both the morphological and the taxonomic structures of the model community.
Figures
Similar articles
-
Role of Microcolony Formation in the Protistan Grazing Defense of the Aquatic Bacterium Pseudomonas sp. MWH1.Microb Ecol. 2000 Apr;39(3):175-185. doi: 10.1007/s002480000026. Microb Ecol. 2000. PMID: 12035094
-
Grazing Pressure by a Bacterivorous Flagellate Reverses the Relative Abundance of Comamonas acidovorans PX54 and Vibrio Strain CB5 in Chemostat Cocultures.Appl Environ Microbiol. 1998 May 1;64(5):1910-8. doi: 10.1128/AEM.64.5.1910-1918.1998. Appl Environ Microbiol. 1998. PMID: 9572971 Free PMC article.
-
Food selection by bacterivorous protists: insight from the analysis of the food vacuole content by means of fluorescence in situ hybridization.FEMS Microbiol Ecol. 2005 May 1;52(3):351-63. doi: 10.1016/j.femsec.2004.12.001. Epub 2005 Jan 19. FEMS Microbiol Ecol. 2005. PMID: 16329920
-
Predation as a shaping force for the phenotypic and genotypic composition of planktonic bacteria.Antonie Van Leeuwenhoek. 2002 Aug;81(1-4):413-34. doi: 10.1023/a:1020505204959. Antonie Van Leeuwenhoek. 2002. PMID: 12448740 Review.
-
Off the hook--how bacteria survive protozoan grazing.Trends Microbiol. 2005 Jul;13(7):302-7. doi: 10.1016/j.tim.2005.05.009. Trends Microbiol. 2005. PMID: 15935676 Review.
Cited by
-
Fate of heterotrophic microbes in pelagic habitats: focus on populations.Microbiol Mol Biol Rev. 2005 Sep;69(3):440-61. doi: 10.1128/MMBR.69.3.440-461.2005. Microbiol Mol Biol Rev. 2005. PMID: 16148306 Free PMC article. Review.
-
Prey food quality affects flagellate ingestion rates.Microb Ecol. 2007 Jan;53(1):66-73. doi: 10.1007/s00248-006-9140-y. Epub 2006 Dec 22. Microb Ecol. 2007. PMID: 17186152
-
Diversity and seasonal variability of beta-Proteobacteria in biofilms of polluted rivers: analysis by temperature gradient gel electrophoresis and cloning.Appl Environ Microbiol. 2003 Aug;69(8):4463-73. doi: 10.1128/AEM.69.8.4463-4473.2003. Appl Environ Microbiol. 2003. PMID: 12902230 Free PMC article.
-
Fractal Hypothesis of the Pelagic Microbial Ecosystem-Can Simple Ecological Principles Lead to Self-Similar Complexity in the Pelagic Microbial Food Web?Front Microbiol. 2015 Dec 1;6:1357. doi: 10.3389/fmicb.2015.01357. eCollection 2015. Front Microbiol. 2015. PMID: 26648929 Free PMC article.
-
Heterotrophic free-living and particle-bound bacterial cell size in the river Cauvery and its downstream tributaries.J Biosci. 2007 Mar;32(2):363-74. doi: 10.1007/s12038-007-0035-y. J Biosci. 2007. PMID: 17435327
References
-
- Andersson A, Larsson U, Hagström Å. Size-selective grazing by a microflagellate on pelagic bacteria. Mar Ecol Prog Ser. 1986;33:51–57.
-
- Berninger U-G, Finlay B J, Kuuppo-Leinikki P. Protozoan control of bacterial abundances in freshwater. Limnol Oceanogr. 1991;36:139–147.
-
- Bremer H, Dennis P P. Modulation of chemical composition and other parameters of the cell by growth rate. In: Neidhardt F C, Curtiss III R, Ingraham J P, Lin E C C, Low K B, Magasanik B, Rezikoff W S, Riley M, Schaechter M, Umbarger H E, editors. Escherichia coli and Salmonella: cellular and molecular biology. 2nd ed. Washington, D.C.: American Society for Microbiology; 1996. pp. 1533–1569.
-
- Christoffersen K, Nybroe O, Jürgens K, Hansen M. Measurement of bacterivory by heterotrophic nanoflagellates using immunofluorescence labelling of ingested cells. Aquat Microb Ecol. 1997;13:127–134.
Publication types
MeSH terms
Substances
LinkOut - more resources
Full Text Sources
Molecular Biology Databases
