. 1999 Nov 1;190(9):1215-26.
doi: 10.1084/jem.190.9.1215.

CD1-reactive natural killer T cells are required for development of systemic tolerance through an immune-privileged site

Affiliations

CD1-reactive natural killer T cells are required for development of systemic tolerance through an immune-privileged site

K H Sonoda et al. J Exp Med. .

Abstract

Systemic tolerance can be elicited by introducing antigen into an immune-privileged site, such as the eye, or directly into the blood. Both routes of immunization result in a selective deficiency of systemic delayed type hypersensitivity. Although the experimental animal model of anterior chamber-associated immune deviation (ACAID) occurs in most mouse strains, ACAID cannot be induced in several mutant mouse strains that are coincidentally deficient in natural killer T (NKT) cells. Therefore, this model for immune-privileged site-mediated tolerance provided us with an excellent format for studying the role of NKT cells in the development of tolerance. The following data show that CD1-reactive NKT cells are required for the development of systemic tolerance induced via the eye as follows: (a) CD1 knockout mice were unable to develop ACAID unless they were reconstituted with NKT cells together with CD1(+) antigen-presenting cells; (b) specific antibody depletion of NKT cells in vivo abrogated the development of ACAID; and (c) anti-CD1 monoclonal antibody treatment of wild-type mice prevented ACAID development. Significantly, CD1-reactive NKT cells were not required for intravenously induced systemic tolerance, thereby establishing that different mechanisms mediate development of tolerance to antigens inoculated by these routes. A critical role for NKT cells in the development of systemic tolerance associated with an immune-privileged site suggests a mechanism involving NKT cells in self-tolerance and their defects in autoimmunity.


Figures

Figure 1
Figure 1
Generation of ACAID correlates with increased number of NKT cells in the spleen. ACAID was induced in mice as described previously. In brief, B6 mice were killed 7 d after ac inoculation of OVA. Column-enriched splenic T cells were harvested from ac-inoculated and uninoculated mice by application to IMMULAN™ columns, and stained for analysis by flow cytometry to determine the ratio of NK and NKT cells present within the lymphocyte gate for individual animals. Fluorescence for the TCR β chain (CyChrome 5) and the NK1.1 marker (PE) are shown on the ordinate and abscissa, respectively. The percentage of cells within the NK cell quadrant (rectangle) and the NKT cell quadrant (square) are indicated for the representative experiment shown. Absolute number (mean ± SEM) of NK and NKT cells was calculated from the precounted viable cell numbers in individual animals (n = 5), and is shown below the abscissa. Significant differences (P ≤ 0.05) are indicated by an asterisk.
Figure 2
Figure 2
ACAID in CD1 KO mice. (A) ACAID induction in CD1 KO mice. For clarity, the inset shows the ACAID protocol. Five CD1 KO mice and five WT mice were inoculated (ac) with OVA 7 d before subcutaneous sensitization with OVA and CFA. Mice were challenged with OVA-pulsed PECs derived from F1 mice into the ear pinnae 7 d after subcutaneous sensitization. Ear swelling measurements (24 h after ear challenge) are shown on the ordinate. Treatment of the mice in each group represented by the bars is shown below the abscissa. Significant differences (P ≤ 0.05) are indicated by an asterisk. (B) Regulatory cell induction in CD1 KO mice. A LAT assay (inset shows the LAT protocol) was performed to assess the development of efferent regulatory T cells. The black bar represents results using (B6 × 129)F2 CD1 KO mice. Column-enriched splenic T cells harvested from ac-inoculated WT mice or CD1 KO mice (five per group) 7 d earlier were used as regulator cells and cotransferred into F1 mice (five per group) with effector and stimulator cells from F1 mice. The hatched bars represent results from similar studies using B6 KO and B6 mice. Ear swelling measurements (24 h after ear challenge) are shown on the ordinate, and the mixture of cells inoculated into the ear pinnae is indicated below the abscissa. Significant differences (P ≤ 0.05) are indicated by an asterisk.
Figure 2
Figure 2
ACAID in CD1 KO mice. (A) ACAID induction in CD1 KO mice. For clarity, the inset shows the ACAID protocol. Five CD1 KO mice and five WT mice were inoculated (ac) with OVA 7 d before subcutaneous sensitization with OVA and CFA. Mice were challenged with OVA-pulsed PECs derived from F1 mice into the ear pinnae 7 d after subcutaneous sensitization. Ear swelling measurements (24 h after ear challenge) are shown on the ordinate. Treatment of the mice in each group represented by the bars is shown below the abscissa. Significant differences (P ≤ 0.05) are indicated by an asterisk. (B) Regulatory cell induction in CD1 KO mice. A LAT assay (inset shows the LAT protocol) was performed to assess the development of efferent regulatory T cells. The black bar represents results using (B6 × 129)F2 CD1 KO mice. Column-enriched splenic T cells harvested from ac-inoculated WT mice or CD1 KO mice (five per group) 7 d earlier were used as regulator cells and cotransferred into F1 mice (five per group) with effector and stimulator cells from F1 mice. The hatched bars represent results from similar studies using B6 KO and B6 mice. Ear swelling measurements (24 h after ear challenge) are shown on the ordinate, and the mixture of cells inoculated into the ear pinnae is indicated below the abscissa. Significant differences (P ≤ 0.05) are indicated by an asterisk.
Figure 3
Figure 3
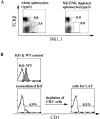
Effect of NKT cell reconstitution on ability of CD1 KO mice to develop ACAID. (A) Flow cytometry confirmation of NK and NKT cell depletion in vitro. Spleen cells from F1 mice were treated with FITC-conjugated anti-NK1.1 mAb, biotin-conjugated Ly49C mAbs, and MicroBead-conjugated anti–mouse pan-NK cell Ab before treatment with anti-FITC MicroBeads and streptavidin MicroBeads, and exposure to a magnetic field to remove NK and NKT cells. The negatively selected cells, and the similarly treated whole spleen cell population not exposed to the magnetic field, were stained with CyChrome 5–conjugated anti–TCR β chain mAb and analyzed by flow cytometry. Fluorescence for CyChrome 5–TCR β chain and FITC-NK1.1 are shown on the ordinate and abscissa, respectively. The percentage of cells within the NKT cell (square) and the NK cell (rectangle) quadrants are listed in the blocks before (whole splenocytes, type 1) and after (NK and NKT depleted, type 2) depletion. (B) Flow cytometry confirmation of CD1+ cell depletion. 7 d after reconstitution with whole spleen cells (type 1) or NK and NKT cell–depleted spleen cells (type 2, Fig. 3 A), five mice from each reconstituted CD1 KO mouse group were inoculated (ac) with OVA. Column-enriched splenic T cells were harvested 1 wk after ac inoculation, and CD1+ cells were removed. Cells were stained with biotin-conjugated anti-CD1 (1B1), then treated with streptavidin MicroBeads and applied to MiniMACS columns to deplete CD1+ cells. Flow cytometry–generated graphs show the relative number of cells (ordinate) versus the increasing fluorescence channels (abscissa) that identify PE-streptavidin-biotin–conjugated anti-CD1 mAb–labeled cells. “KO & WT control” shows the fluorescence pattern of splenic T cells from unreconstituted CD1 KO (open) or WT (shaded) mice; “reconstituted KO” shows the pattern of CD1+ cells after reconstitution; “cells for LAT” shows the pattern of CD1+ cells after negative selection. The percentage of CD1+ cells is indicated in each of the lower blocks. (C) LAT assay for CD1 T cell regulator function. CD1 T cells from reconstituted CD1 KO mice (regulator) were cotransferred with effector and stimulator cells from F1 mice into the ear pinnae of naive F1 mice. Adoptively transferred regulator cells from reconstituted mice that did not receive ac inoculation were used as a control. Ear swelling measurements (24 h after ear challenge) are shown on the ordinate, and the identity of the cell mixture inoculated into the ear pinnae for each group (five per group) is indicated below the abscissa. Significant differences (P ≤ 0.05) are indicated by an asterisk.
Figure 3
Figure 3
Effect of NKT cell reconstitution on ability of CD1 KO mice to develop ACAID. (A) Flow cytometry confirmation of NK and NKT cell depletion in vitro. Spleen cells from F1 mice were treated with FITC-conjugated anti-NK1.1 mAb, biotin-conjugated Ly49C mAbs, and MicroBead-conjugated anti–mouse pan-NK cell Ab before treatment with anti-FITC MicroBeads and streptavidin MicroBeads, and exposure to a magnetic field to remove NK and NKT cells. The negatively selected cells, and the similarly treated whole spleen cell population not exposed to the magnetic field, were stained with CyChrome 5–conjugated anti–TCR β chain mAb and analyzed by flow cytometry. Fluorescence for CyChrome 5–TCR β chain and FITC-NK1.1 are shown on the ordinate and abscissa, respectively. The percentage of cells within the NKT cell (square) and the NK cell (rectangle) quadrants are listed in the blocks before (whole splenocytes, type 1) and after (NK and NKT depleted, type 2) depletion. (B) Flow cytometry confirmation of CD1+ cell depletion. 7 d after reconstitution with whole spleen cells (type 1) or NK and NKT cell–depleted spleen cells (type 2, Fig. 3 A), five mice from each reconstituted CD1 KO mouse group were inoculated (ac) with OVA. Column-enriched splenic T cells were harvested 1 wk after ac inoculation, and CD1+ cells were removed. Cells were stained with biotin-conjugated anti-CD1 (1B1), then treated with streptavidin MicroBeads and applied to MiniMACS columns to deplete CD1+ cells. Flow cytometry–generated graphs show the relative number of cells (ordinate) versus the increasing fluorescence channels (abscissa) that identify PE-streptavidin-biotin–conjugated anti-CD1 mAb–labeled cells. “KO & WT control” shows the fluorescence pattern of splenic T cells from unreconstituted CD1 KO (open) or WT (shaded) mice; “reconstituted KO” shows the pattern of CD1+ cells after reconstitution; “cells for LAT” shows the pattern of CD1+ cells after negative selection. The percentage of CD1+ cells is indicated in each of the lower blocks. (C) LAT assay for CD1 T cell regulator function. CD1 T cells from reconstituted CD1 KO mice (regulator) were cotransferred with effector and stimulator cells from F1 mice into the ear pinnae of naive F1 mice. Adoptively transferred regulator cells from reconstituted mice that did not receive ac inoculation were used as a control. Ear swelling measurements (24 h after ear challenge) are shown on the ordinate, and the identity of the cell mixture inoculated into the ear pinnae for each group (five per group) is indicated below the abscissa. Significant differences (P ≤ 0.05) are indicated by an asterisk.
Figure 4
Figure 4
Analysis of NKT and NK cells as efferent regulatory DTH cells in the LAT assay. (A) Flow cytometry confirmation of NKT and NK cell depletion in vitro. Column-enriched splenic T cells were harvested from B6 mice 7 d after OVA (ac) inoculation. All NK1.1+ cells were removed from the T cell–enriched populations with a magnetic field after treatment with a mixture of FITC–anti-NK1.1, biotin–anti-Ly49C mAbs, and anti–pan-NK cell conjugated Microbeads, and anti-FITC and streptavidin MicroBeads. CyChrome 5–conjugated anti–TCR β chain and FITC-conjugated anti-NK1.1 cells are shown in the dot plots for cells before and after treatment. The percentage of labeled cells is shown next to the square and rectangle for NKT and NK cells, respectively. (B) The effect of NKT and NK cell depletion on efferent regulation of DTH. Ear swelling was measured 24 h after cell transfer of the various cell mixtures (indicated below the abscissa for each bar) into the ear pinnae of naive syngeneic mice (five per group), and is shown on the ordinate. Significant differences (P ≤ 0.05) are indicated by an asterisk.
Figure 4
Figure 4
Analysis of NKT and NK cells as efferent regulatory DTH cells in the LAT assay. (A) Flow cytometry confirmation of NKT and NK cell depletion in vitro. Column-enriched splenic T cells were harvested from B6 mice 7 d after OVA (ac) inoculation. All NK1.1+ cells were removed from the T cell–enriched populations with a magnetic field after treatment with a mixture of FITC–anti-NK1.1, biotin–anti-Ly49C mAbs, and anti–pan-NK cell conjugated Microbeads, and anti-FITC and streptavidin MicroBeads. CyChrome 5–conjugated anti–TCR β chain and FITC-conjugated anti-NK1.1 cells are shown in the dot plots for cells before and after treatment. The percentage of labeled cells is shown next to the square and rectangle for NKT and NK cells, respectively. (B) The effect of NKT and NK cell depletion on efferent regulation of DTH. Ear swelling was measured 24 h after cell transfer of the various cell mixtures (indicated below the abscissa for each bar) into the ear pinnae of naive syngeneic mice (five per group), and is shown on the ordinate. Significant differences (P ≤ 0.05) are indicated by an asterisk.
Figure 5
Figure 5
ACAID in NK and NKT cell–depleted mice. (A) Flow cytometry confirmation of NK cell depletion. Data in the dot plots confirm the presence (control) and absence of NK cells (RαAsGM1 treatment). B6 mice were inoculated intravenously with RαAsGM1 Ab or purified rabbit IgG. Column-enriched splenic T cells (includes NK and NKT cells) were harvested 24 h later and stained with CyChrome 5–conjugated anti–TCR β chain and PE-streptavidin-biotin–conjugated anti-NK1.1 mAbs, and analyzed by flow cytometry. The cell population that is analyzed is indicated above the block, and the percentage of NKT cells and NK cells is indicated by the square and rectangle, respectively, within the dot plot shown. (B) Flow cytometry confirmation that mixed antibody treatment removed NKT as well as NK cells. B6 mice were inoculated with mouse IgG, anti-NK1.1 mAb, or a mixture of anti-NK1.1 and anti-Ly49C mAbs. Column-enriched splenic T cells harvested 24 h later were stained by CyChrome 5–conjugated TCR β chain mAb and FITC-conjugated goat anti–rabbit and RαAsGM1, and assessed by flow cytometry. (C) LAT assay for role of NK cells in generation of T-regulatory cell in ACAID. Mice (five per group) were inoculated (ac) with OVA 24 h after treatment with purified rabbit IgG, or RαAsGM1 Ab. 7 d later, column-enriched splenic T cells were harvested from the ac-inoculated mice (regulator), and cotransferred with effector and stimulator cells (from B6 mice) into ear pinnae of five syngeneic naive mice. Ear swelling measurements (24 h after ear challenge) are shown on the ordinate. The phenotype of the cell mixtures that were injected into the ear pinnae is indicated below the abscissa for each bar. Significant differences (P ≤ 0.05) are indicated by an asterisk. (D) LAT assay to test the role of NKT cells in generation of T-regulatory cells. Each of five mice was treated with mouse IgG, anti-NK1.1 mAb, or a mixture of anti-NK1.1 and anti-Ly49C mAb treatment 1 d before inoculation (ac) with OVA. 7 d later, column-enriched splenic T cells were harvested from the ac-inoculated mice (regulator), and cotransferred with effector and stimulator cells (from B6 mice) into ear pinnae of five syngeneic naive mice. Ear swelling measurements (24 h after ear challenge) are shown on the ordinate, and the phenotype of the cell mixture inoculated into the ears is indicated below the abscissa for each group (five per group) indicated by the bar. Significant differences (P ≤ 0.05) are indicated by an asterisk.
Figure 5
Figure 5
ACAID in NK and NKT cell–depleted mice. (A) Flow cytometry confirmation of NK cell depletion. Data in the dot plots confirm the presence (control) and absence of NK cells (RαAsGM1 treatment). B6 mice were inoculated intravenously with RαAsGM1 Ab or purified rabbit IgG. Column-enriched splenic T cells (includes NK and NKT cells) were harvested 24 h later and stained with CyChrome 5–conjugated anti–TCR β chain and PE-streptavidin-biotin–conjugated anti-NK1.1 mAbs, and analyzed by flow cytometry. The cell population that is analyzed is indicated above the block, and the percentage of NKT cells and NK cells is indicated by the square and rectangle, respectively, within the dot plot shown. (B) Flow cytometry confirmation that mixed antibody treatment removed NKT as well as NK cells. B6 mice were inoculated with mouse IgG, anti-NK1.1 mAb, or a mixture of anti-NK1.1 and anti-Ly49C mAbs. Column-enriched splenic T cells harvested 24 h later were stained by CyChrome 5–conjugated TCR β chain mAb and FITC-conjugated goat anti–rabbit and RαAsGM1, and assessed by flow cytometry. (C) LAT assay for role of NK cells in generation of T-regulatory cell in ACAID. Mice (five per group) were inoculated (ac) with OVA 24 h after treatment with purified rabbit IgG, or RαAsGM1 Ab. 7 d later, column-enriched splenic T cells were harvested from the ac-inoculated mice (regulator), and cotransferred with effector and stimulator cells (from B6 mice) into ear pinnae of five syngeneic naive mice. Ear swelling measurements (24 h after ear challenge) are shown on the ordinate. The phenotype of the cell mixtures that were injected into the ear pinnae is indicated below the abscissa for each bar. Significant differences (P ≤ 0.05) are indicated by an asterisk. (D) LAT assay to test the role of NKT cells in generation of T-regulatory cells. Each of five mice was treated with mouse IgG, anti-NK1.1 mAb, or a mixture of anti-NK1.1 and anti-Ly49C mAb treatment 1 d before inoculation (ac) with OVA. 7 d later, column-enriched splenic T cells were harvested from the ac-inoculated mice (regulator), and cotransferred with effector and stimulator cells (from B6 mice) into ear pinnae of five syngeneic naive mice. Ear swelling measurements (24 h after ear challenge) are shown on the ordinate, and the phenotype of the cell mixture inoculated into the ears is indicated below the abscissa for each group (five per group) indicated by the bar. Significant differences (P ≤ 0.05) are indicated by an asterisk.
Figure 6
Figure 6
In vivo blocking of NKT cell–CD1 interaction abrogated the ACAID. Five B6 mice were inoculated intravenously with rat IgM or anti-CD1 (3C11) Abs 1 d before ac inoculation with OVA. 7 d later, column-enriched splenic T cells harvested from ac-inoculated mice (regulator) were cotransferred with effector and stimulator cells into the ear pinnae of naive syngeneic mice (five per group). Ear swelling measurements from B6 mice (24 h after ear challenge) are shown on the ordinate, and cell mixture inoculated is indicated below each bar on the abscissa. Significant differences (P ≤ 0.05) are indicated by an asterisk.
Figure 7
Figure 7
Comparison of ACAID versus intravenously-induced tolerance in CD1 KO mice. CD1 KO mice and control WT mice (five mice per group) were inoculated ac or intravenously with OVA 7 d before subcutaneous sensitization with OVA and CFA. OVA-inoculated mice were challenged in their ear pinnae with OVA-pulsed PECs from F1 mice 7 d after sensitization. Ear swelling measurements (24 h after ear challenge) are shown on the ordinate, and treatment of mice is indicated below the abscissa for each group (five per group) indicated by the bar. Significant differences (P ≤ 0.05) are indicated by an asterisk.

Comment in

References

    1. Streilein J.W. Immune privilege as the result of local tissue barriers and immunosuppressive microenvironments. Curr. Opin. Immunol. 1993;5:428–432. - PubMed
    1. Griffith T.S., Brunner T., Fletcher S.M., Green D.R., Ferguson T.A. Fas ligand-induced apoptosis as a mechanism of immune privilege. Science. 1995;270:1189–1192. - PubMed
    1. Taylor A.W., Streilein J.W., Cousins S.W. Identification of alpha-melanocyte stimulating hormone as a potential immunosuppressive factor in aqueous humor. Curr. Eye. Res. 1992;11:1199–1206. - PubMed
    1. Taylor A.W., Streilein J.W., Cousins S.W. Immunoreactive vasoactive intestinal peptide contributes to the immunosuppressive activity of normal aqueous humor. J. Immunol. 1994;153:1080–1086. - PubMed
    1. Streilein J.W., Bradley D. Analysis of immunosuppressive properties of iris and ciliary body cells and their secretory products. Invest. Ophthalmol. Vis. Sci. 1991;32:2700–2710. - PubMed

Publication types