. 1999 Nov 1;190(9):1263-74.
doi: 10.1084/jem.190.9.1263.

Inhibition of interleukin 2 signaling and signal transducer and activator of transcription (STAT)5 activation during T cell receptor-mediated feedback inhibition of T cell expansion

Affiliations

Inhibition of interleukin 2 signaling and signal transducer and activator of transcription (STAT)5 activation during T cell receptor-mediated feedback inhibition of T cell expansion

I H Lee et al. J Exp Med. .

Abstract

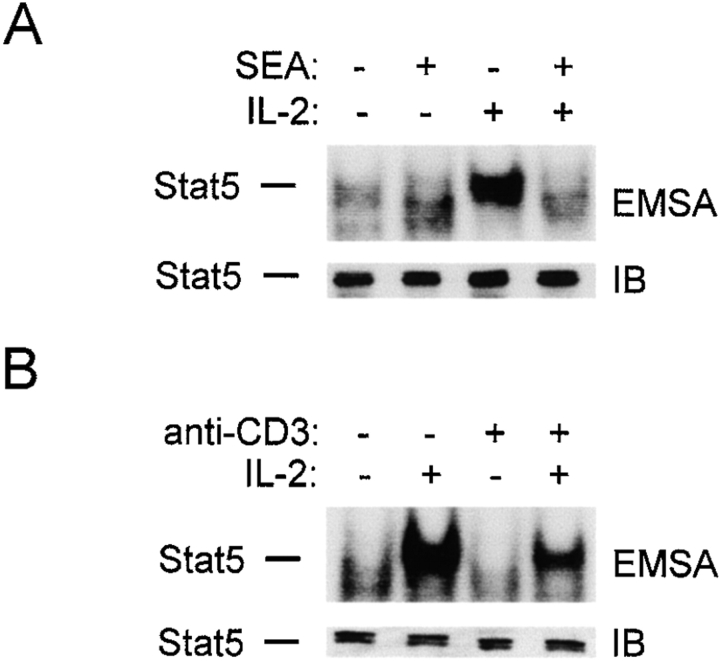
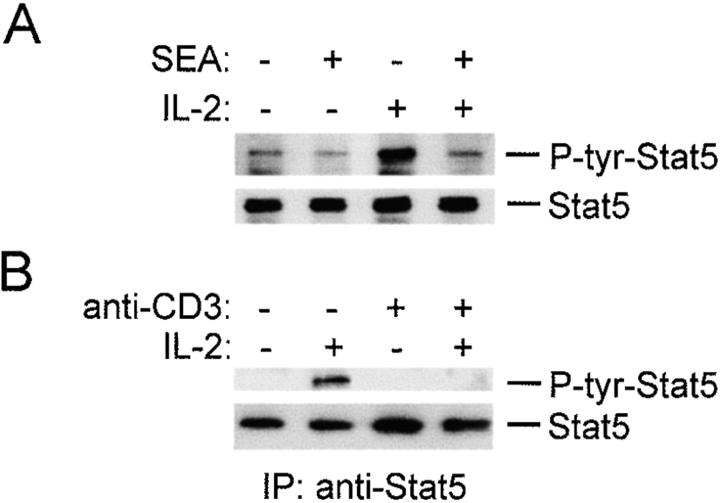
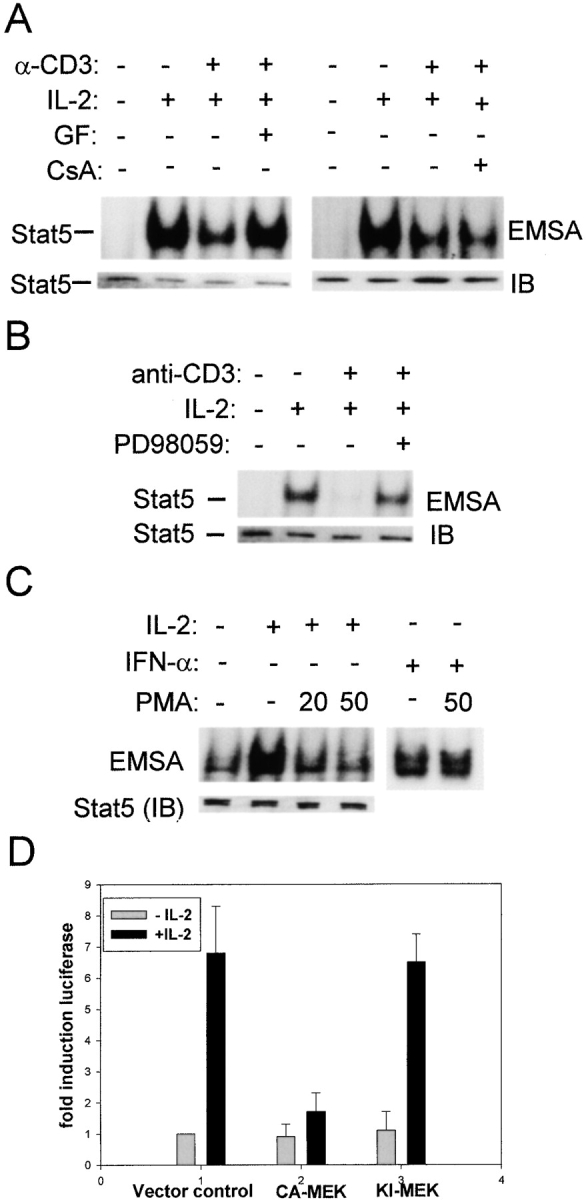
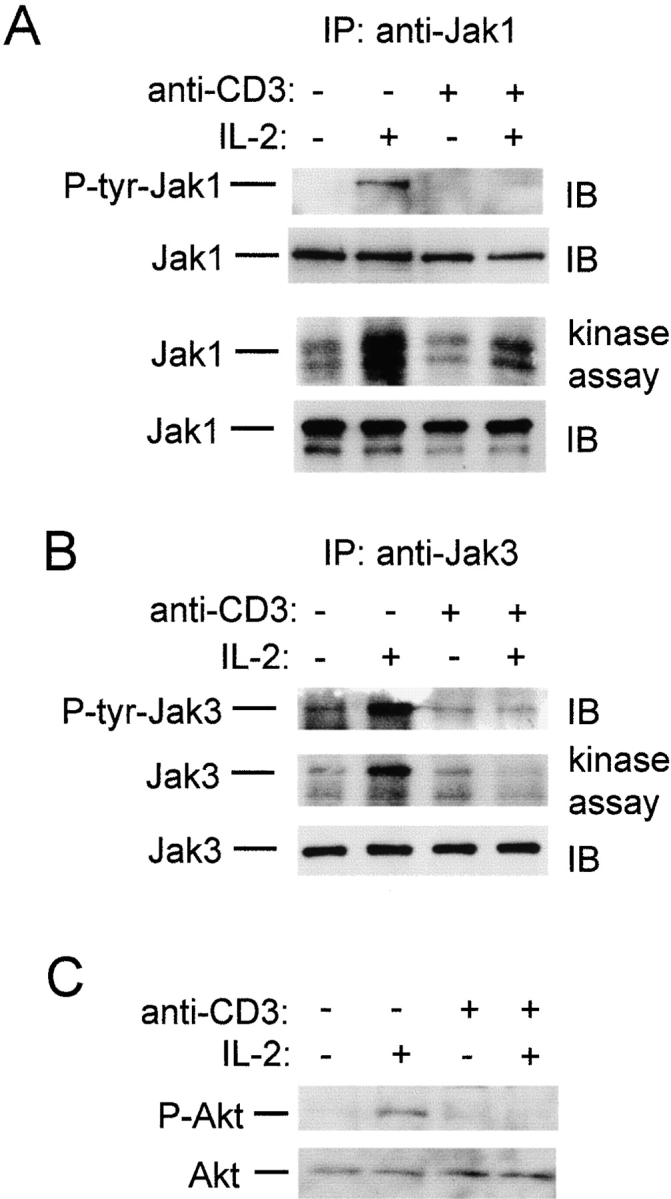
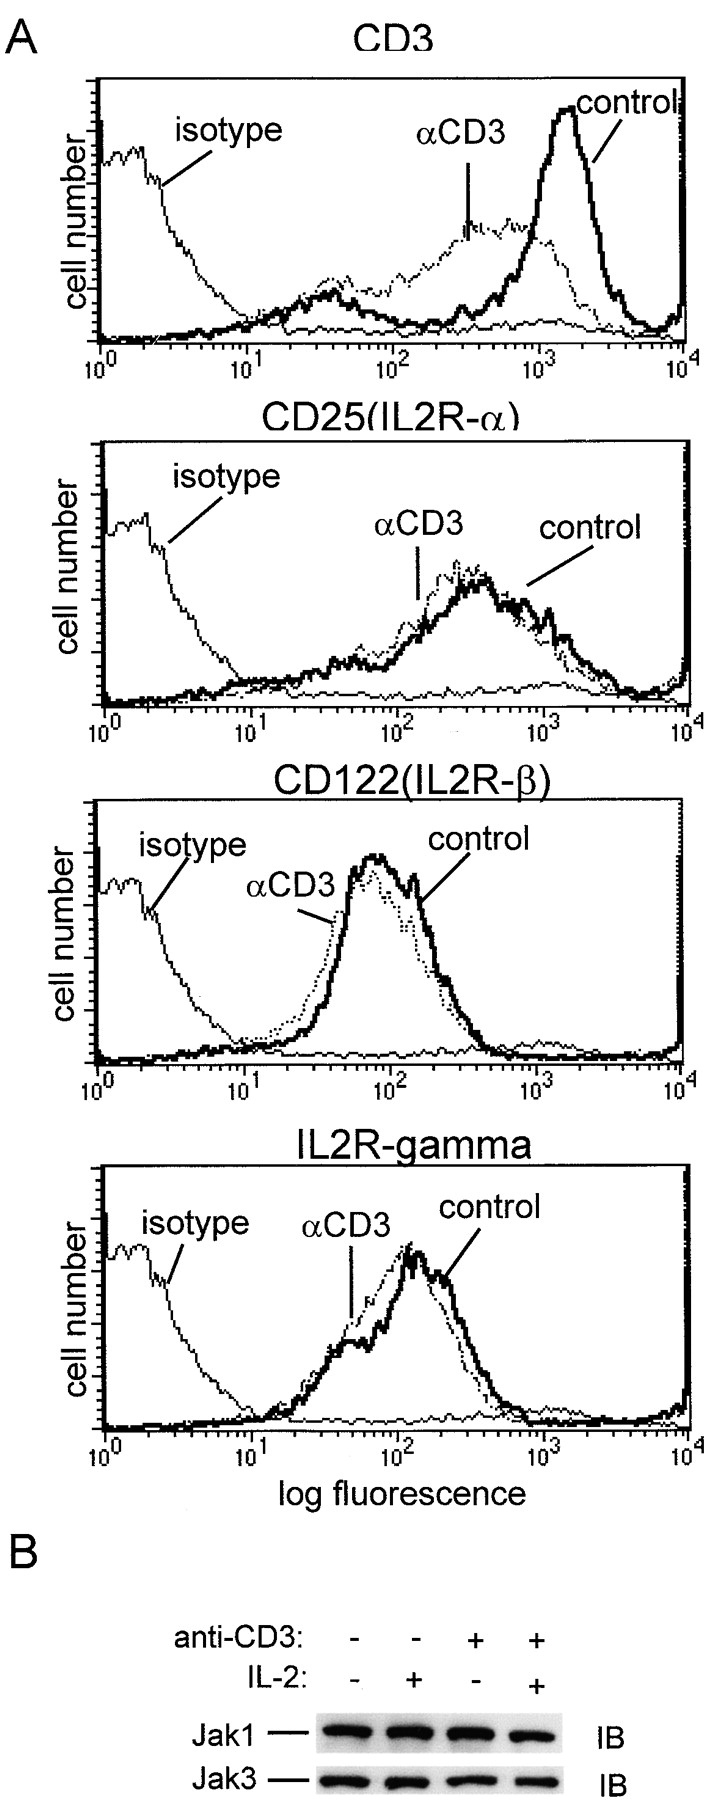
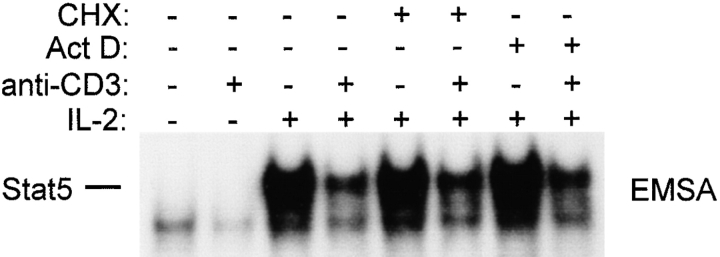
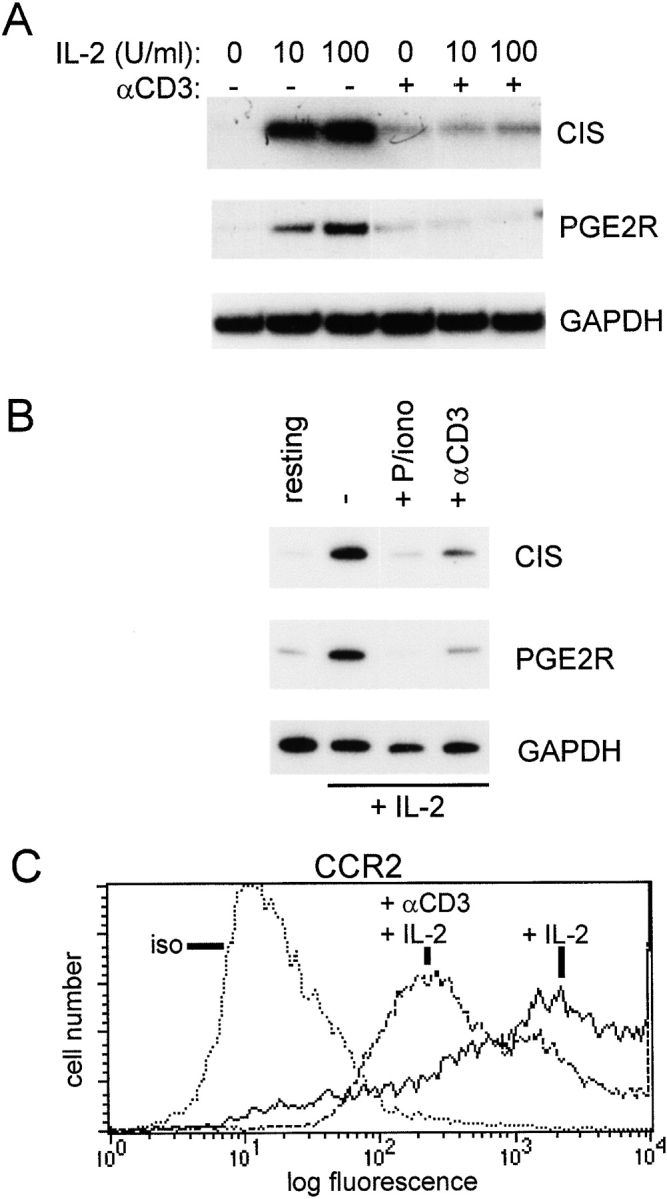
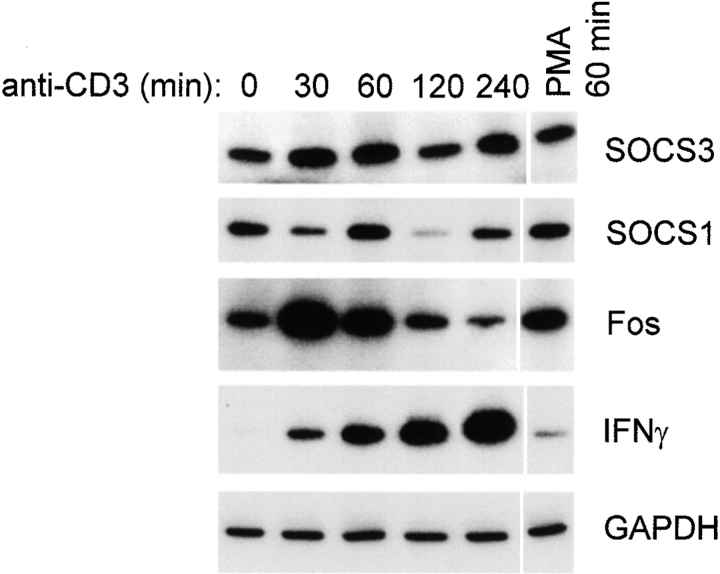
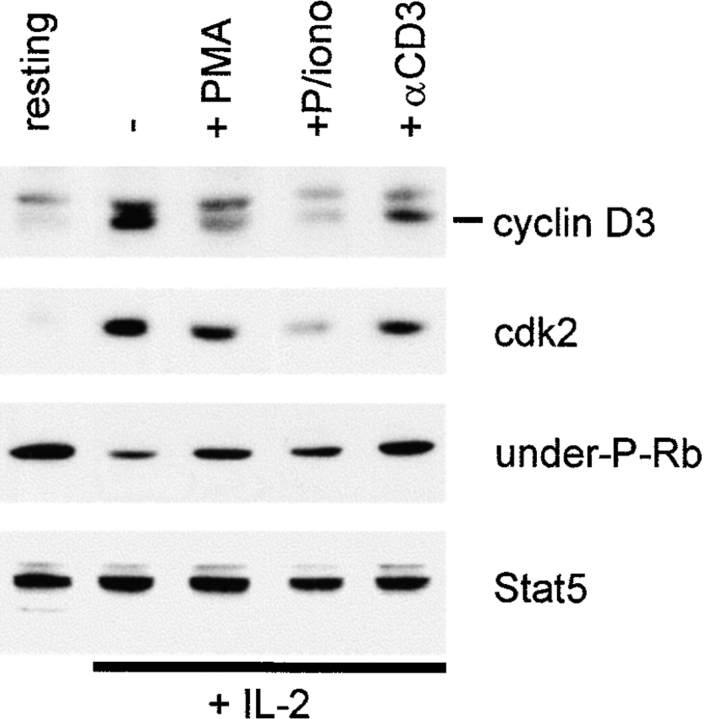
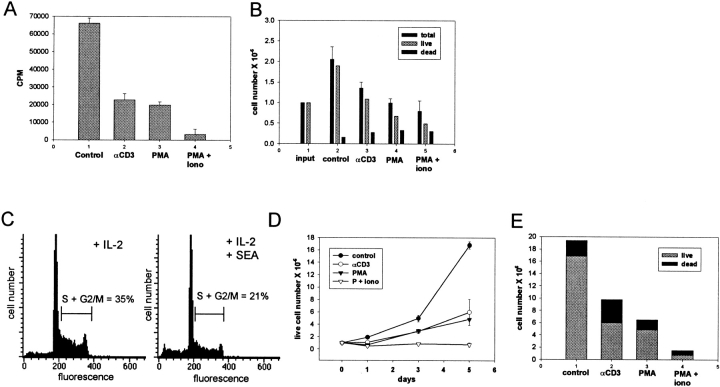
Limitation of clonal expansion of activated T cells is necessary for immune homeostasis, and is achieved by growth arrest and apoptosis. Growth arrest and apoptosis can occur passively secondary to cytokine withdrawal, or can be actively induced by religation of the T cell receptor (TCR) in previously activated proliferating T cells. TCR-induced apoptosis appears to require prior growth arrest, and is mediated by death receptors such as Fas. We tested whether TCR religation affects T cell responses to interleukin (IL)-2, a major T cell growth and survival factor. TCR ligation in activated primary human T cells blocked IL-2 induction of signal transducer and activator of transcription (STAT)5 DNA binding, phosphorylation of STAT5, Janus kinase (Jak)1, Jak3, and Akt, and kinase activity of Jak1 and Jak3. Inhibition was mediated by the mitogen-activated protein kinase kinase (MEK)-extracellular stimulus-regulated kinase (ERK) signaling pathway, similar to the mechanism of inhibition of IL-6 signaling we have described previously. TCR ligation blocked IL-2 activation of genes and cell cycle regulatory proteins, and suppressed cell proliferation and expansion. These results identify TCR-induced inhibition of IL-2 signaling as a novel mechanism that underlies antigen-mediated feedback limitation of T cell expansion, and suggest that modulation of cytokine activity by antigen receptor signals plays an important role in the regulation of lymphocyte function.


Figures

Figure 1
Figure 1
TCR ligation blocks IL-2 activation of STAT5 DNA binding. Preactivated T cells (>90% CD3+) were added to wells containing purified monocytes, and SEA (2 μg/ml) was added (A); or to wells coated with isotype-matched control or anti-CD3 antibodies (B), for 1 h, followed by a 10-min stimulation with IL-2 (100 U/ml). Cell extracts were analyzed using EMSA with the IRF oligonucleotide and immunoblotting (IB) as described previously (reference 33).
Figure 2
Figure 2
TCR ligation blocks STAT5 tyrosine phosphorylation. After 1 h exposure to SEA (2 μg/ml; A) or plate-bound control or anti-CD3 antibodies (B), T cells were stimulated for 10 min with IL-2 (100 U/ml) and cell extracts were prepared. Cell extracts were analyzed by immunoblotting with antiphosphotyrosine (P-tyr)–STAT5 antibodies (A), or STAT5 immunoprecipitates were blotted with 4G10 antiphosphotyrosine antibodies (B). Filters were stripped and reprobed with anti-STAT5 antibodies.
Figure 5
Figure 5
TCR inhibition of IL-2 signaling is mediated by the MEK-ERK signaling pathway. (A and B) Preactivated T cells were treated for 30 min with 1 μM GF109203X (GF), 0.5 μg/ml cyclosporin A (CsA), or 50 μM PD98059, followed by TCR ligation for 1 h and IL-2 (100 U/ml) stimulation for 10 min. (C) Cells were treated with PMA (20 or 50 ng/ml) for 15 min before a 10-min stimulation with IL-2 (100 U/ml) or IFN-γ (100 U/ml). (D) Kit225 cells were cotransfected in duplicate with 5× GRR GAS-luciferase, a β-galactosidase encoding plasmid, and either a control empty vector, or, as indicated, the same vector containing a constitutively active (CA) or kinase inactive (KI) MEK1 cDNA. Cells were split and stimulated with IL-2 (100 U/ml) for 6 h. Luciferase activity was normalized according to β-galactosidase activity, and a representative experiment out of five performed is shown.
Figure 3
Figure 3
TCR ligation blocks activation of Jak1, Jak3, and Akt. Preactivated T cells were subjected to TCR ligation for 1 h, followed by a 10-min stimulation with IL-2 (100 U/ml). (A) Jak1 immunoprecipitates (IP) were analyzed using immunoblotting (IB) with 4G10 (top panel), and the same filter was reprobed with anti-Jak1 antibodies (second panel). Alternatively, Jak1 immunoprecipitates were used in in vitro kinase assays (75% of each immunoprecipitate, third panel) and analyzed using immunoblotting (25% of each immunoprecipitate, bottom panel). (B) Jak3 immunoprecipitates were obtained, 75% of each immunoprecipitate was used in in vitro kinase assays (middle panel), and 25% of each immunoprecipitate was analyzed using immunoblotting with 4G10 and Jak3 antibodies (top and bottom panels). (C) Cell extracts were analyzed by immunoblotting with antibodies specific for serine 473–phosphorylated Akt (upper panel) and against Akt (lower panel).
Figure 4
Figure 4
TCR ligation does not affect IL-2R, Jak1, or Jak3 expression. Preactivated T cells were subjected to TCR ligation for 1 h and analyzed by flow cytometry (A), or cell extracts were analyzed by immunoblotting (IB; B).
Figure 6
Figure 6
Inhibition of IL-2 signaling after TCR ligation does not require new RNA or protein synthesis. Preactivated T cells were preincubated for 30 min with cycloheximide (CHX, 40 μg/ml) or actinomycin D (Act D, 5 μg/ml), then subjected to TCR ligation for 1 h followed by 10 min of stimulation with IL-2.
Figure 8
Figure 8
TCR inhibition of IL-2–induced gene expression. (A) Preactivated T cells were subjected to TCR ligation for 1 h followed by 1 h of stimulation with IL-2, and mRNA levels were determined using semiquantitative RT-PCR, as described previously (reference 33). (B) T cells activated with OKT3 for 3 d were cultured for an additional 2 d in IL-2 (100 U/ml), and then added to wells containing control or anti-CD3 antibodies for 5 h. resting, cells not exposed to IL-2. P/iono, PMA and ionomycin. (C) Cell surface CCR2 expression after 24 h of TCR ligation was determined using flow cytometry. iso, isotype control.
Figure 7
Figure 7
Regulation of SOCS mRNA levels after TCR ligation. Preactivated T cells were added to wells containing anti-CD3 antibodies, and cells were harvested at the indicated time points. mRNA levels were determined using semiquantitative RT-PCR, as described previously (reference 33).
Figure 9
Figure 9
TCR regulation of cell cycle regulatory proteins. T cells activated with OKT3 for 3 d were cultured for an additional 2 d in IL-2 (100 U/ml), and then added to wells containing control or anti-CD3 antibodies. Cell extracts were prepared after 5 h of TCR ligation or PMA and ionomycin (P/iono) treatment, and analyzed using immunoblotting. The same filter was sequentially probed with the indicated antibodies. under-P-Rb, underphosphorylated Rb.
Figure 10
Figure 10
Inhibition of IL-2–dependent T cell expansion by TCR ligation. T cells activated with OKT3 or SEA for 3 d and cultured in IL-2 for 2 d to obtain rapidly proliferating cells were used. (A) [3H]Thymidine incorporation. [3H]Thymidine was added to triplicate wells 2 h after cells were plated, and cells were harvested and [3H]thymidine incorporation measured after an additional 4 h. A representative experiment out of four performed is shown. (B) Cell counts from duplicate wells were obtained 24 h after cells were plated. Cell viability was determined using trypan blue and propidium iodide exclusion. A representative experiment out of five performed is shown. (C) Cell cycle analysis was performed on T cells 24 h after addition of APCs and SEA, as described previously (reference 33). (D and E) Cell counts were obtained 3 and 5 d after cells were plated. D shows viable cell numbers, and E shows relative proportions of live and dead cells on the fifth day of culture. A representative experiment out of three performed is shown.

References

    1. Kotzin B.L., Leung D.Y., Kappler J., Marrack P. Superantigens and their potential role in human disease. Adv. Immunol. 1993;54:99–166. - PubMed
    1. Oxenius A., Zinkernagel R.M., Hengartner H. Comparison of activation versus induction of unresponsiveness of virus-specific CD4+ and CD8+ T cells upon acute versus persistent viral infection. Immunity. 1998;9:449–457. - PubMed
    1. Van Parijs L., Abbas A.K. Homeostasis and self-tolerance in the immune systemturning lymphocytes off. Science. 1998;280:243–248. - PubMed
    1. Kuroda K., Yagi J., Imanishi K., Yan X.J., Li X.Y., Fujimaki W., Kato H., Miyoshi-Akiyama T., Kumazawa Y., Abe H., Uchiyama T. Implantation of IL-2-containing osmotic pump prolongs the survival of superantigen-reactive T cells expanded in mice injected with bacterial superantigen. J. Immunol. 1996;157:1422–1431. - PubMed
    1. Vella A.T., Dow S., Potter T.A., Kappler J., Marrack P. Cytokine-induced survival of activated T cells in vitro and in vivo. Proc. Natl. Acad. Sci. USA. 1998;95:3810–3815. - PMC - PubMed

Publication types

MeSH terms