. 1999 Nov 1;190(9):1329-42.
doi: 10.1084/jem.190.9.1329.

Antigen receptor-induced activation and cytoskeletal rearrangement are impaired in Wiskott-Aldrich syndrome protein-deficient lymphocytes

Affiliations

Antigen receptor-induced activation and cytoskeletal rearrangement are impaired in Wiskott-Aldrich syndrome protein-deficient lymphocytes

J Zhang et al. J Exp Med. .

Abstract

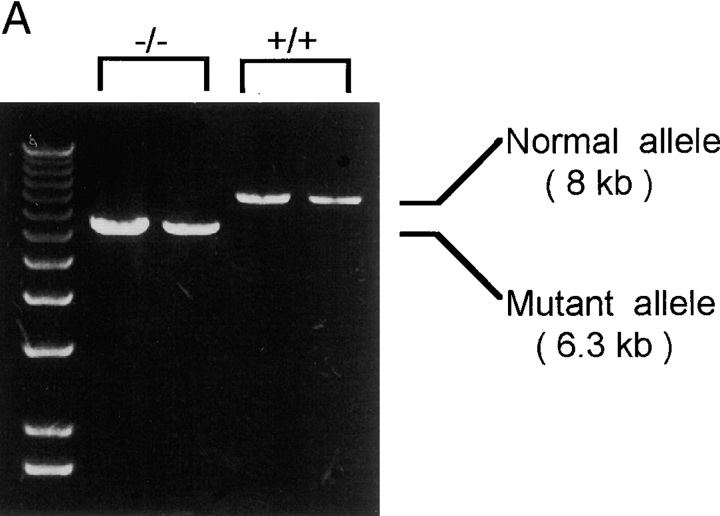
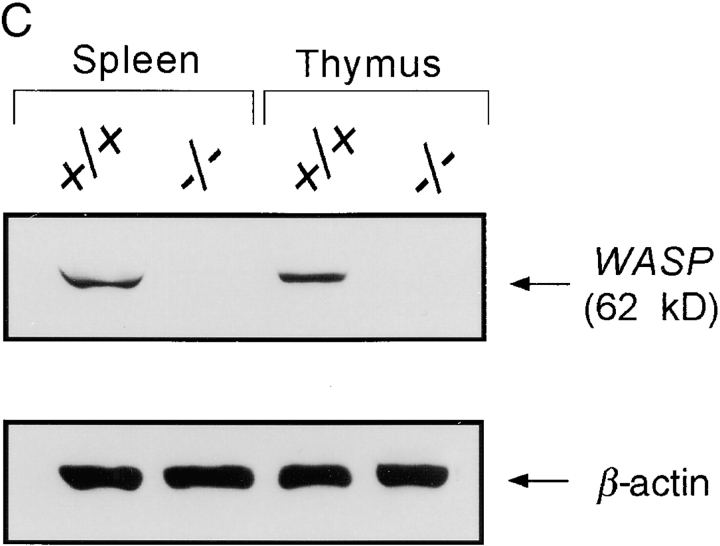
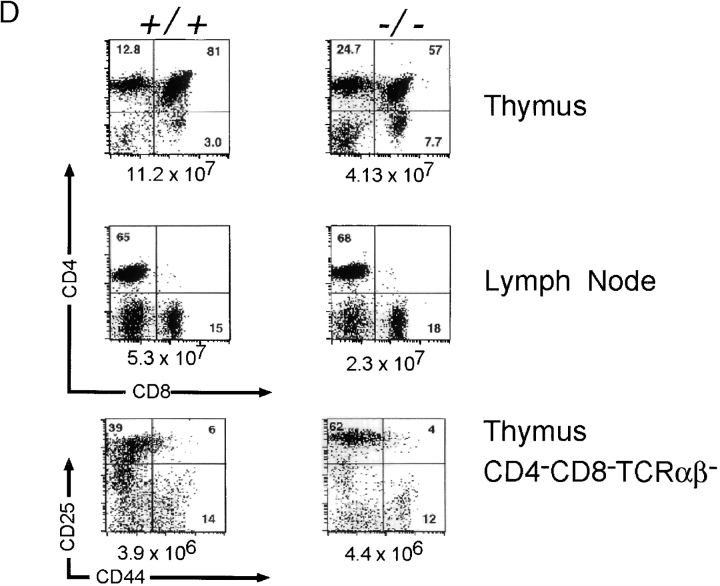
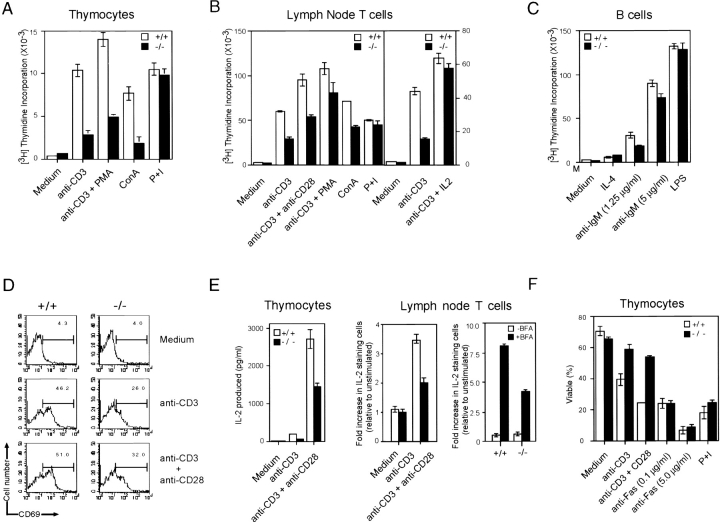
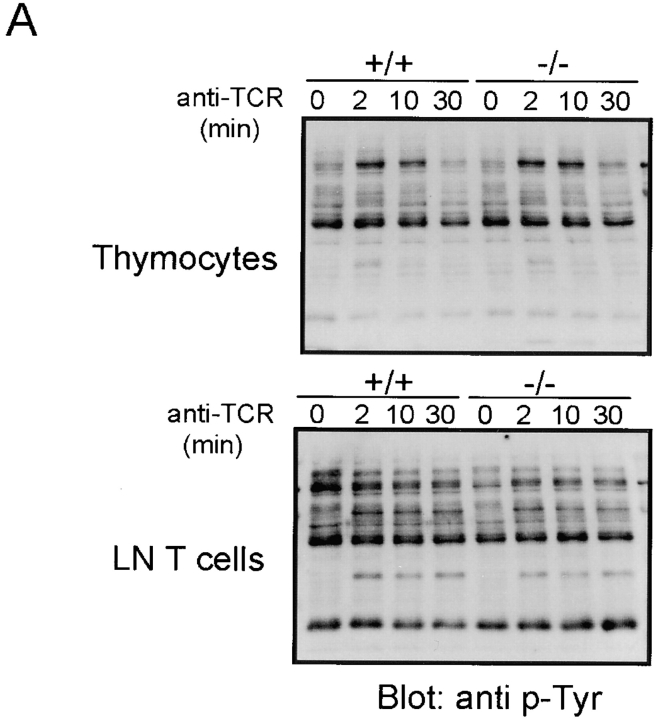
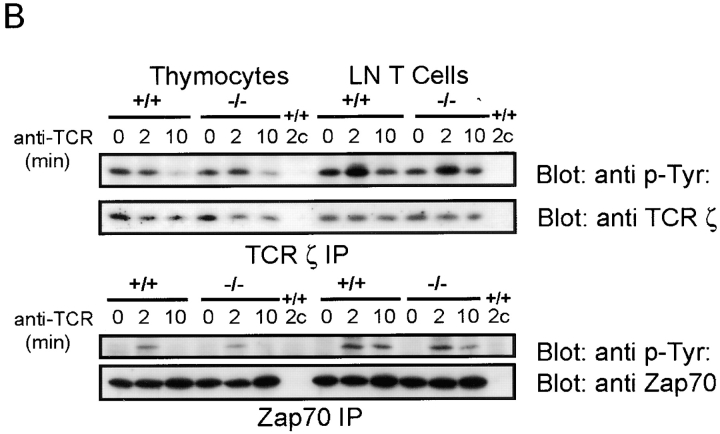
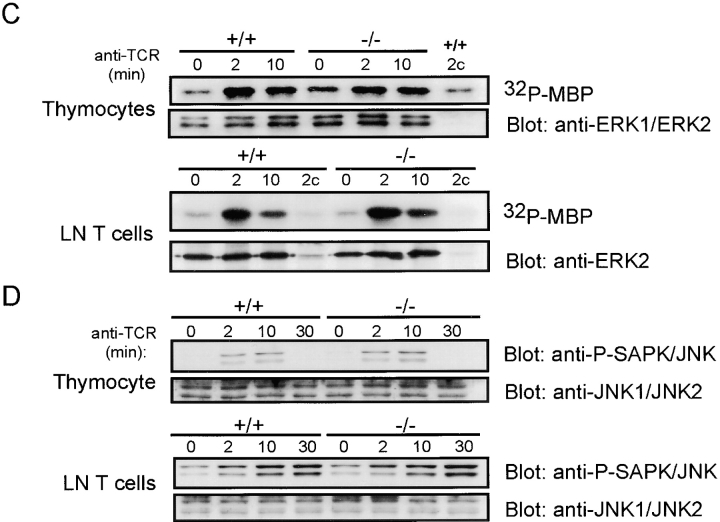
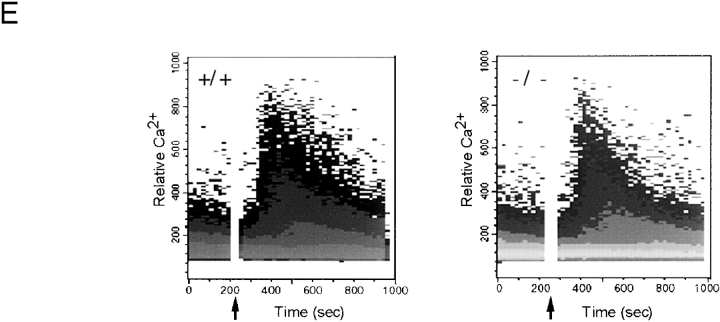
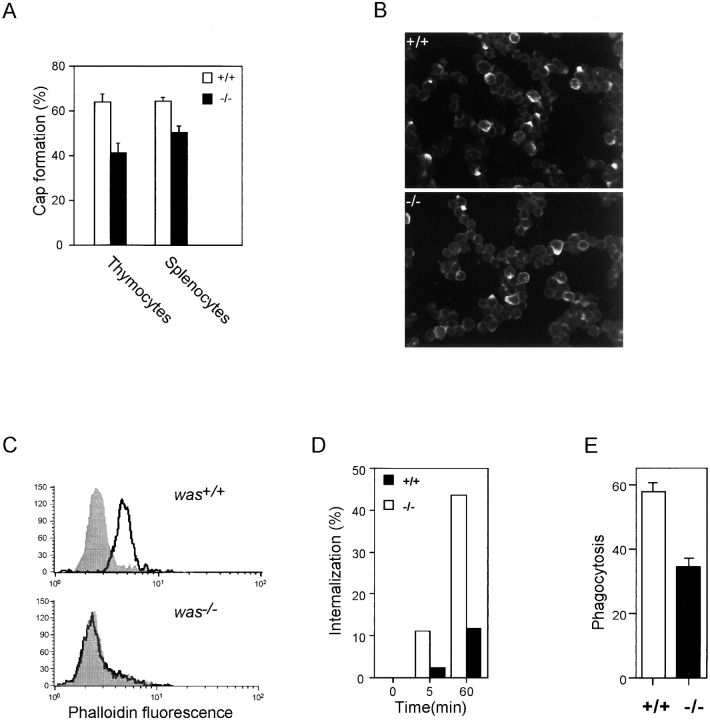
The Wiskott-Aldrich syndrome protein (WASp) has been implicated in modulation of lymphocyte activation and cytoskeletal reorganization. To address the mechanisms whereby WASp subserves such functions, we have examined WASp roles in lymphocyte development and activation using mice carrying a WAS null allele (WAS(-)(/)(-)). Enumeration of hemopoietic cells in these animals revealed total numbers of thymocytes, peripheral B and T lymphocytes, and platelets to be significantly diminished relative to wild-type mice. In the thymus, this abnormality was associated with impaired progression from the CD44(-)CD25(+) to the CD44(-)CD25(-) stage of differentiation. WASp-deficient thymocytes and T cells also exhibited impaired proliferation and interleukin (IL)-2 production in response to T cell antigen receptor (TCR) stimulation, but proliferated normally in response to phorbol ester/ionomycin. This defect in TCR signaling was associated with a reduction in TCR-evoked upregulation of the early activation marker CD69 and in TCR-triggered apoptosis. While induction of TCR-zeta, ZAP70, and total protein tyrosine phosphorylation as well as mitogen-activated protein kinase (MAPK) and stress-activated protein/c-Jun NH(2)-terminal kinase (SAPK/JNK) activation appeared normal in TCR-stimulated WAS(-)(/)(-) cells, TCR-evoked increases in intracellular calcium concentration were decreased in WASp-deficient relative to wild-type cells. WAS(-)(/)(-) lymphocytes also manifested a marked reduction in actin polymerization and both antigen receptor capping and endocytosis after TCR stimulation, whereas WAS(-)(/)(-) neutrophils exhibited reduced phagocytic activity. Together, these results provide evidence of roles for WASp in driving lymphocyte development, as well as in the translation of antigen receptor stimulation to proliferative or apoptotic responses, cytokine production, and cytoskeletal rearrangement. The data also reveal a role for WASp in modulating endocytosis and phagocytosis and, accordingly, suggest that the immune deficit conferred by WASp deficiency reflects the disruption of a broad range of cellular behaviors.


Figures

Figure 1
Figure 1
Characterization of WAS genotypes and thymocyte populations in WAS / mice. (A) Long-range PCR genotyping used in screening the ES clones. The wild-type (+/+) allele appears as an 8-kb fragment, and the mutant (−/−) allele appears as a 6.3-kb fragment. A molecular mass standard (1-kb ladder) is shown on the left. (B) Southern blot analysis for detection of targeted clones. BamHI-digested DNA from the respective clones was electrophoresed through 0.8% agarose, transferred to nitrocellulose, and the filters were hybridized with a 450-bp segment from the 5′ flanking region of the WAS gene. The 10.5-kb fragment represents hybridization to homologously targeted alleles, and the 6.5-kb band represents hybridization to the wild-type allele. (C) Spleen and thymus from WAS / mice are null for the expression of WASp. Splenocyte and thymocyte lysates from control (+/+) and WAS / mice were analyzed by Western blotting as described in Materials and Methods. The blot was probed with an anti-WASp polyclonal antibody (top panel). Equal loading was assessed by reprobing the blot with an anti–β-actin antibody (bottom panel). (D) Immunofluorescence analysis of T and B cell development in WAS / mice. Thymocytes and lymph node T cells from 4–8-wk-old WAS / and age-matched control (+/+) mice were assayed for CD4 and CD8 expression (top and middle panels) or expression of CD25 and CD44 (bottom panel). To analyze the early stages of thymic development, four-color staining of thymocytes was carried out by staining the cells with a cocktail containing allophycocyanin-labeled anti-CD3, anti-CD4, anti-CD8, anti–TCR-α/β, and anti-B220 antibodies, and subsequently with FITC-Ly9.1, biotinylated anti-CD25 (detected with Texas red–conjugated streptavidin), and PE-labeled anti-CD44. Fluorescence signals were evaluated using Becton Dickson FACScan™ and CELLQuest™ software and were gated to display CD25 versus CD44 on Ly-9.1+ (ES-derived) CD4, CD8, CD3 triple-negative cells (bottom panel). Numbers in the quadrants indicate percentages of different cell populations, while numbers below each panel indicate total number of thymic cells. Data shown are representative of four independent experiments.
Figure 1
Figure 1
Characterization of WAS genotypes and thymocyte populations in WAS / mice. (A) Long-range PCR genotyping used in screening the ES clones. The wild-type (+/+) allele appears as an 8-kb fragment, and the mutant (−/−) allele appears as a 6.3-kb fragment. A molecular mass standard (1-kb ladder) is shown on the left. (B) Southern blot analysis for detection of targeted clones. BamHI-digested DNA from the respective clones was electrophoresed through 0.8% agarose, transferred to nitrocellulose, and the filters were hybridized with a 450-bp segment from the 5′ flanking region of the WAS gene. The 10.5-kb fragment represents hybridization to homologously targeted alleles, and the 6.5-kb band represents hybridization to the wild-type allele. (C) Spleen and thymus from WAS / mice are null for the expression of WASp. Splenocyte and thymocyte lysates from control (+/+) and WAS / mice were analyzed by Western blotting as described in Materials and Methods. The blot was probed with an anti-WASp polyclonal antibody (top panel). Equal loading was assessed by reprobing the blot with an anti–β-actin antibody (bottom panel). (D) Immunofluorescence analysis of T and B cell development in WAS / mice. Thymocytes and lymph node T cells from 4–8-wk-old WAS / and age-matched control (+/+) mice were assayed for CD4 and CD8 expression (top and middle panels) or expression of CD25 and CD44 (bottom panel). To analyze the early stages of thymic development, four-color staining of thymocytes was carried out by staining the cells with a cocktail containing allophycocyanin-labeled anti-CD3, anti-CD4, anti-CD8, anti–TCR-α/β, and anti-B220 antibodies, and subsequently with FITC-Ly9.1, biotinylated anti-CD25 (detected with Texas red–conjugated streptavidin), and PE-labeled anti-CD44. Fluorescence signals were evaluated using Becton Dickson FACScan™ and CELLQuest™ software and were gated to display CD25 versus CD44 on Ly-9.1+ (ES-derived) CD4, CD8, CD3 triple-negative cells (bottom panel). Numbers in the quadrants indicate percentages of different cell populations, while numbers below each panel indicate total number of thymic cells. Data shown are representative of four independent experiments.
Figure 2
Figure 2
Effects of WASp deficiency on antigen receptor–evoked proliferation, IL-2 production, and apoptosis. (A) Freshly isolated T and B lymphocytes from the thymi (A), lymph nodes (B), and spleens (C) of 4–8-wk-old WAS / mice (−/−) or age-matched control mice (+/+) were cultured for 48 h with the following stimuli. For thymocytes: anti-CD3 antibody (2 μg/ml), anti-CD3 antibody plus PMA (5 ng/ml), Con A (1 μg/ml), or PMA and ionomycin (P+I, 250 ng/ml); for lymph node T cells: anti-CD3 antibody (1 μg/ml), anti-CD3 antibody plus anti-CD28 antibody (0.2 μg/ml), anti-CD3 antibody plus PMA (5 ng/ml), Con A (1 μg/ml), PMA and ionomycin (P+I, 250 ng/ml), or anti-CD3 antibody plus 50 U/ml IL-2; for splenic cells: IL-4 (2 ng/ml), anti-IgM (1.25 or 5 μg/ml), or LPS (5 μg/ml). Proliferative responses were determined after a 16-h pulse with [3H]thymidine. Values represent means (±SEM) of triplicate cultures and are representative of one of four independent experiments. (D) Flow cytometric analysis of the expression of the early activation marker CD69 upon treatment of thymocytes with either medium alone (top), anti-CD3 antibody (middle), or anti-CD3 plus anti-CD28 antibodies (bottom). (E) IL-2 production by WAS / and WAS +/+ thymocytes stimulated for 48 h with anti-CD3 antibody (2 μg/ml) or anti-CD3 plus anti-CD28 antibody (2 and 0.2 μg/ml, respectively) was evaluated by ELISA of culture supernatants (left panel). Alternatively, lymph node T cells were cultured for 8 h with medium alone or with anti-CD3 (5 μg/ml) or anti-CD3/anti-CD28 (5 μg/ml/4 μg/ml) antibodies, stained with FITC-conjugated anti-CD4 antibody followed by permeabilization and staining with PE-conjugated anti–IL-2 antibody, and analyzed by flow cytometry (middle panel). Results are expressed as the fold increase in numbers of IL-2–stained CD4+ cells in stimulated relative to unstimulated wild-type cells and represent means (±SEM) of triplicate cultures. Intracellular staining of WAS / and WAS +/+ lymph node cells stimulated with anti-CD3/anti-CD28 in the presence or absence of Brefeldin A was also evaluated as above (right panel). Values represent means (±SEM) of triplicate cultures. (F) Thymocytes from WAS / and control WAS +/+ mice were activated by incubation with either medium alone or with plate-bound anti-CD3 antibody (20 μg/well), anti-CD3 plus anti-CD28 antibodies (each 20 μg/well), anti-Fas (0.1 or 5 μg/ml) antibody, or with PMA plus ionomycin (P+I, 10 and 500 ng/ml, respectively) for 24 h, after which the cells were stained with 7-AAD (10 μg/ml) and with FITC-conjugated anti-CD4 and PE-conjugated anti-CD8 and analyzed by flow cytometry. Histograms indicate the percentage of viable CD4+CD8+ cells. Values represent means (±SEM) of triplicate cultures and are representative of four independent experiments.
Figure 3
Figure 3
Effects of WASp deficiency on TCR signaling. WAS / or WAS +/+ thymocytes or lymph node T cells were stimulated with biotinylated anti-TCR antibody (10 μg/ml) followed by streptavidin cross-linking (10 μg/ml) for the indicated times. Lysates were prepared as in Materials and Methods, and the lysate proteins were either (A) resolved over SDS-PAGE and subjected to antiphosphotyrosine immunoblotting analysis; (B) subjected to immunoprecipitation with anti–TCR-ζ (top panel) or anti-ZAP70 (bottom panel) antibodies as well as control rabbit IgG(c) and subsequent sequential immunoblotting with antiphosphotyrosine (anti p-Tyr) and anti–TCR-ζ or anti-ZAP70 antibodies, respectively; (C) immunoprecipitated with anti-ERK1 and anti-ERK2 antibodies as well as control IgG(c), and the immune complexes were evaluated for ability to phosphorylate MBP by SDS-PAGE and autoradiography (upper panel) and for amount of ERK1 and ERK2 by immunoblotting analysis (lower panel); or (D) resolved over SDS-PAGE and subjected to sequential immunoblotting analysis with antiphospho-SAPK/JNK (pSAPK/JNK) and anti-SAPK/JNK (JNK1 and JNK2) antibodies. (E) Flow cytometric analysis of Ca2+ influx after stimulation of thymocytes with anti–TCR-α/β antibody. Arrows indicate addition of cross-linking streptavidin.
Figure 3
Figure 3
Effects of WASp deficiency on TCR signaling. WAS / or WAS +/+ thymocytes or lymph node T cells were stimulated with biotinylated anti-TCR antibody (10 μg/ml) followed by streptavidin cross-linking (10 μg/ml) for the indicated times. Lysates were prepared as in Materials and Methods, and the lysate proteins were either (A) resolved over SDS-PAGE and subjected to antiphosphotyrosine immunoblotting analysis; (B) subjected to immunoprecipitation with anti–TCR-ζ (top panel) or anti-ZAP70 (bottom panel) antibodies as well as control rabbit IgG(c) and subsequent sequential immunoblotting with antiphosphotyrosine (anti p-Tyr) and anti–TCR-ζ or anti-ZAP70 antibodies, respectively; (C) immunoprecipitated with anti-ERK1 and anti-ERK2 antibodies as well as control IgG(c), and the immune complexes were evaluated for ability to phosphorylate MBP by SDS-PAGE and autoradiography (upper panel) and for amount of ERK1 and ERK2 by immunoblotting analysis (lower panel); or (D) resolved over SDS-PAGE and subjected to sequential immunoblotting analysis with antiphospho-SAPK/JNK (pSAPK/JNK) and anti-SAPK/JNK (JNK1 and JNK2) antibodies. (E) Flow cytometric analysis of Ca2+ influx after stimulation of thymocytes with anti–TCR-α/β antibody. Arrows indicate addition of cross-linking streptavidin.
Figure 4
Figure 4
Analysis of lymphocyte cap formation, actin polymerization, and endocytosis and neutrophil phagocytosis in WAS / mice. (A) Percentages (±SD) of WAS +/+ and WAS / thymocytes and splenic B cells showing antigen receptor clustering after antigen receptor ligation. Peripheral lymph node T cells and splenic cells from WAS / and wild-type (+/+) mice were incubated with soluble biotinylated anti-TCR antibody (1 μg/ml) or with 1 μg/ml biotinylated anti–mouse IgD antibody, respectively, followed by FITC-conjugated streptavidin and then fixed with 2% paraformaldehyde as described in Materials and Methods. Capped cells were then visualized by fluorescence confocal microscopy, and the percentage of capped cells was determined by scoring cells from 10 microscope fields per sample (100–200 cells/field). (B) Fluorescence confocal micrograph (original magnification: ×126) showing TCR capping of anti-TCR–stimulated thymocytes (as above) from WAS / (bottom) and wild-type (top) mice. (C) Impairment of actin polymerization in WAS / mice. Thymocytes from WAS / and WAS +/+ mice were isolated and stimulated with anti-CD3∈ antibody (1 μg/ml) for 30 min on ice, followed by cross-linking with a secondary antibody (outlined histograms) or alternatively, treated with the secondary antibody alone (filled histograms). Cells were fixed with 4% paraformaldehyde, and F-actin content was quantitated by flow cytometric analysis of FITC-phalloidin–stained cells. One result representative of three independent experiments is shown. (D) TCR internalization in WAS / T cells. Lymph node T cells from WAS / and wild-type mice were incubated for 30 min on ice with anti-CD3 antibody (1 μg/ml) and then washed and incubated for an additional 30 min on ice with biotinylated goat anti–hamster antibody (2 μg/ml). Cells were then warmed to 37°C, and aliquots were removed at 5 and 60 min, mixed with 0.1% NaN3 on ice, and stained with FITC-conjugated streptavidin. Cells were then fixed for 15 min in 4% paraformaldehyde, and surface TCR expression was analyzed by flow cytometry. (E) Phagocytic activity of bone marrow neutrophils from WAS / mice. Neutrophils were purified from WAS / and wild-type bone marrow as described in Materials and Methods and then incubated for 5 min at 37°C with opsonized zymosan and lucifer yellow. Cells were then washed, and the percentage of lucifer yellow–containing phagosomes was evaluated by fluorescence microscopy. The percent phagocytosis was calculated from the total number of cells with lucifer yellow–stained phagosomes relative to the total number of cells in six to eight high-power fields. Values represent the mean ± SEM of five independent experiments.

References

    1. Aldrich R.A., Steinberg A.G., Campbell D.C. Pedigree demonstrating a sex-linked recessive condition characterized by draining ears, eczematoid dermatitis and bloody diarrhea. Paediatrics. 1954;13:133–138. - PubMed
    1. Cooper M.D., Chase H.P., Lowman J.T., Krivit W., Good R.A. The Wiskott-Aldrich syndromean immunologic deficiency disease involving the afferent limb of immunity. Am. J. Med. 1968;44:499–513. - PubMed
    1. Ochs H.D., Slichter S.J., Harker L.A., von Behrens W.E., Clark R.A., Wedgwood R.J. The Wiskott-Aldrich syndromestudies of lymphocytes, granulocytes, and platelets. Blood. 1980;55:243–252. - PubMed
    1. Spitler L.E., Levin A.S., Stites D.P., Fudenberg H.H., Huber H.H. The Wiskott-Aldrich syndrome. Immunologic studies in nine patients and selected family members. Cell. Immunol. 1975;19:201–218. - PubMed
    1. Grottum K.A., Hovig T., Holmsen H., Abrahamson A.F., Jeremic M., Seip M. Wiskott-Aldrich syndromequalitative platelet defects and short platelet survival. Br. J. Haematol. 1969;17:373–388. - PubMed

Publication types

MeSH terms