Influence of cell number on the characteristics and synchrony of Ca2+ oscillations in clusters of mouse pancreatic islet cells
- PMID: 10545148
- PMCID: PMC2269631
- DOI: 10.1111/j.1469-7793.1999.00839.x
Influence of cell number on the characteristics and synchrony of Ca2+ oscillations in clusters of mouse pancreatic islet cells
Abstract
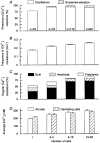
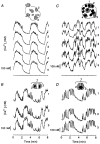
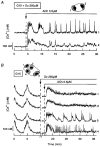
1. The cytoplasmic Ca2+ concentration ([Ca2+]i) was measured in single cells and cell clusters of different sizes prepared from mouse pancreatic islets. 2. During stimulation with 15 mM glucose, 20 % of isolated cells were inert, whereas 80 % showed [Ca2+]i oscillations of variable amplitude, duration and frequency. Spectral analysis identified a major frequency of 0.14 min-1 and a less prominent one of 0.27 min-1. 3. In contrast, practically all clusters (2-50 cells) responded to glucose, and no inert cells were identified within the clusters. As compared to single cells, mean [Ca2+]i was more elevated, [Ca2+]i oscillations were more regular and their major frequency was slightly higher (but reached a plateau at approximately 0.25 min-1). In some cells and clusters, faster oscillations occurred on top of the slow ones, between them or randomly. 4. Image analysis revealed that the regular [Ca2+]i oscillations were well synchronized between all cells of the clusters. Even when the Ca2+ response was irregular, slow and fast [Ca2+]i oscillations induced by glucose were also synchronous in all cells. 5. In contrast, [Ca2+]i oscillations resulting from mobilization of intracellular Ca2+ by acetylcholine were restricted to certain cells only and were not synchronized. 6. Heptanol and 18alpha-glycyrrhetinic acid, two agents widely used to block gap junctions, altered glucose-induced Ca2+ oscillations, but control experiments showed that they also exerted effects other than a selective uncoupling of the cells. 7. The results support theoretical models predicting an increased regularity of glucose-dependent oscillatory events in clusters as compared to isolated islet cells, but contradict the proposal that the frequency of the oscillations increases with the number of coupled cells. Islet cell clusters function better as electrical than biochemical syncytia. This may explain the co-ordination of [Ca2+]i oscillations driven by depolarization-dependent Ca2+ influx during glucose stimulation.
Figures


Similar articles
-
Control of pulsatile 5-HT/insulin secretion from single mouse pancreatic islets by intracellular calcium dynamics.J Physiol. 1998 Jul 1;510 ( Pt 1)(Pt 1):135-43. doi: 10.1111/j.1469-7793.1998.135bz.x. J Physiol. 1998. PMID: 9625872 Free PMC article.
-
Synchronization and entrainment of cytoplasmic Ca2+ oscillations in cell clusters prepared from single or multiple mouse pancreatic islets.Am J Physiol Endocrinol Metab. 2004 Aug;287(2):E340-7. doi: 10.1152/ajpendo.00069.2004. Epub 2004 May 4. Am J Physiol Endocrinol Metab. 2004. PMID: 15126238
-
Temporal and quantitative correlations between insulin secretion and stably elevated or oscillatory cytoplasmic Ca2+ in mouse pancreatic beta-cells.Diabetes. 1998 Aug;47(8):1266-73. doi: 10.2337/diab.47.8.1266. Diabetes. 1998. PMID: 9703327
-
Generation of glucose-dependent slow oscillations of cytoplasmic Ca2+ in individual pancreatic beta cells.Diabetes Metab. 1998 Feb;24(1):25-9. Diabetes Metab. 1998. PMID: 9534005 Review.
-
Cytosolic calcium oscillations and insulin release in pancreatic islets of Langerhans.Diabetes Metab. 1998 Feb;24(1):37-40. Diabetes Metab. 1998. PMID: 9534007 Review.
Cited by
-
A low-protein diet during pregnancy prevents modifications in intercellular communication proteins in rat islets.Biol Res. 2015 Jan 16;48(1):3. doi: 10.1186/0717-6287-48-3. Biol Res. 2015. PMID: 25654754 Free PMC article.
-
Immunohistochemical evidence that culture in the high aspect rotating vessel can up-regulate hormone expression in growth dedifferentiated PHHI-derived islet cells.In Vitro Cell Dev Biol Anim. 2007 Jul-Aug;43(7):210-4. doi: 10.1007/s11626-007-9046-0. Epub 2007 Sep 11. In Vitro Cell Dev Biol Anim. 2007. PMID: 17846858
-
Atypical Ca2+-induced Ca2+ release from a sarco-endoplasmic reticulum Ca2+-ATPase 3-dependent Ca2+ pool in mouse pancreatic beta-cells.J Physiol. 2004 Aug 15;559(Pt 1):141-56. doi: 10.1113/jphysiol.2004.067454. Epub 2004 Jun 24. J Physiol. 2004. PMID: 15218077 Free PMC article.
-
β Cells Operate Collectively to Help Maintain Glucose Homeostasis.Biophys J. 2020 May 19;118(10):2588-2595. doi: 10.1016/j.bpj.2020.04.005. Epub 2020 Apr 15. Biophys J. 2020. PMID: 32353256 Free PMC article.
-
Size-controlled insulin-secreting cell clusters.Acta Biomater. 2012 Dec;8(12):4278-84. doi: 10.1016/j.actbio.2012.08.010. Epub 2012 Aug 14. Acta Biomater. 2012. PMID: 22902301 Free PMC article.
References
-
- Asada N, Shibuya I, Iwanaga T, Niwa K, Kanno T. Identification of α- and β-cells in intact isolated islets of Langerhans by their characteristic cytoplasmic Ca2+ concentration dynamics and immunocytochemical staining. Diabetes. 1998;47:751–757. - PubMed
-
- Bergsten P, Lin J, Westerlund J. Pulsatile insulin release: role of cytoplasmic Ca2+ oscillations. Diabetes and Metabolism. 1998;24:41–45. - PubMed
-
- Berts A, Gylfe E, Hellman B. Ca2+ oscillations in pancreatic islet cells secreting glucagon and somatostatin. Biochemical and Biophysical Research Communications. 1995;208:644–649. - PubMed
-
- Cook DL. Isolated islets of Langerhans have slow oscillations of electrical activity. Metabolism. 1983;32:681–685. - PubMed
Publication types
MeSH terms
Substances
LinkOut - more resources
Full Text Sources
Other Literature Sources
Research Materials
Miscellaneous

