. 1999 Nov 1;147(3):559-76.
doi: 10.1083/jcb.147.3.559.

PAKa, a putative PAK family member, is required for cytokinesis and the regulation of the cytoskeleton in Dictyostelium discoideum cells during chemotaxis

Affiliations

PAKa, a putative PAK family member, is required for cytokinesis and the regulation of the cytoskeleton in Dictyostelium discoideum cells during chemotaxis

C Y Chung et al. J Cell Biol. .

Abstract

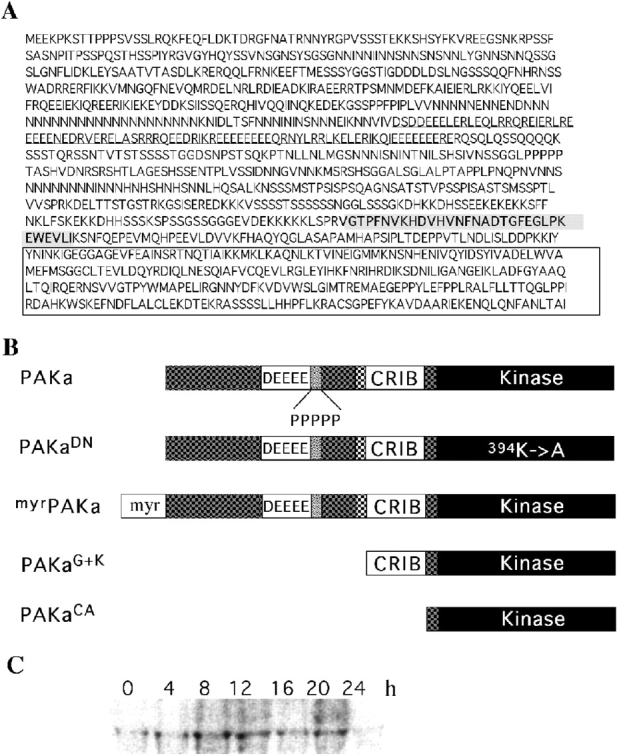
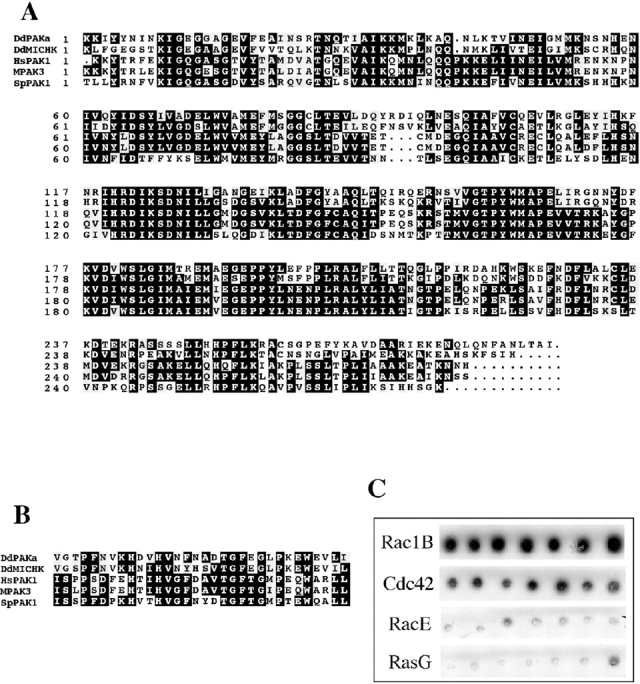
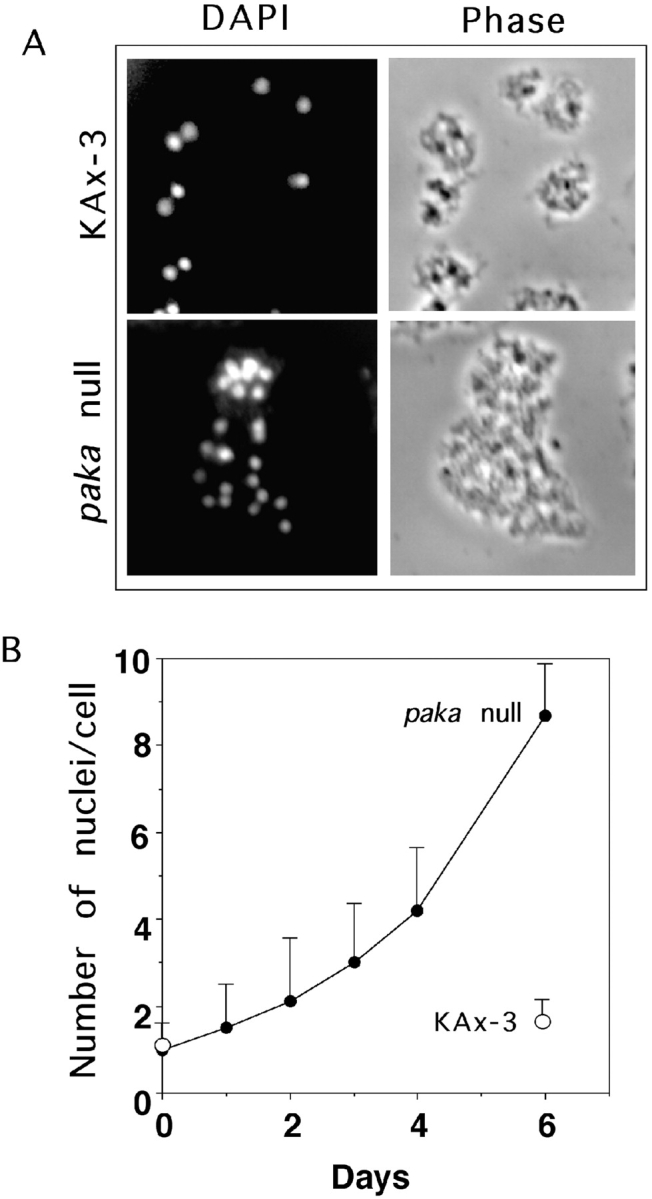
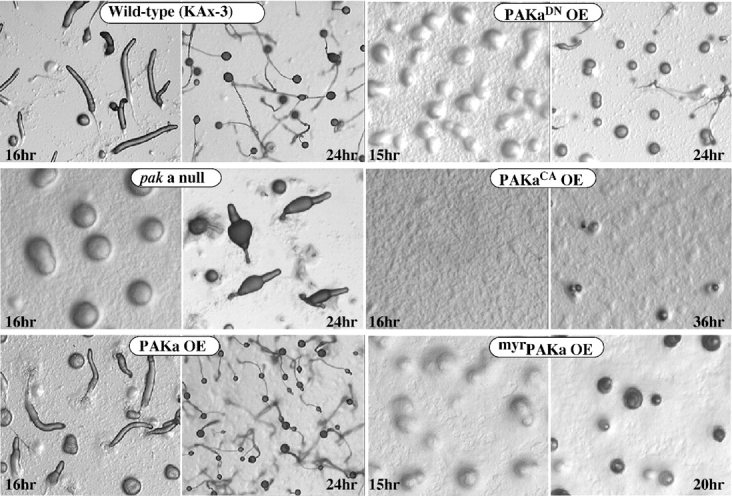
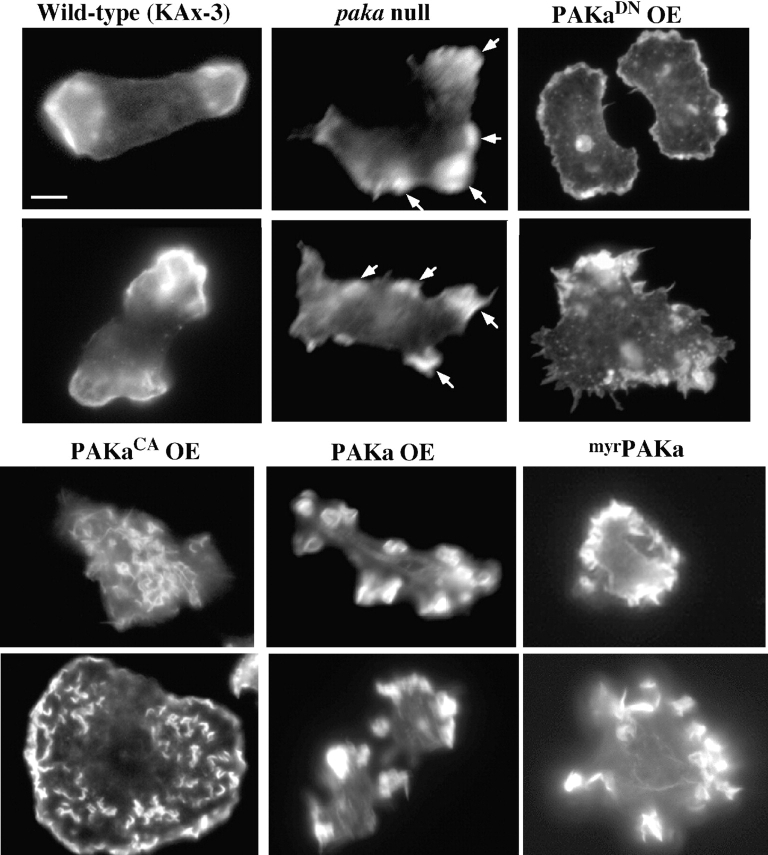
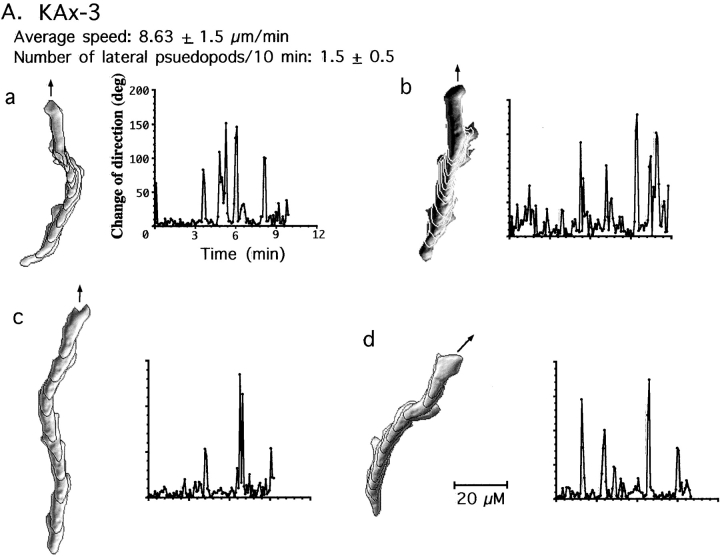
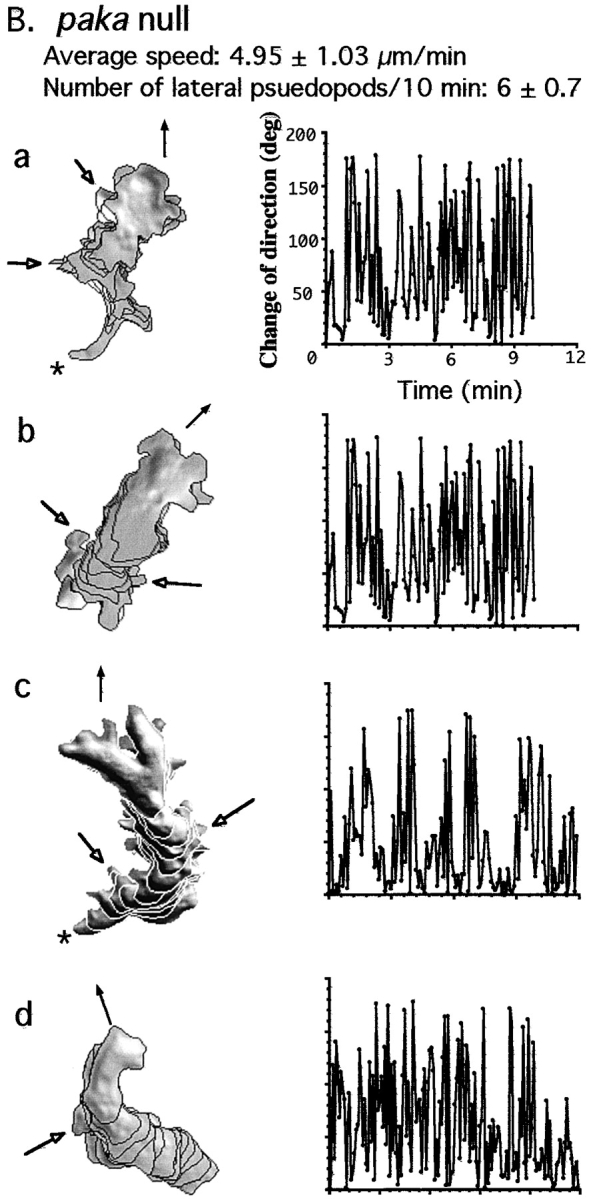
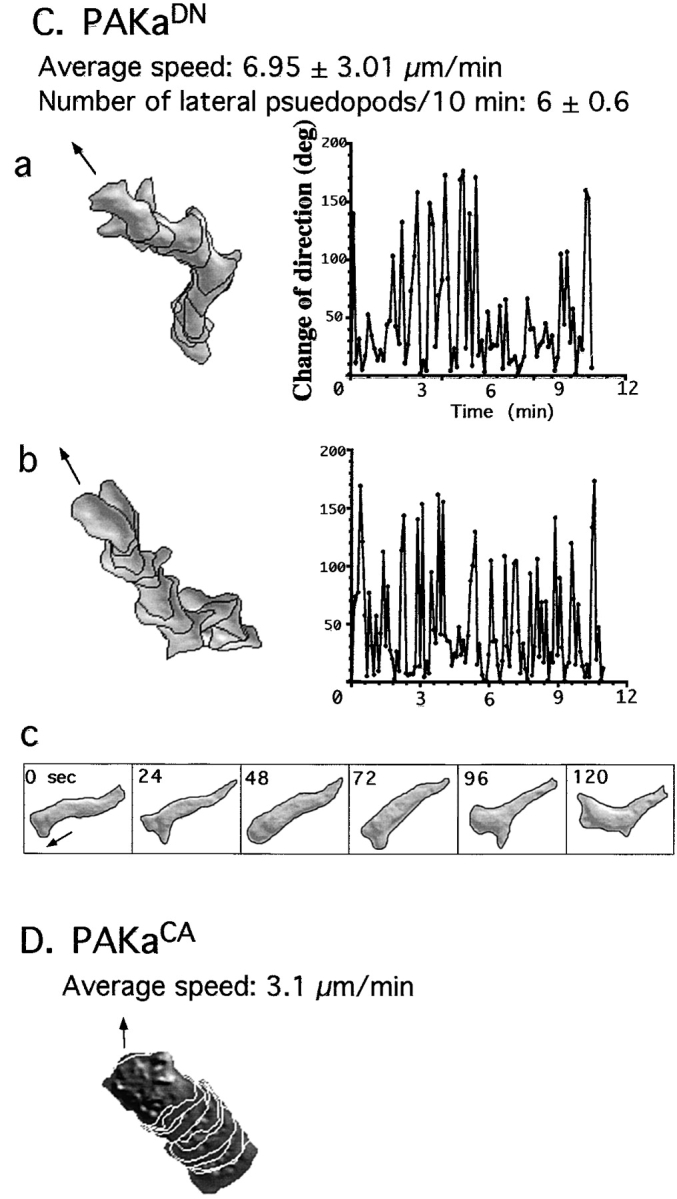
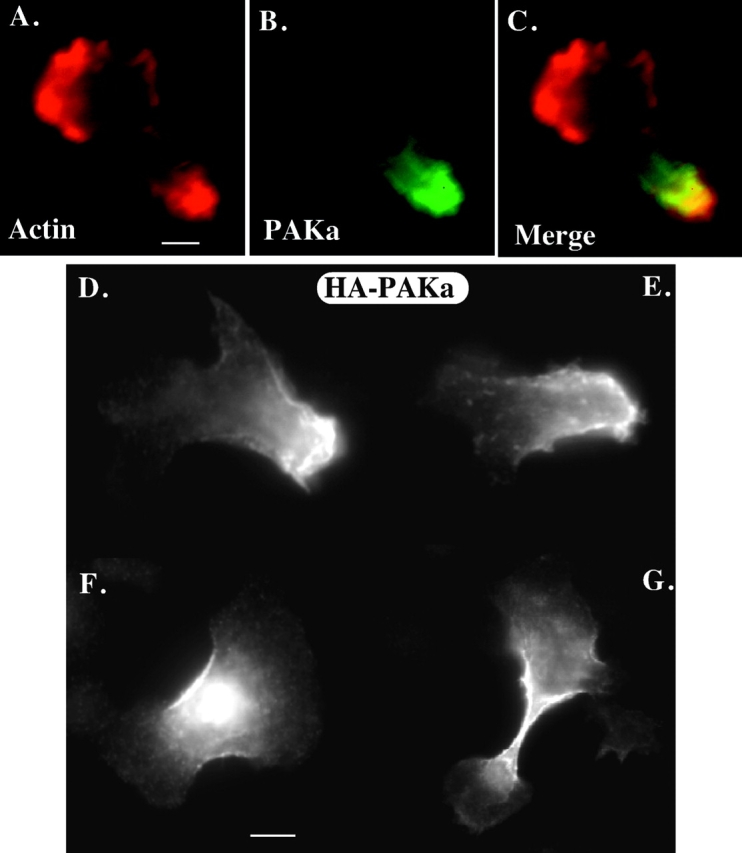
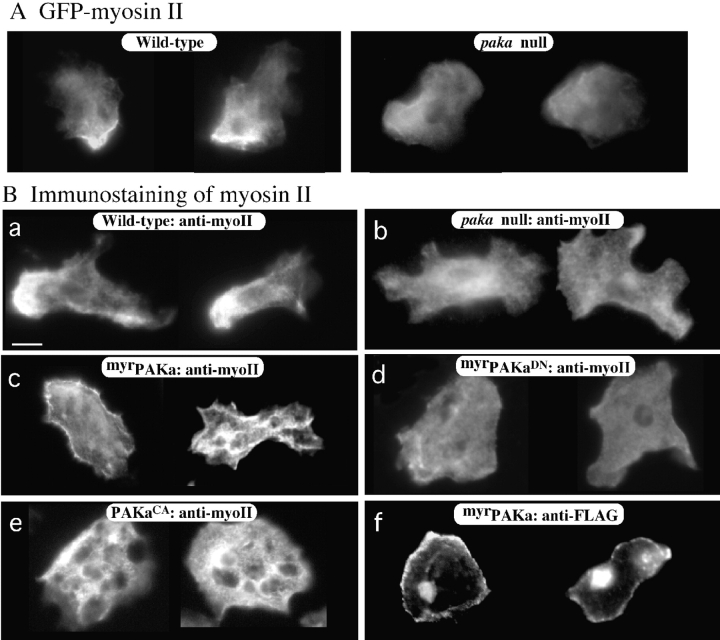
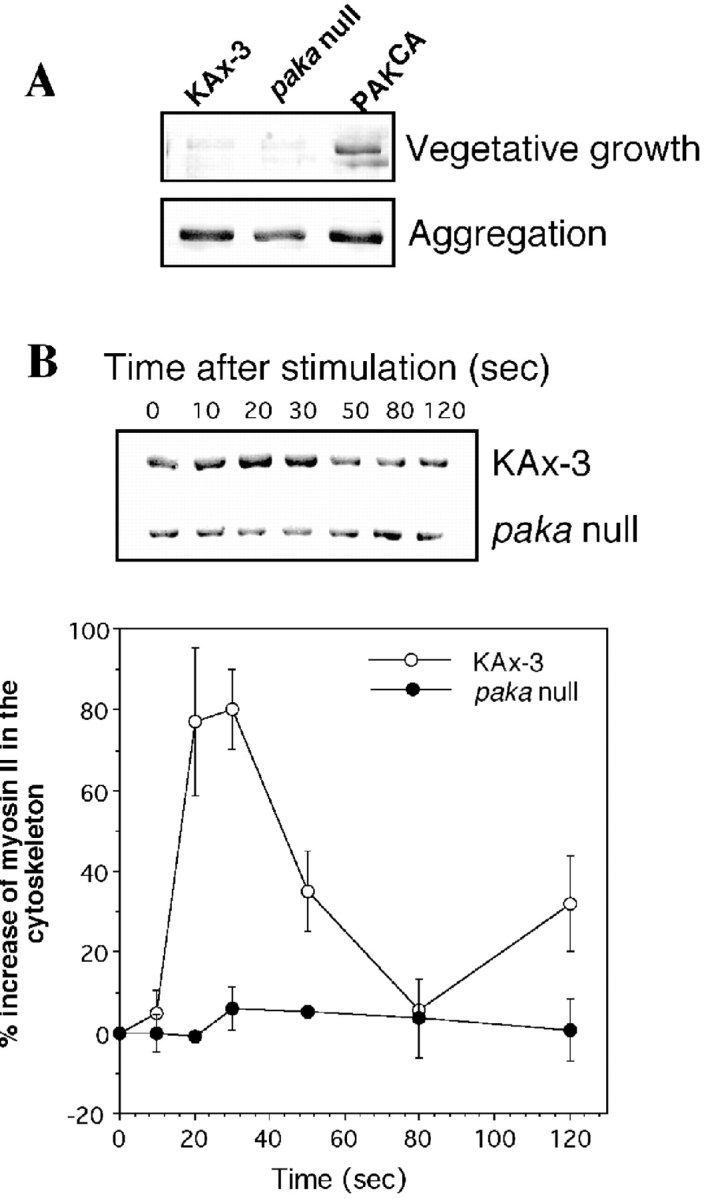
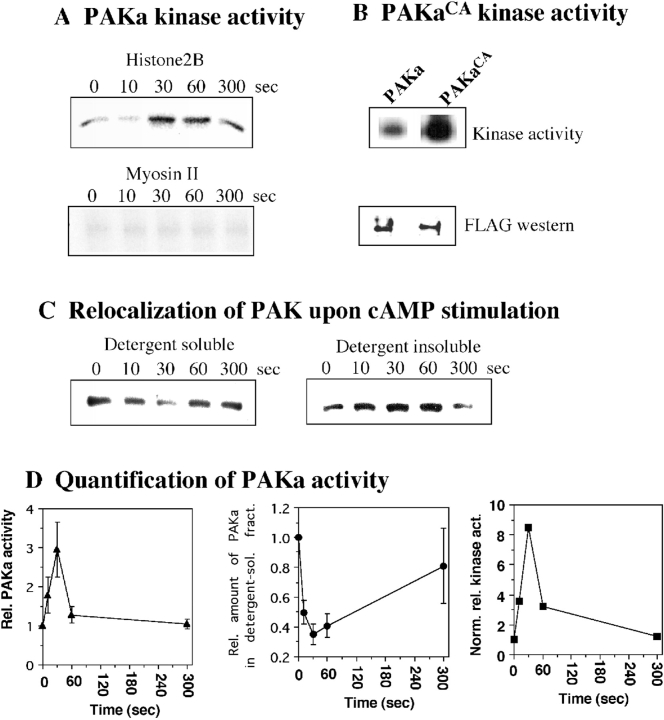
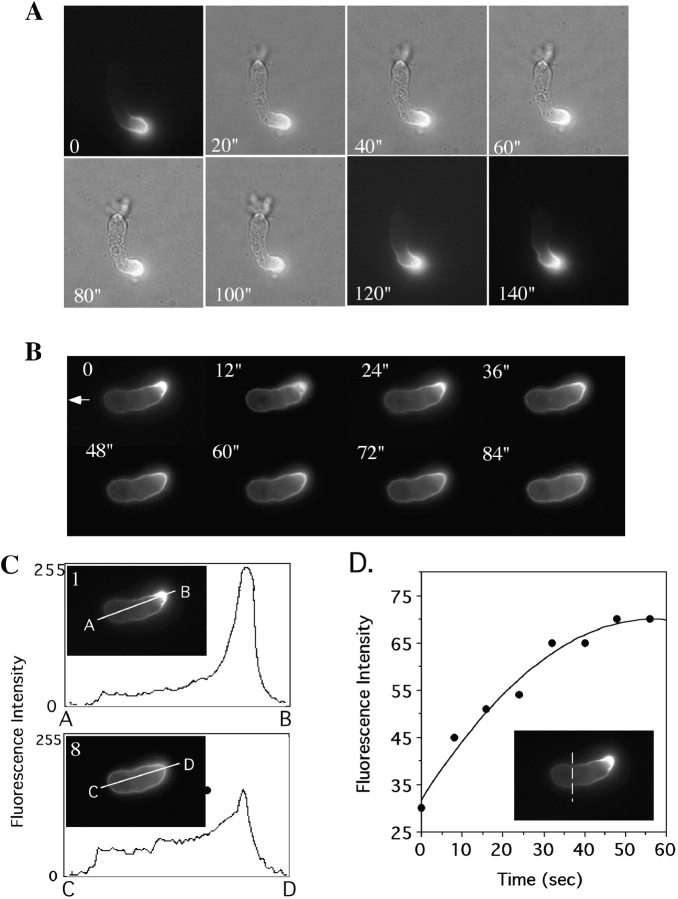
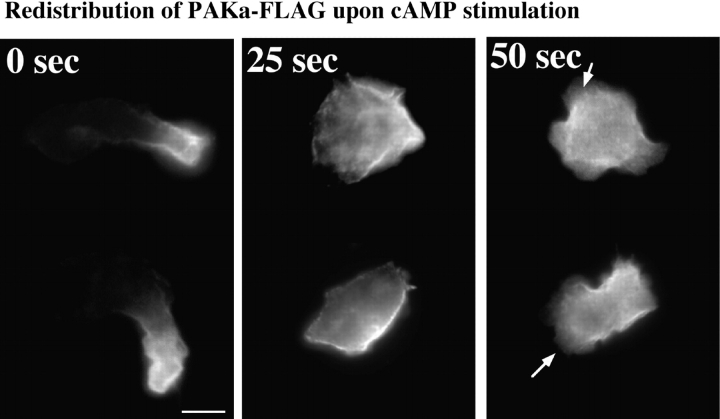
We have identified a Dictyostelium discoideum gene encoding a serine/threonine kinase, PAKa, a putative member of the Ste20/PAK family of p21-activated kinases, with a kinase domain and a long NH(2)-terminal regulatory domain containing an acidic segment, a polyproline domain, and a CRIB domain. PAKa colocalizes with myosin II to the cleavage furrow of dividing cells and the posterior of polarized, chemotaxing cells via its NH(2)-terminal domain. paka null cells are defective in completing cytokinesis in suspension. PAKa is also required for maintaining the direction of cell movement, suppressing lateral pseudopod extension, and proper retraction of the posterior of chemotaxing cells. paka null cells are defective in myosin II assembly, as the myosin II cap in the posterior of chemotaxing cells and myosin II assembly into cytoskeleton upon cAMP stimulation are absent in these cells, while constitutively active PAKa leads to an upregulation of myosin II assembly. PAKa kinase activity against histone 2B is transiently stimulated and PAKa incorporates into the cytoskeleton with kinetics similar to those of myosin II assembly in response to chemoattractant signaling. However, PAKa does not phosphorylate myosin II. We suggest that PAKa is a major regulator of myosin II assembly, but does so by negatively regulating myosin II heavy chain kinase.


Figures

Figure 1
Figure 1
Deduced sequence of PAKa. A, The cDNA clone, PAKa 6-1, has an insert of 3670 nt and contains the entire PAKa open reading frame. The boxed region depicts the conserved kinase domain. The underlined region shows acidic domain. The bolded and underlined sequence represents a polyproline stretch. The shaded sequence indicates the CRIB domain. The GenBank/EMBL/DDBJ accession number for PAKa is AF131221. B, Schematic diagrams of PAKa and PAKa mutants. C, Developmental RNA blot of PAKa expression. 6 μg of total RNA was loaded in each lane and probed (Datta and Firtel 1987). Time in development is shown. 0 h, vegetative cells.
Figure 2
Figure 2
A, Amino acid sequence comparison of the kinase domain of PAKa with PAKs from a variety of organisms. DdP, Dictyostelium PAKa; DdM, Dictyostelium MIHCK; Hs, human PAK1; mo, mouse PAK3; Sp, Saccharomyces pombe PAK1. GenBank/EMBL/DDBJ accession numbers: human PAK1, Q13153; mouse mPAK-3, g1168176; Saccharomyces pombe PAK1, P50527; Dictyostelium discoideum MIHCK, U67716. B, Amino acid sequence comparison of the CRIB domain of PAKa with PAKs from other organisms. C, Interaction of CRIB domain of PAKa with small G proteins in the yeast two-hybrid system developed in the laboratory of Roger Brent (Gyuris et al. 1993), which was used to examine the interactions between PAKa and small G proteins as described previously (Lee et al. 1997). The CRIB domain of PAKa was cloned into bait vector pEG202. Constitutively active Rac1B, RacE, RasG, and human Cdc42 were cloned into fish vector pG4-5. EGY48. Yeast was transformed with PEG202, pG4-5, and a reporter construct. Several colonies were picked and plated on Gal/CM UraHisTrp plates containing X-gal. The picture depicts color development 4 d after plating. DdRac1B and HsCdc42 show strong interaction with the CRIB domain of PAK, as colonies are dark blue on X-gal plates. In contrast, RacE and RasG have very weak interactions, as colonies do not show any color development. RasG interacts strongly with the Ras-interacting domains of RIP3 (Lee et al. 1999) and PI3K1 and PI3K2 in the same yeast two-hybrid system. Under these conditions, Rac1B and HsCdc42 do not interact with the RIP3 Ras interacting domain. There are no known proteins that interact with RacE.
Figure 3
Figure 3
Multinucleated paka null cells due to defective cytokinesis. A, Defective cytokinesis in paka null cells. Phase-contrast and epifluorescent micrographs of multinucleated paka null cells grown in shaking culture for 5 d. Nuclei were visualized with DAPI. B, Increase of the number of nuclei in paka null cells. Wild-type KAx3 and paka null cells were transferred from plates into axenic medium in shaken culture at 0 h and the number of nuclei in a cell were counted at intervals thereafter. Cells were counted using a hematocytometer. When paka null cells are grown in suspension for 5 d, there are an average of eight nuclei per cell.
Figure 4
Figure 4
Development of paka null cells and cells expressing PAKa mutants. Cells grown in axenic medium were washed and plated on nonnutrient agar plates. Photographs were taken at various developmental stages thereafter. Development of paka null cells is delayed in aggregation and late development. Cells expressing dominant negative PAKa (PAKaDN) and myristoylated PAKa (myrPAKa) exhibit delayed aggregation similar to that of paka null cells. The phenotype of myrPAKa is more severe than either paka null or PAKaDN cells. Cells expressing constitutively active PAKa (PAKaCA) have a severe defect in aggregation and never form mounds.
Figure 5
Figure 5
Organization of the actin cytoskeleton in paka null cells and cells expressing PAKa mutants. Cells were plated on glass coverslips and starved for 5–6 h before fixation with 3.7% formaldehyde in 12 mM Na/KPO4 (pH 6.1) for 5 min. After washing, cells were treated with blocking solution (PBS, 0.1% Triton X-100, 0.1% BSA) and 10 ng of FITC or rhodamine-labeled phalloidin was added to each glass coverslip. Note that wild-type cells have F-actin–rich lamellipodia at the leading edge that are absent in paka null cells and cells expressing PAKaDN. Cells expressing PAKaCA accumulate F-actin all over the cells. Cells overexpressing wild-type PAKa are elongated and have discrete actin-enriched domains along the periphery of the cell. Cells expressing myrPAKa exhibit domains of assembled F-actin along the entire membrane cortex. paka null cells exhibit multiple pseudopod-like, actin-enriched blebs. Some of these are marked with an arrow. Bar, 5 μm.
Figure 6
Figure 6
Abnormal chemotactic movement of paka null cells and cells expressing PAKa mutants. Wild-type and paka null cells were washed and pulsed for 4.5 h with 30 nM cAMP every 6 min (see Materials and Methods). Cells were plated on a plastic petri dish containing a hole, over which a glass microscope slide was glued. The tip of the micropipette containing 100 μM cAMP was placed near the cell as described in detail previously (Meili et al. 1999). The movement of cells toward the tip was recorded with NIH Image software at 6-s intervals and the movement of cells and shape changes were analyzed with the DIAS program, a newly developed image analysis system. A, Wild-type cells are well-polarized and move toward the cAMP gradient without making lateral pseudopodia. Left panel shows superimposed images representing cell shape at 1-min intervals. Right panel shows the change of direction in which the leading edge of the migrating cell headed. Solid arrows point out the direction of the micropipette filled with 100 μM cAMP. Note that wild-type cells do not make lateral pseudopodia and do not change their direction of movement very often. Bar, 20 μm. The number of newly formed pseudopodia was counted in each image for the 10-min time period of the experiment. B, paka null cells protrude many random lateral pseudopodia (average ∼6 lateral pseudopodia in 10 min, some of which are marked with open arrows) and the posterior cell bodies (marked with asterisks, a and c) of null cells are elongated, due to the difficulty in retracting. Due to frequent changes of the direction of movement, the speed of chemotactic movement of paka null cells is slower than that of wild-type cells. C, Cells expressing PAKaDN make many random lateral pseudopodia and show elongated posterior cell bodies due to the difficulty of retraction (c). D, Cells expressing PAKaCA are very flattened and stationary. They are not polarized and move very slowly in random directions.
Figure 6
Figure 6
Abnormal chemotactic movement of paka null cells and cells expressing PAKa mutants. Wild-type and paka null cells were washed and pulsed for 4.5 h with 30 nM cAMP every 6 min (see Materials and Methods). Cells were plated on a plastic petri dish containing a hole, over which a glass microscope slide was glued. The tip of the micropipette containing 100 μM cAMP was placed near the cell as described in detail previously (Meili et al. 1999). The movement of cells toward the tip was recorded with NIH Image software at 6-s intervals and the movement of cells and shape changes were analyzed with the DIAS program, a newly developed image analysis system. A, Wild-type cells are well-polarized and move toward the cAMP gradient without making lateral pseudopodia. Left panel shows superimposed images representing cell shape at 1-min intervals. Right panel shows the change of direction in which the leading edge of the migrating cell headed. Solid arrows point out the direction of the micropipette filled with 100 μM cAMP. Note that wild-type cells do not make lateral pseudopodia and do not change their direction of movement very often. Bar, 20 μm. The number of newly formed pseudopodia was counted in each image for the 10-min time period of the experiment. B, paka null cells protrude many random lateral pseudopodia (average ∼6 lateral pseudopodia in 10 min, some of which are marked with open arrows) and the posterior cell bodies (marked with asterisks, a and c) of null cells are elongated, due to the difficulty in retracting. Due to frequent changes of the direction of movement, the speed of chemotactic movement of paka null cells is slower than that of wild-type cells. C, Cells expressing PAKaDN make many random lateral pseudopodia and show elongated posterior cell bodies due to the difficulty of retraction (c). D, Cells expressing PAKaCA are very flattened and stationary. They are not polarized and move very slowly in random directions.
Figure 7
Figure 7
Localization of PAKa in the cell. The distribution of PAKa was examined in cells expressing FLAG- (at the COOH terminus) or HA- (at the NH2 terminus) tagged PAKa by indirect immunofluorescence staining as described in the Materials and Methods. A, Distribution of F-actin stained with FITC-phalloidin. F-actin is mainly concentrated at the leading edge of a migrating cell, but is found in the posterior cell body. B, Localization of FLAG-tagged PAKa in a cell at the aggregation stage. PAKa localizes in the posterior cell body. C, Merge of A and B. Note that F-actin staining and PAKa staining are overlapped in the posterior cell body. D and E, Distribution of HA-tagged PAKa in cells at the aggregation stage. Note that PAKa is concentrated at the posterior cortex. F and G, Localization of HA–PAKa in the cleavage furrow. Bar, 5 μM.
Figure 8
Figure 8
A, Localization of GFP–myosin II in aggregation stage wild-type or paka null cells. Myosin II is localized at the posterior cortex of wild-type cells, but not in paka null cells. GFP–myosin II is very diffuse throughout the null cells. B, The localization of myosin II was examined by indirect immunofluorescence staining with antimyosin II heavy chain antibody (a–e). Similar to GFP–myosin II, the staining of myosin II is concentrated at the posterior cortex. In paka null cells, the staining of myosin II is very diffuse over the cell. In cells expressing myrPAKa, myosin II staining is localized at the membrane cortex throughout the cells. However, this localized myosin II assembly at membrane cortex is not observed in cells expressing myrPAKaDN. Cells expressing PAKCA show regions of very strong myosin II staining, presumably due to the high level of assembled myosin II. myrPAKa appears to be targeted to the membrane as determined by localization of myrPAKa–FLAG by immunofluorescence staining (f). The intracellular staining is nuclear, which was sometimes observed in Dictyostelium cells using the FLAG antibody. Bar, 5 μm.
Figure 9
Figure 9
A, Level of myosin II content in cytoskeleton fractions of wild-type cells, paka null cells, and cells expressing PAKaCA. Cells (2 × 10⁷) grown in axenic medium in shaken culture were collected by centrifugation and lysed with lysis buffer (see Materials and Methods). For aggregation-competent cells, the same number of cells was plated on a 100-mm petri dish, washed twice with phosphate buffer, and starved for 5 h. After 5 h, cells were lysed by adding lysis buffer and lysates were collected by using a rubber policeman. Lysates (containing 500 μg of protein) were spun at 11,000 g for 4 min to collect the pellet containing the cytoskeletal fraction, which was washed once with lysis buffer. The pellet was dissolved in 2× SDS-PAGE sample buffer and boiled for 5 min. Samples were run on 8% SDS gels and proteins were stained with Coomassie blue. Gel bands were scanned and changes in myosin II content were quantified with IPLAB software. In the vegetative, growing stage in wild-type and paka null cells, little of the myosin II is assembled into the cytoskeleton fraction, but the cytoskeleton from cells expressing PAKaCA has a much higher myosin II content, resulting from higher PAKa activity. In the aggregation stage, the myosin II level is elevated in all three cell types, but paka null cells exhibit a lower level of myosin II content than wild-type cells. B, Changes of myosin II content in the cytoskeleton upon cAMP stimulation. Cells were pulsed (see Materials and Methods), washed with phosphate buffer, and incubated in 1 mM caffeine for 10 min. After washing the cells, 100 μM cAMP was added and an equal number of cells was collected at specific time points. Cell lysis was immediate. Determination of the myosin II content in the cytoskeleton fraction was done as described above and graphed in the lower part of the figure. The data are from four separate experiments. Myosin II content peaks at 30 s after cAMP stimulation in wild-type KAx3 cells, but this peak is missing in paka null cells.
Figure 10
Figure 10
A, Activation of PAKa upon stimulation of cells with cAMP. PAKa activity of immunoprecipitates towards histone 2B and myosin II as substrates is shown. Aggregation stage cells expressing FLAG-tagged PAKa (see Materials and Methods) were activated by cAMP. Aliquots were taken at various time points after stimulation. Cells were lysed, PAKa was precipitated using an anti-FLAG mAb, and kinase activity was measured as described in Materials and Methods. Phosphorylation of histone 2B (H2B), but not myosin II, is stimulated by cAMP. B, Activity of PAKaCA compared with PAKa. Cells expressing FLAG-tagged PAKa and PAKaCA were pulsed and PAKa and PAKaCA were immunoprecipitated with anti-FLAG antibody. Kinase activity was measured as described above. The same amount of PAKaCA (determined by Western analysis with anti-FLAG antibody) showed a much higher basal activity than PAKa. C, Incorporation of PAKa–FLAG into the cytoskeleton upon the stimulation of cAMP. Cells were prepared as described in the kinase assay and cell lysate was spun at 11,000 g for 5 min to collect the detergent-insoluble cytoskeleton fraction. The amount of PAKa–FLAG in the detergent-soluble cytosol and insoluble cytoskeleton fraction was determined by immunoblotting with the anti-FLAG antibody. The level of PAKa–FLAG in the detergent-soluble fraction was rapidly decreased upon the cAMP stimulation and the level of PAKa–FLAG in the detergent-insoluble cytoskeleton fraction was reciprocally increased. This relocalization of PAKa–FLAG was reversible and the level of PAKa–FLAG in the detergent-soluble fraction returned to the level of unstimulated cells after 5 min. The kinetics of the incorporation of PAK–FLAG are similar to those of PAKa activation by cAMP. D, Quantification of PAKa activity. The PAKa activity normalized by the amount of PAKa in the detergent-soluble fraction was plotted. The data are from four separate experiments.
Figure 11
Figure 11
Localization of N-PAKa–GFP protein in a migrating Dictyostelium cell. A, N-PAKa–GFP fusion protein was expressed in a wild-type cell and the localization of fusion protein was examined in a live, migrating cell. Cells expressing GFP fusion protein were pulsed with 30 nM cAMP for 5 h and plated on a coverslip. The fusion protein stays at the posterior cortex while cell is moving. A single cell was viewed at 20-s intervals. A low level of visible light was used to view the cell body in combination with fluorescent GFP fusion protein. B, Localization of fusion protein in a cell was examined when the cell lost polarity by overlaying 150 μM cAMP solution on the cell. GFP fusion protein is originally localized at the posterior cortex and diffuses along the membrane cortex as the cell loses polarity and starts rounding up. A single cell was viewed at 12-s intervals. A solid white arrow points to the leading edge. C, Quantification of the stimulus-induced relocalization of N-PAKa–GFP at the plasma membrane. The difference in fluorescence intensities before and after the addition of cAMP over the cell was measured along a thin line through the central portion of cells (Fig. 9 B, frames 1 and 8). D, Kinetic analysis of the relocalization of N-PAKa–GFP, along with plasma membrane. The kinetics of the translocation of N-PAKa–GFP from the rear cell body to the membrane cortex over the entire cell are presented as a measure of the fluorescence intensity along the thin line through the anterior part of the cell. The translocation of N-PAKa–GFP reached maximum ∼30–40 s after stimulation. The data shown are representative of multiple experiments.
Figure 12
Figure 12
Redistribution of PAKa upon cAMP stimulation. Cells expressing PAKa–FLAG were pulsed with 30 nM cAMP for 5 h and plated on a coverslip. Cells were bathed with 100 μM cAMP and fixed at 0, 25, and 50 s after stimulation. The localization of PAKa–FLAG was examined by indirect immunofluorescence staining with anti-FLAG antibody. Arrows indicate newly formed pseudopodia. Bar, 5 μm.

References

    1. Abu-Elneel K., Karchi M., Ravid S. Dictyostelium myosin II is regulated during chemotaxis by a novel protein kinase C. J. Biol. Chem. 1996;271:977–984. - PubMed
    1. Adachi H., Takahashi Y., Hasebe T., Shirouzu M., Yokoyama S., Sutoh K. Dictyostelium IQGAP-related protein specifically involved in the completion of cytokinesis. J. Cell Biol. 1997;137:891–898. - PMC - PubMed
    1. Bagrodia S., Dérijard B., Davis R.J., Cerione R.A. Cdc42 and PAK-mediated signaling leads to Jun kinase and p38 mitogen-activated protein kinase activation. J. Biol. Chem. 1995;270:27995–27998. - PubMed
    1. Berlot C.H., Spudich J.A., Devreotes P.N. Chemoattractant-elicited increases in myosin phosphorylation in Dictyostelium . Cell. 1985;43:307–314. - PubMed
    1. Bokoch G.M., Wang Y., Bohl B.P., Sells M.A., Quilliam L.A., Knaus U.G. Interaction of the Nck adapter protein with p21-activated kinase (PAK1) J. Biol. Chem. 1996;271:25746–25749. - PubMed

Publication types

MeSH terms

Associated data