. 1999 Nov 9;96(23):13180-5.
doi: 10.1073/pnas.96.23.13180.

c-Myc enhances protein synthesis and cell size during B lymphocyte development

Affiliations

c-Myc enhances protein synthesis and cell size during B lymphocyte development

B M Iritani et al. Proc Natl Acad Sci U S A. .

Abstract

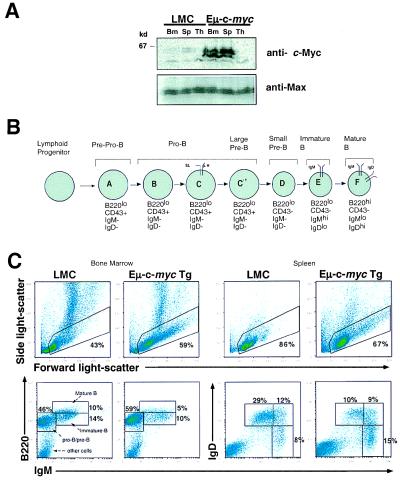
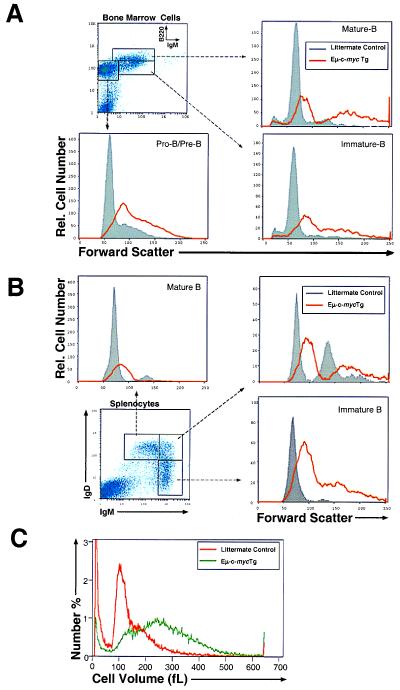
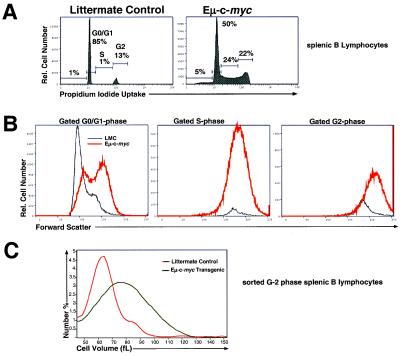
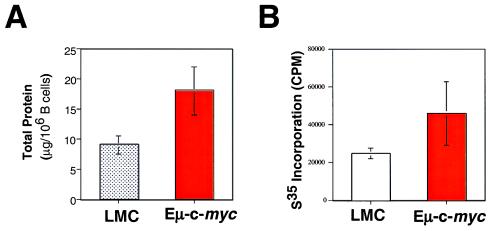
Members of the myc family of nuclear protooncogenes play roles in cell proliferation, differentiation, and apoptosis. Moreover, inappropriate expression of c-myc genes contributes to the development of many types of cancers, including B cell lymphomas in humans. Although Myc proteins have been shown to function as transcription factors, their immediate effects on the cell have not been well defined. Here we have utilized a murine model of lymphomagenesis (Emu-myc mice) to show that constitutive expression of a c-myc transgene under control of the Ig heavy-chain enhancer (Emu) results in an increase in cell size of normal pretransformed B lymphocytes at all stages of B cell development. Furthermore, we show that c-Myc-induced growth occurs independently of cell cycle phase and correlates with an increase in protein synthesis. These results suggest that Myc may normally function by coordinating expression of growth-related genes in response to mitogenic signals. Deregulated c-myc expression may predispose to cancer by enhancing cell growth to levels required for unrestrained cell division.


Figures

Figure 1
Figure 1
Expression of Eμ-c-myc transgene results in impaired B cell development. (A) Bone marrow cells (Bm), splenocytes (Sp), or thymocytes (Th) were isolated from Eμ-c-myc and littermate control mice (LMC). Cells (4 × 10⁶) were lysed in sample buffer (see Materials and Methods) and proteins separated by SDS/PAGE. Samples were transferred to nitrocellulose membranes and protein visualized by probing blots with anti-c-Myc or anti-Max. (B) A model for characterizing B lymphocyte development utilizing monoclonal antibodies to surface markers and flow cytometry (modified from ref. 54). (C) Total bone marrow cells were stained with phycoerythrin (PE)-conjugated anti-B220 and FITC-conjugated anti-IgM. Total splenocytes were stained with FITC-conjugated anti-IgD and PE-conjugated anti-IgM. Cells were then visualized by flow cytometry, gated according to forward and side light scatter (lymphocyte gate), and staged according to a general scheme for B lymphocyte development as described by Hardy et al. (see diagram and ref. 54). The forward and side light-scatter gate excluded small apoptotic cells and granular cells, whereas large cells were included (Top). The expression of Eμ-c-myc transgene results in an increase in representation of pro-B and pre-B cells in the bone marrow (Bottom Left) and immature B cells in the spleen (Bottom Right) relative to littermate control mice.
Figure 2
Figure 2
Expression of Eμ-c-myc transgene results in an increase in B cell size (growth) during all stages of B cell development. (A) Total bone marrow cells isolated from Eμ-c-myc transgenic or littermate control mice were stained with PE-conjugated anti-B220 and FITC-conjugated anti-IgM. Cells were visualized by flow cytometry. Shown are the FSC of gated B220loIgM pro-B/pre-B cells, B220loIgM+ immature B cells and B220hiIgM+ mature B cells. Cells with higher FSC are larger than cells with lower FSC. (B) Total splenocytes were stained with FITC-conjugated anti-IgD and PE-conjugated anti-IgM. Shown are the FSC of IgMhiIgDlo immature B cells, IgMhiIgDhi, and IgMloIgDhi mature B cells as visualized by flow cytometry. (C) Purified splenic B lymphocytes from either Eμ-c-myc transgenic or littermate control mice were analyzed for cell volume utilizing a Coulter Z2 counter (47). Shown is a representative single-parameter histogram.
Figure 3
Figure 3
B cells from Eμ-c-myc mice are enlarged during all phases of the cell cycle. (A) Purified splenic B lymphocytes isolated from Eμ-c-myc or littermate control mice were stained with PI, and cell cycle status was determined by flow cytometry. Shown is a representative single-parameter flow cytometric histogram. (B) FSC were determined for purified splenic B cells that fell within G0/G1, S, or G2 gates, as outlined by using PI staining in A. The biphasic G0/G1 peak likely represents separation of G0- and G1-phase cells. G0-, G1-, and G2-phase cells from Eμ-c-myc mice exhibit higher FSC than similar phase cells from littermate control mice. (C) Splenic B lymphocytes were purified, fixed in ethanol, and stained with PI (see Materials and Methods). G2-phase cells (50,000 cells) from Eμ-c-myc and littermate control mice were sorted by flow cytometry, and cell volume was determined by using the Coulter principle. (Ethanol fixation results in a significant, but proportional, reduction in cell size.)
Figure 4
Figure 4
Expression of Eμ-c-myc transgene results in increased protein synthesis. (A) Purified splenic B lymphocytes (2 × 10⁶ cells) isolated from Eμ-c-myc or littermate control mice were lysed in TNT buffer with protease inhibitors, and total protein was determined by the Bradford method. Error bars denote standard error for triplicate samples from a representative experiment. (B) Purified splenic B lymphocytes (2 × 10⁶ cells) from the above mice were cultured for 30 min in methionine-free medium, followed by 30 min in [35S]methionine-containing medium. Cells were washed and lysed in RIPA buffer (48). Lysate was spotted onto glass filters, and [35S]methionine incorporation was determined by using a liquid scintillation counter.

References

    1. Killander D, Zetterberg A. Exp Cell Res. 1965;38:272–284. - PubMed
    1. Neufeld T P, Edgar B A. Curr Opin Cell Biol. 1998;10:784–790. - PubMed
    1. Blackwood E M, Eisenman R N. Science. 1991;251:1211–1217. - PubMed
    1. Prendergast G C, Lawe D, Ziff E B. Cell. 1991;65:395–407. - PubMed
    1. Kretzner L, Blackwood E M, Eisenman R N. Nature (London) 1992;359:426–429. - PubMed

Publication types

Substances

LinkOut - more resources