Comparative Study
. 1999 Nov 9;96(23):13253-8.
doi: 10.1073/pnas.96.23.13253.

Different population dynamics of human T cell lymphotropic virus type II in intravenous drug users compared with endemically infected tribes

Affiliations
Comparative Study

Different population dynamics of human T cell lymphotropic virus type II in intravenous drug users compared with endemically infected tribes

M Salemi et al. Proc Natl Acad Sci U S A. .

Abstract

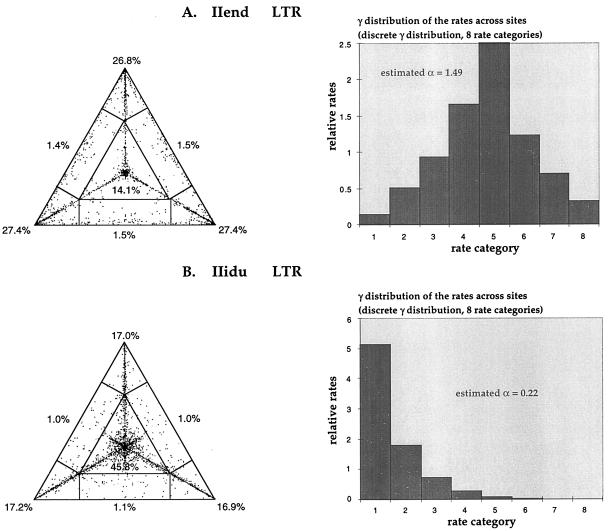
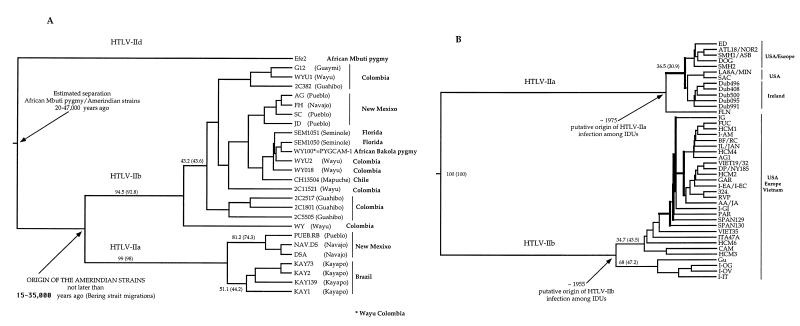
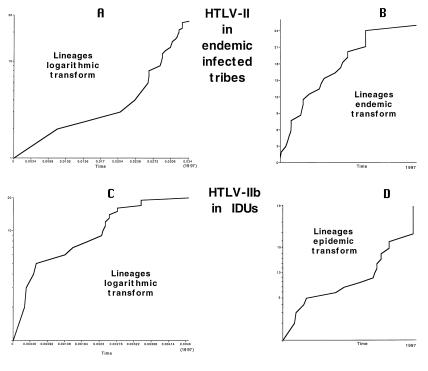
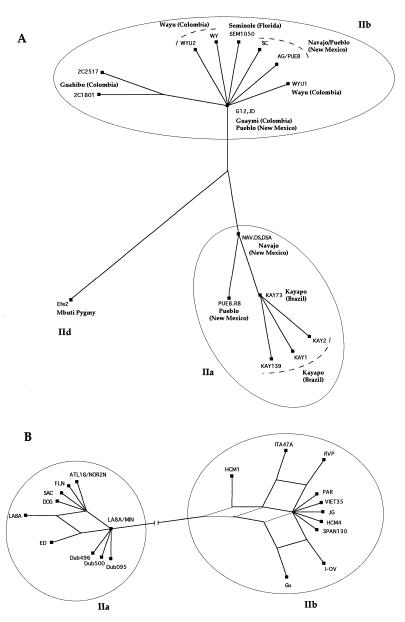
The phylogeny of human T cell lymphotropic virus type II (HTLV-II) was investigated by using strains isolated from Amerindian and Pygmy tribes, in which the virus is maintained primarily through mother-to-child transmission via breast-feeding, and strains from intravenous drug users (IDUs), in which spread is mainly blood-borne via needle sharing. Molecular clock analysis showed that HTLV-II has two different evolutionary rates with the molecular clock for the virus in IDUs ticking 150-350 times faster than the one in endemically infected tribes: 2.7 x 10(-4) compared with 1.71/7.31 x 10(-7) nucleotide substitutions per site per year in the long terminal repeat region. This dramatic acceleration of the evolutionary rate seems to be related with the mode of transmission. Mathematical models showed the correlation of these two molecular clocks with an endemic spread of HTLV-II in infected tribes compared with the epidemic spread in IDUs. We also noted a sharp increase in the population size of the virus among IDUs during the last decades probably caused by the worldwide increase in intravenous drug use.


Figures

Figure 1
Figure 1
(A) Likelihood mapping and γ-distribution of rates among sites for the 26 HTLV-II strains, aligned in the LTR region, isolated from Amerindian and Pygmy tribes. Dots in the corners represent fully resolved phylogeny, whereas dots in the center represent phylogenetic noise possibly caused by star-like evolution. To approximate a γ-distribution of nucleotide substitution rates across sites, we used a discrete γ-model with eight rate categories: the horizontal axis represents the rate category, and the vertical axis represents relative rates. The shape of the curve is determined by the parameter α, estimated (together with the relative rates) for each group of aligned sequences with the maximum likelihood method: the curve is L-shaped with α < 1, bell-shaped with α > 1. (B) Likelihood mapping and discrete γ-distribution of rates among sites for the 42 HTLV-II strains, aligned in the LTR region, isolated from IDUs.
Figure 2
Figure 2
(A) UPGMA phylogenetic tree of the 26 HTLV-II strains, in the LTR, isolated from Amerindian and Pygmy tribes. The bootstrap statistical analysis was applied by using 1,000 bootstrap samples. Percentage bootstraps for the UPGMA tree are reported (in brackets bootstrap values for the Kitch tree). The dates on the tree indicate the time suggested for the origin of the Amerindian strains (given in bold) and the estimated divergence time between the African Efe2 strain and the other HTLV-II strains. (B) UPGMA phylogenetic tree of the 42 HTLV-II strains, in the LTR, isolated from IDUs. The dates on the tree represent the estimated origin of the HTLV-IIa and HTLV-IIb epidemic in IDUs. Clades indicated with the bold line are those showing a uniform higher rate of cladogenesis with respect to the other strains in the tree (see Results).
Figure 3
Figure 3
(A) LTTP of the 26 HTLV-II strains, in the LTR, isolated from Amerindian and Pygmy tribes. The time at which each lineage division occurs on a constant-rate (UPGMA) phylogenetic tree is plotted with the time axis scaled as the number of nucleotide substitutions from the root of the tree to the tips. (B) Endemic transform of the same data. This transformation of the vertical axis determines whether the population has been constant (straight line) or linearly growing (downward curvature, as here) or declining (upward curvature) through time. (C) LTTP of the 20 HTLV-IIb strains, in the LTR, isolated from IDUs with higher than expected rate of cladogenesis (branches indicated in bold in Fig. 2). (D) Epidemic transform of the same data. This transformation of the vertical axis determines whether the rate of population growth has been constant (straight line), increasing (upward curvature), or decreasing (downward curvature) through time.
Figure 4
Figure 4
(A) SplitsTree obtained with the split-decomposition method, of 18 HTLV-II strains, in the LTR, isolated from Amerindian and Pygmy tribes. (B) SplitsTree of 20 HTLV-II strains, in the LTR, isolated from IDUs.

References

    1. Poiesz B J, Ruscetti F W, Gazdar A F, Bunn P A, Minna J A, Gallo R C. Proc Natl Acad Sci USA. 1980;77:7415–7419. - PMC - PubMed
    1. Kalyanaraman V S, Sarngadharan M G, Robert-Guroff M, Miyoshi I, Golde D, Gallo R C. Science. 1982;218:571–573. - PubMed
    1. Gessain A, Gallo R C, Franchini G. J Virol. 1992;66:2288–2295. - PMC - PubMed
    1. Yoshida M, Miyoshi V, Hinuma Y. Proc Natl Acad Sci USA. 1982;79:2031–2035. - PMC - PubMed
    1. Gessain A, Barin F, Vernant J C, Gout O, Maurs L, Calendar A, de Thé G. Lancet. 1985;ii:407–410. - PubMed

Publication types

LinkOut - more resources