. 1999 Nov 9;96(23):13270-5.
doi: 10.1073/pnas.96.23.13270.

Feedback-inducible nuclear-receptor-driven reporter gene expression in transgenic mice

Affiliations

Feedback-inducible nuclear-receptor-driven reporter gene expression in transgenic mice

A Mata De Urquiza et al. Proc Natl Acad Sci U S A. .

Abstract

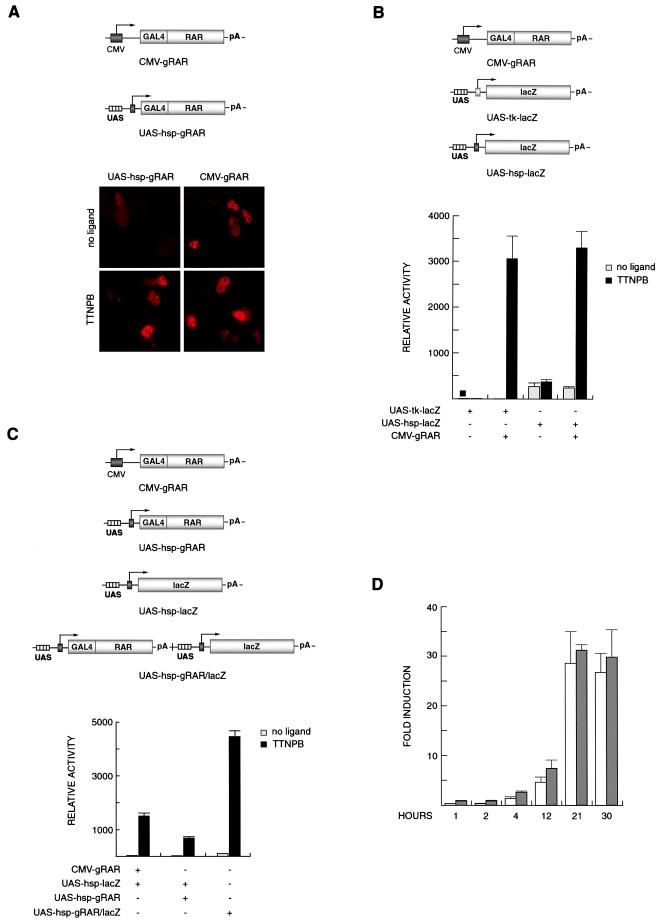
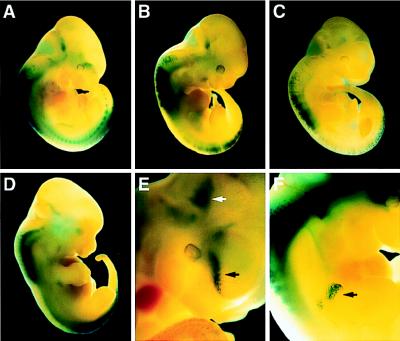
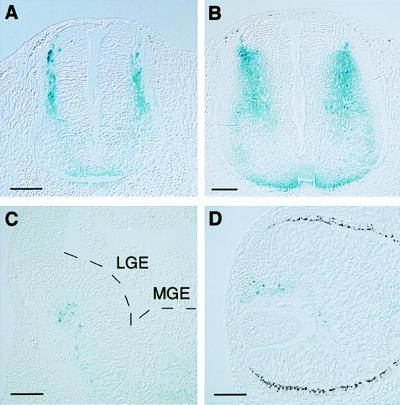
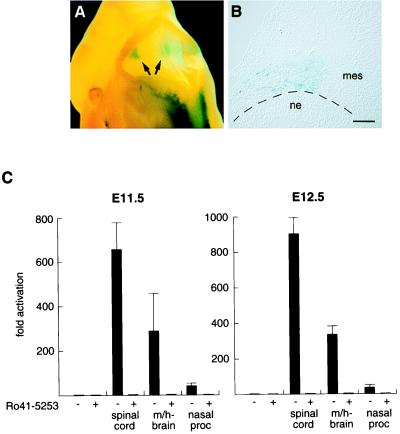
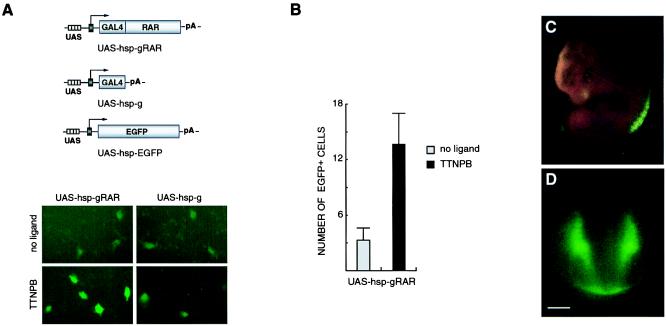
Understanding nuclear receptor signaling in vivo would be facilitated by an efficient methodology to determine where a nuclear receptor is active. Herein, we present a feedback-inducible expression system in transgenic mice to detect activated nuclear receptor effector proteins by using an inducible reporter gene. With this approach, reporter gene induction is not limited to a particular tissue, and, thus, this approach provides the opportunity for whole-animal screens. Furthermore, the effector and reporter genes are combined to generate a single strain of transgenic mice, which enables direct and rapid analysis of the offspring. The system was applied to localize sites where the retinoic acid receptor ligand-binding domain is activated in vivo. The results identify previously discovered sources of retinoids in the embryo and indicate the existence of previously undiscovered regions of retinoic acid receptor signaling in vivo. Notably, the feedback-inducible nuclear-receptor-driven assay, combined with an independent in vitro assay, provides evidence for a site of retinoid synthesis in the isthmic mesenchyme. These data illustrate the potential of feedback-inducible nuclear-receptor-driven analyses for assessing in vivo activation patterns of nuclear receptors and for analyzing pharmacological properties of natural and synthetic ligands of potential therapeutic value.


Figures

Figure 1
Figure 1
A FIND expression system. (A) Nuclear staining of JEG-3 cells transfected with indicated plasmids and analyzed for effector protein expression (GAL4-RAR) by indirect immunocytochemistry with an antibody against the GAL4 DNA-binding domain. The CMV-driven expression of GAL4-RAR is constitutively high, whereas basal expression from UAS-hsp-gRAR is low but is induced in the presence of TTNPB. (Magnification ×40.) (B) Comparison of induction with two reporter constructs driven by the minimal tk or hsp promoter. Basal levels, in the absence of TTNPB, are higher with UAS-hsp-lacZ compared with UAS-tk-lacZ, whereas the maximal activation is equal. (C) Reporter activity is up-regulated with equally efficiency by CMV-gRAR and by UAS-hsp-gRAR in the presence of TTNPB. High induction is also observed when the gRAR and lacZ genes are present on a combined effector-reporter vector (UAS-hsp-gRAR/lacZ). (D) Time-course study of autoregulated reporter induction. The induction profiles are similar when UAS-hsp-lacZ is cotransfected with CMV-gRAR (white bars) or UAS-hsp-gRAR (gray bars), reaching maximal values at 21 h after ligand addition. β-Galactosidase activities are shown as means (±SD) of triplicate values.
Figure 2
Figure 2
In vivo detection of RAR signaling. Transgenic embryos, at E11.5 (AC, E, and F) and E12.5 (D), analyzed for X-Gal-staining patterns. (AD) Staining is observed at the limb levels of the developing cord. (E) Blue-stained cells are detected in the developing forebrain (black arrow) and in a region at the midbrain/hindbrain junction (white arrow). Higher magnification of embryo shown in B. (F) The black arrow indicates staining of the proximal forelimb. (Magnifications: A–C, ×3.5; D, ×3; E and F, ×10.)
Figure 3
Figure 3
Horizontal (A and B) and coronal (C and D) sections of transgenic embryos showing blue-stained regions in the E11.5 (A) and E12.5 (B) spinal cord, the forebrain region (C), and the eye (D). (A and B) β-Galactosidase-positive cells are located in the dorsolateral half of the spinal cord. Fainter staining is also noted ventrally. (C) Blue-stained cells are mainly confined to the subventricular zone of the lateral ganglionic eminence (LGE) in the forebrain. MGE, medial ganglionic eminence. (D) In the eye, X-Gal-positive cells are present dorsally in the inner layer of the optic cup. (Bars in AC and D = 100 and 50 μm, respectively.)
Figure 4
Figure 4
Retinoid signaling in the ventral midbrain/hindbrain region. (A) Dorsal view of a X-Gal-stained transgenic E11.5 embryo expressing UAS-hsp-gRAR and UAS-hsp-lacZ; lacZ staining in the midbrain/hindbrain region is evident (arrows). (B) Coronal section of the midbrain/hindbrain region (left side). β-Galactosidase-positive cells are located in cephalic mesenchyme, adjacent to the isthmic/pontine neuroepithelium. (Bar = 100 μm.) (C) Explant experiments of E11.5 (Left) and E12.5 (Right) wild-type embryonic tissues to detect retinoid production. JEG-3 cells transfected with CMV-gRAR and UAS-tk-luc effector and reporter plasmids were incubated overnight either alone or with indicated explants in the absence (−) or presence (+) of the RAR antagonist Ro 41-5253. Luciferase induction is shown as mean fold activation (±SD) of triplicate values. ne, neuroepithelium; mes, mesenchyme; m/h-brain, midbrain/hindbrain region; nasal proc, medial and lateral nasal processes.
Figure 5
Figure 5
Feedback-induced EGFP reporter gene expression in vitro (A and B) and in vivo (C and D). (A) GFP expression is up-regulated by TTNPB treatment in cells cotransfected with UAS-hsp-EGFP and UAS-hsp-gRAR but not when the EGFP reporter plasmid is coexpressed with UAS-hsp-g, which lacks the RAR ligand-binding domain. (Magnification ×20.) (B) The number of EGFP-positive cells transfected with UAS-hsp-EGFP and UAS-hsp-gRAR is increased 4-fold in the presence of TTNPB. All cells with detectable fluorescence, irrespective of signal intensity, were rated as positive. (C) EGFP expression in a E11.5 transgenic embryo is detected at the forelimb and hindlimb levels of the spinal cord and in the dorsal aspect of the eye. (D) Transection showing fluorescence in the dorsolateral half and the ventral margin of the spinal cord. (Bar = 100 μm.)

References

    1. Solomin L, Johansson C B, Zetterström R H, Bissonnette R P, Heyman R A, Olson L, Lendahl U, Frisén J, Perlmann T. Nature (London) 1998;395:398–402. - PubMed
    1. Perlmann T, Jansson L. Genes Dev. 1995;9:769–782. - PubMed
    1. Rossant J, Zirngibl R, Cado D, Shago M, Giguère V. Genes Dev. 1991;5:1333–1344. - PubMed
    1. Okabe M, Ikawa M, Kominami K, Nakanishi T, Nishimune Y. FEBS Lett. 1997;407:313–319. - PubMed
    1. Mountford P, Zevnik B, Düwel A, Nichols J, Li M, Dani C, Robertson M, Chambers I, Smith A. Proc Natl Acad Sci USA. 1994;91:4303–4307. - PMC - PubMed

Substances

LinkOut - more resources