

Experimental hemochromatosis due to MHC class I HFE deficiency: immune status and iron metabolism
- PMID: 10557317
- PMCID: PMC23944
- DOI: 10.1073/pnas.96.23.13312
Experimental hemochromatosis due to MHC class I HFE deficiency: immune status and iron metabolism
Abstract
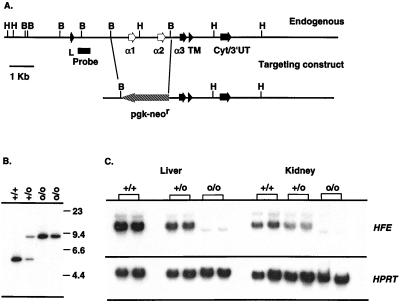
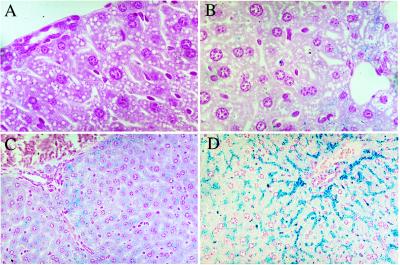
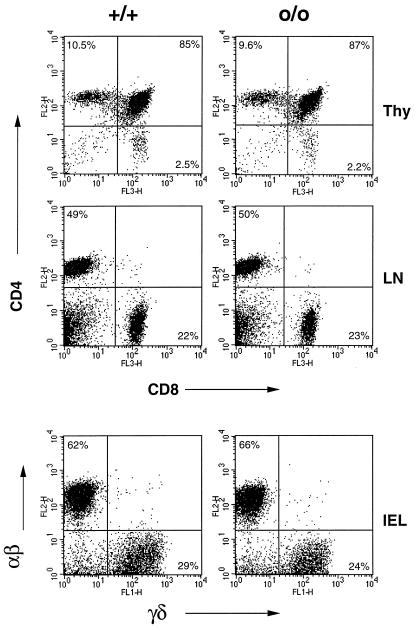
The puzzling linkage between genetic hemochromatosis and histocompatibility loci became even more so when the gene involved, HFE, was identified. Indeed, within the well defined, mainly peptide-binding, MHC class I family of molecules, HFE seems to perform an unusual yet essential function. As yet, our understanding of HFE function in iron homeostasis is only partial; an even more open question is its possible role in the immune system. To advance on both of these avenues, we report the deletion of HFE alpha1 and alpha2 putative ligand binding domains in vivo. HFE-deficient animals were analyzed for a comprehensive set of metabolic and immune parameters. Faithfully mimicking human hemochromatosis, mice homozygous for this deletion develop iron overload, characterized by a higher plasma iron content and a raised transferrin saturation as well as an elevated hepatic iron load. The primary defect could, indeed, be traced to an augmented duodenal iron absorption. In parallel, measurement of the gut mucosal iron content as well as iron regulatory proteins allows a more informed evaluation of various hypotheses regarding the precise role of HFE in iron homeostasis. Finally, an extensive phenotyping of primary and secondary lymphoid organs including the gut provides no compelling evidence for an obvious immune-linked function for HFE.
Figures
References
-
- Sheldon J H. Haemochromatosis. London: Oxford Univ. Press; 1935.
-
- Feder J N, Gnirke A, Thomas W, Tsuchihashi Z, Ruddy D A, Basava A, Dormishian F, Domingo R, Ellis M C, Fullan A, et al. Nat Genet. 1996;13:399–408. - PubMed
-
- Feder J N, Tsuchihashi Z, Irrinki A, Lee V K, Mapa F A, Morikang E, Prass C E, Starnes S M, Wolff R K, Parkkila S, et al. J Biol Chem. 1997;272:14025–14028. - PubMed
-
- Riegert P, Gilfillan S, Nanda I, Schmid M, Bahram S. Immunogenetics. 1998;47:174–177. - PubMed
Publication types
MeSH terms
Substances
LinkOut - more resources
Full Text Sources
Other Literature Sources
Medical
Molecular Biology Databases
Research Materials
