Continuous and lurching traveling pulses in neuronal networks with delay and spatially decaying connectivity
- PMID: 10557346
- PMCID: PMC23973
- DOI: 10.1073/pnas.96.23.13480
Continuous and lurching traveling pulses in neuronal networks with delay and spatially decaying connectivity
Abstract
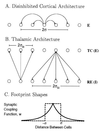
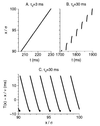
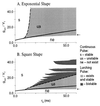
Propagation of discharges in cortical and thalamic systems, which is used as a probe for examining network circuitry, is studied by constructing a one-dimensional model of integrate-and-fire neurons that are coupled by excitatory synapses with delay. Each neuron fires only one spike. The velocity and stability of propagating continuous pulses are calculated analytically. Above a certain critical value of the constant delay, these pulses lose stability. Instead, lurching pulses propagate with discontinuous and periodic spatio-temporal characteristics. The parameter regime for which lurching occurs is strongly affected by the footprint (connectivity) shape; bistability may occur with a square footprint shape but not with an exponential footprint shape. For strong synaptic coupling, the velocity of both continuous and lurching pulses increases logarithmically with the synaptic coupling strength g(syn) for an exponential footprint shape, and it is bounded for a step footprint shape. We conclude that the differences in velocity and shape between the front of thalamic spindle waves in vitro and cortical paroxysmal discharges stem from their different effective delay; in thalamic networks, large effective delay between inhibitory neurons arises from their effective interaction via the excitatory cells which display postinhibitory rebound.
Figures


Similar articles
-
Effects of delay on the type and velocity of travelling pulses in neuronal networks with spatially decaying connectivity.Network. 2000 Aug;11(3):221-46. Network. 2000. PMID: 11014670
-
Propagation of spindle waves in a thalamic slice model.J Neurophysiol. 1996 Feb;75(2):750-69. doi: 10.1152/jn.1996.75.2.750. J Neurophysiol. 1996. PMID: 8714650
-
Bistability in pulse propagation in networks of excitatory and inhibitory populations.Phys Rev Lett. 2001 Apr 30;86(18):4179-82. doi: 10.1103/PhysRevLett.86.4179. Phys Rev Lett. 2001. PMID: 11328125
-
Connexon connexions in the thalamocortical system.Prog Brain Res. 2005;149:41-57. doi: 10.1016/S0079-6123(05)49004-4. Prog Brain Res. 2005. PMID: 16226575 Review.
-
Propagation delays determine neuronal activity and synaptic connectivity patterns emerging in plastic neuronal networks.Chaos. 2018 Oct;28(10):106308. doi: 10.1063/1.5037309. Chaos. 2018. PMID: 30384625 Review.
Cited by
-
An in vitro method to manipulate the direction and functional strength between neural populations.Front Neural Circuits. 2015 Jul 14;9:32. doi: 10.3389/fncir.2015.00032. eCollection 2015. Front Neural Circuits. 2015. PMID: 26236198 Free PMC article. Review.
-
Rich dynamics and functional organization on topographically designed neuronal networks in vitro.iScience. 2022 Nov 26;25(12):105680. doi: 10.1016/j.isci.2022.105680. eCollection 2022 Dec 22. iScience. 2022. PMID: 36567712 Free PMC article.
-
An integrate-and-fire model for synchronized bursting in a network of cultured cortical neurons.J Comput Neurosci. 2006 Dec;21(3):227-41. doi: 10.1007/s10827-006-7815-5. Epub 2006 Aug 31. J Comput Neurosci. 2006. PMID: 16951925
-
Analyzing Neuronal Networks Using Discrete-Time Dynamics.Physica D. 2010 May 1;239(9):515-528. doi: 10.1016/j.physd.2009.12.011. Physica D. 2010. PMID: 20454529 Free PMC article.
-
Feed-Forward Propagation of Temporal and Rate Information between Cortical Populations during Coherent Activation in Engineered In Vitro Networks.Front Neural Circuits. 2016 Apr 22;10:32. doi: 10.3389/fncir.2016.00032. eCollection 2016. Front Neural Circuits. 2016. PMID: 27147977 Free PMC article.
References
-
- Gutnick M J, Connors B W, Prince D A. J Neurophysiol. 1982;48:1321–1335. - PubMed
-
- Connors B W. Nature (London) 1984;310:685–687. - PubMed
-
- Golomb D, Amitai Y. J Neurophysiol. 1997;78:1199–1211. - PubMed
-
- Tsau Y, Guan L, Wu J-Y. J Neurophysiol. 1998;80:978–982. - PubMed
-
- Golomb D. J Neurophysiol. 1998;79:1–12. - PubMed
Publication types
MeSH terms
LinkOut - more resources
Full Text Sources
Miscellaneous

