Comparative Study
. 1999 Nov 9;96(23):13554-9.
doi: 10.1073/pnas.96.23.13554.

Stimulation of the blue light phototropic receptor NPH1 causes a transient increase in cytosolic Ca2+

Affiliations
Comparative Study

Stimulation of the blue light phototropic receptor NPH1 causes a transient increase in cytosolic Ca2+

G Baum et al. Proc Natl Acad Sci U S A. .

Abstract

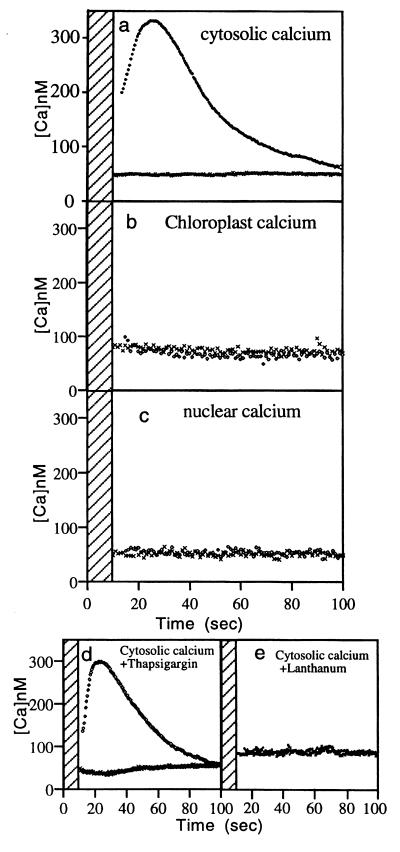
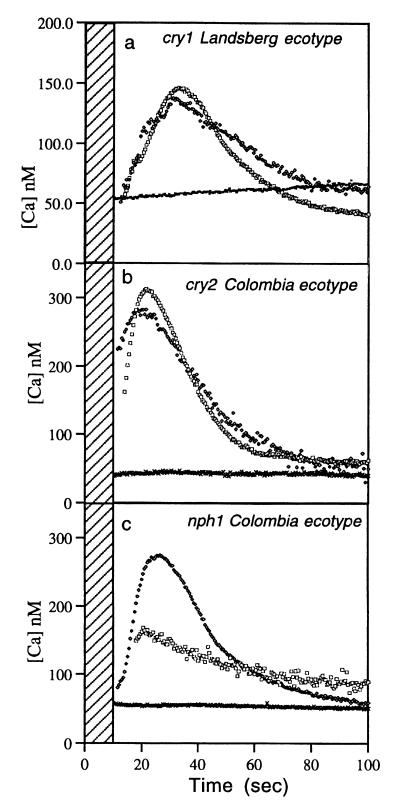
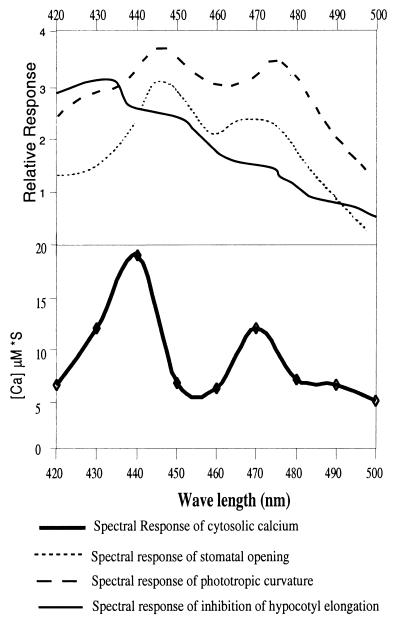
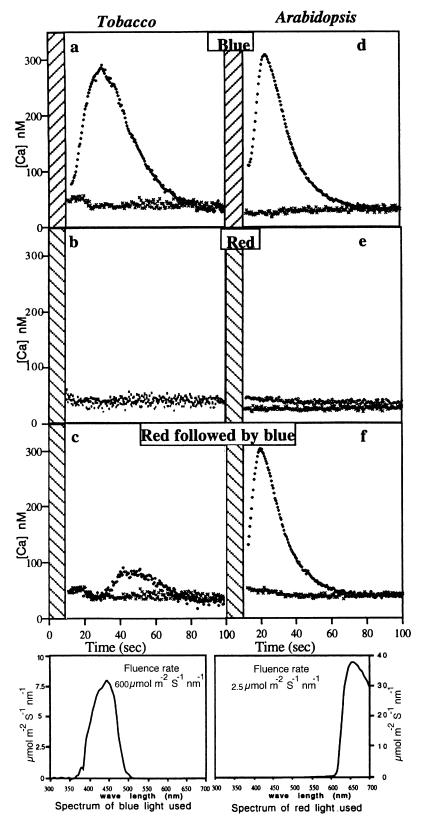
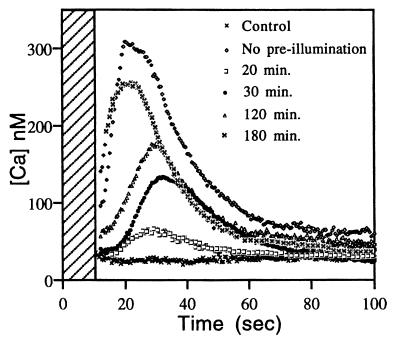
Blue light regulates plant growth and development, and three photoreceptors, CRY1, CRY2, and NPH1, have been identified. The transduction pathways of these receptors are poorly understood. Transgenic plants containing aequorin have been used to dissect the involvement of these three receptors in the regulation of intracellular Ca2+. Pulses of blue light induce cytosolic Ca2+ transients lasting about 80 s in Arabidopsis and tobacco seedlings. Use of organelle-targeted aequorins shows that Ca2+ increases are limited to the cytoplasm. Blue light treatment of cry1, cry2, and nph1 mutants showed that NPH1, which regulates phototropism, is largely responsible for the Ca2+ transient. The spectral response of the Ca2+ transient is similar to that of phototropism, supporting NPH1 involvement. Furthermore, known interactions between red and blue light and between successive blue light pulses on phototropic sensitivity are mirrored in the blue light control of cytosolic Ca2+ in these seedlings. Our observations raise the possibility that physiological responses regulated by NPH1, such as phototropism, may be transduced through cytosolic Ca2+.


Figures

Figure 1
Figure 1
B-induced changes in cytosolic, chloroplast, and nuclear Ca2+. All seedling batches were exposed to 10 s of B, and chemiluminescence was allowed to decay before [Ca2+]c measurement commenced. (a) The averaged transient of [Ca2+]c from 50 A. thaliana measurements and 50 N. plumbaginifolia measurements. Luminescence was measured every 0.2 s for over 3 min, and each point was converted to [Ca2+]c before averaging. (b and c) N. plumbaginifolia expressing aeq in the chloroplast (n = 20; b) and in the nucleus (n = 20; c). (e and d) The effect of 200 μM thapsigargin (d) and 3 mM lanthanum chloride (e) on the cytosolic response in Arabidopsis. ⋄, light-treated; ×, dark control (the same plants before stimulation).
Figure 2
Figure 2
B-induced changes in [Ca2+]c in Arabidopsis photoreceptor mutants. cry1, cry2, and nph1 mutants expressing aeq were illuminated with B for 10 s, and [Ca2+]c was measured as described in the legend to Fig. 1. The hy4 mutant and the control wild type used in this experiment are of the Landsberg ecotype. All other Arabidopsis plants used were of the Colombia ecotype. n = 10 in both panels; ▫, mutants; ⧫, wild type; ×, control (unstimulated mutant).
Figure 3
Figure 3
Spectral response of B-induced [Ca2+]c. Arabidopsis seedlings were illuminated with a monochromator (described in Materials and Methods) with the slit set to a 20-nm opening. The response was measured at 10-nm steps. The illumination time was calculated to give the same fluence of light at each wavelength (65 mmol⋅m−2) and changed accordingly from 9.5 to 16 s across the visible spectrum. After the illumination, [Ca2+]c was measured, and the total increase in Ca2+ ([Ca] μM *S, where *S = seconds) was calculated by subtracting the resting Ca2+ levels from each measurement and integrating the area under the transient (n = 2). The spectral responses of stomatal opening (25), phototropic curvature (26), and inhibition of hypocotyl elongation by high energy illumination (24) were redrawn for comparison.
Figure 4
Figure 4
Interaction between B and R in inducing a [Ca2+]c in N. plumbaginifolia (a–c) and A. thaliana (d–f). Averaged [Ca2+]c transients (n = 10) are shown in response to 10 s of B (a and d), 10 s of R (b and e), and 10 s of B given 5 min after 10 s of R (c and f). ♦, light-treated; ×, dark control (average of all the plants before stimulation). (Bottom) The spectra of the light sources.
Figure 5
Figure 5
Desensitization and recovery of B-induced [Ca2+]c response. Arabidopsis seedlings were illuminated with B for 10 s at time zero. The seedlings were then irradiated again with 10 s of B after 20, 30, 120, and 180 min, and the [Ca2+]c was recorded. The response to the second illumination is shown. ×, dark control.

References

    1. Ahmad M, Cashmore A R. Nature (London) 1993;366:162–166. - PubMed
    1. Ahmad M, Lin C T, Cashmore A R. Plant J. 1995;8:653–658. - PubMed
    1. Jackson J A, Jenkins G I. Planta. 1995;197:233–239. - PubMed
    1. Lin C T, Robertson D E, Ahmad M, Raibekas A A, Jorns M S, Dutton P L, Cashmore A R. Science. 1995;269:968–970. - PubMed
    1. Malhotra K, Kim S-T, Batschauer A, Dawut L, Sancar A. Biochemistry. 1995;34:6892–6899. - PubMed

Publication types

MeSH terms

LinkOut - more resources