. 1999 Nov;181(22):6865-75.
doi: 10.1128/JB.181.22.6865-6875.1999.

Thickness and elasticity of gram-negative murein sacculi measured by atomic force microscopy

Affiliations
Free PMC article

Thickness and elasticity of gram-negative murein sacculi measured by atomic force microscopy

X Yao et al. J Bacteriol. 1999 Nov.
Free PMC article

Abstract

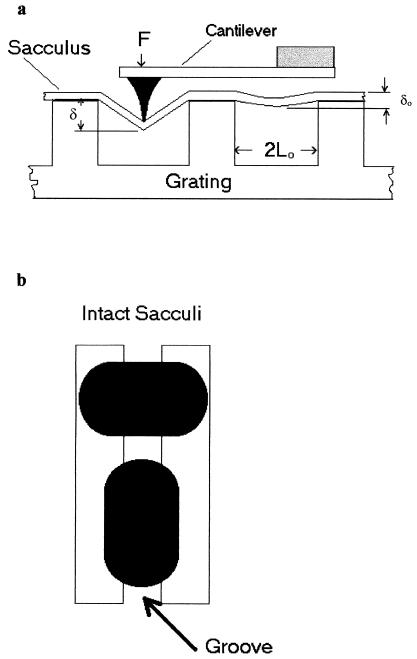
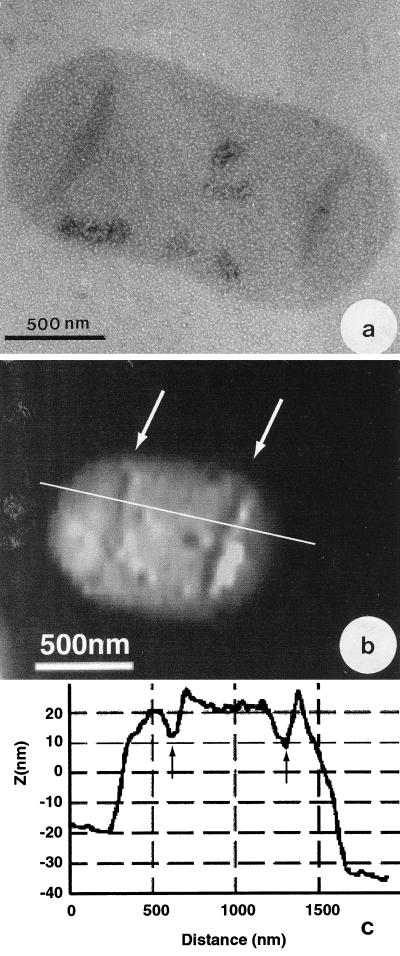
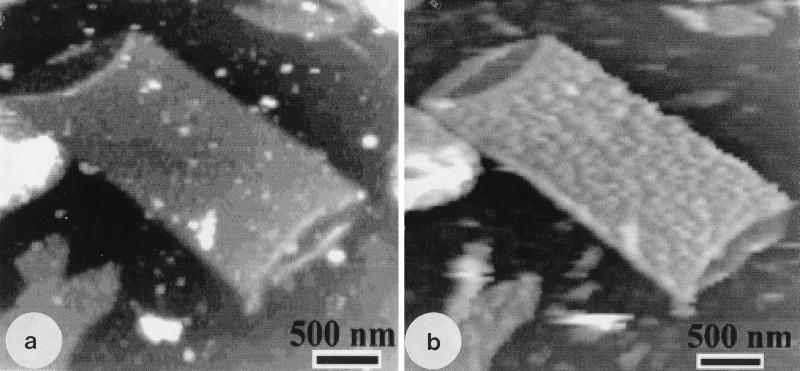
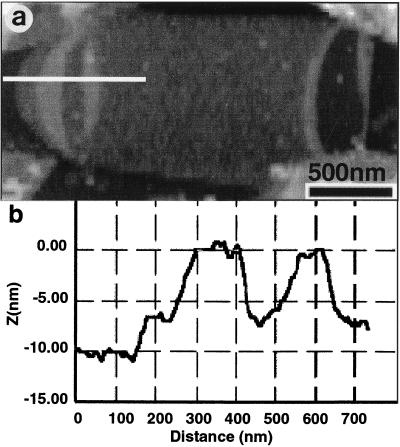
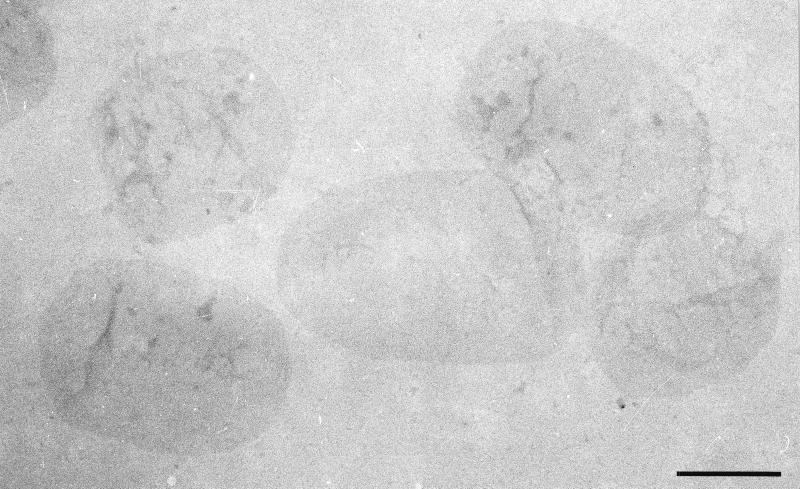
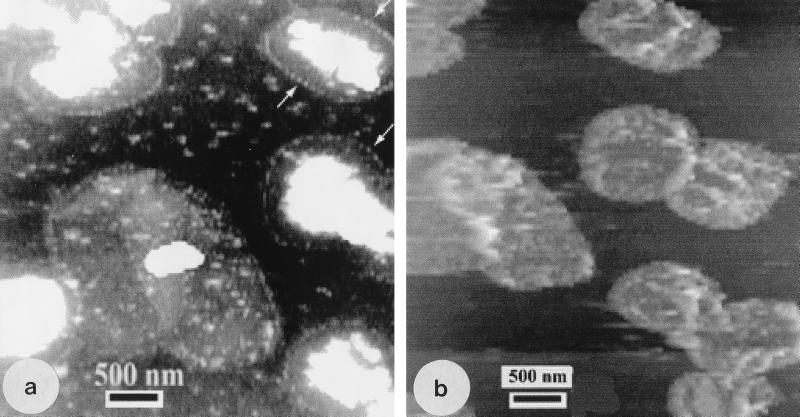
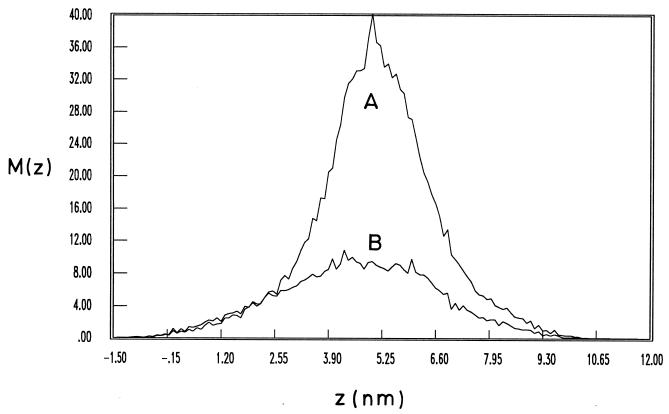
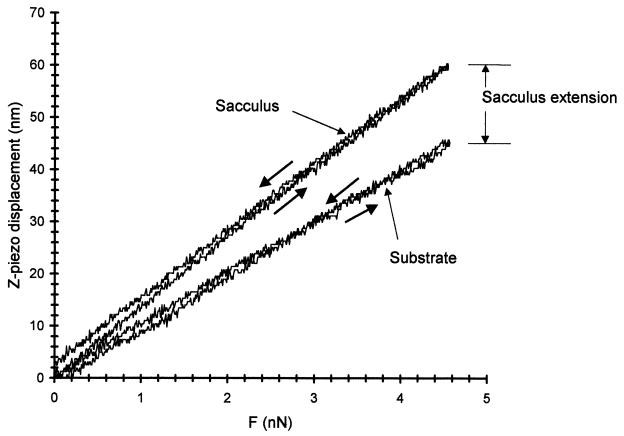
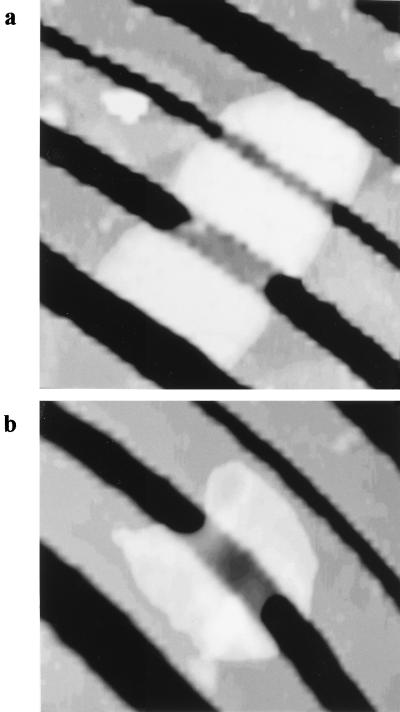
Atomic force microscopy was used to measure the thickness of air-dried, collapsed murein sacculi from Escherichia coli K-12 and Pseudomonas aeruginosa PAO1. Air-dried sacculi from E. coli had a thickness of 3.0 nm, whereas those from P. aeruginosa were 1.5 nm thick. When rehydrated, the sacculi of both bacteria swelled to double their anhydrous thickness. Computer simulation of a section of a model single-layer peptidoglycan network in an aqueous solution with a Debye shielding length of 0.3 nm gave a mass distribution full width at half height of 2.4 nm, in essential agreement with these results. When E. coli sacculi were suspended over a narrow groove that had been etched into a silicon surface and the tip of the atomic force microscope used to depress and stretch the peptidoglycan, an elastic modulus of 2.5 x 10(7) N/m(2) was determined for hydrated sacculi; they were perfectly elastic, springing back to their original position when the tip was removed. Dried sacculi were more rigid with a modulus of 3 x 10(8) to 4 x 10(8) N/m(2) and at times could be broken by the atomic force microscope tip. Sacculi aligned over the groove with their long axis at right angles to the channel axis were more deformable than those with their long axis parallel to the groove axis, as would be expected if the peptidoglycan strands in the sacculus were oriented at right angles to the long cell axis of this gram-negative rod. Polar caps were not found to be more rigid structures but collapsed to the same thickness as the cylindrical portions of the sacculi. The elasticity of intact E. coli sacculi is such that, if the peptidoglycan strands are aligned in unison, the interstrand spacing should increase by 12% with every 1 atm increase in (turgor) pressure. Assuming an unstressed hydrated interstrand spacing of 1.3 nm (R. E. Burge, A. G. Fowler, and D. A. Reaveley, J. Mol. Biol. 117:927-953, 1977) and an internal turgor pressure of 3 to 5 atm (or 304 to 507 kPa) (A. L. Koch, Adv. Microbial Physiol. 24:301-366, 1983), the natural interstrand spacing in cells would be 1.6 to 2.0 nm. Clearly, if large macromolecules of a diameter greater than these spacings are secreted through this layer, the local ordering of the peptidoglycan must somehow be disrupted.


Figures

FIG. 1
FIG. 1
(a) Diagram (as viewed from the side of our AFM stage) to show the placement of a peptidoglycan sacculus over grooves which have been etched in the silicon surface as the AFM tip begins to displace the sacculus by the tip’s downward motion. For scale, a single groove is ∼300 nm deep. (b) Diagram to show the grating from above and how the sacculi were aligned for elasticity measurements and determination of anisotropy.
FIG. 2
FIG. 2
(a) Negative TEM image of an E. coli sacculus. (b) AFM image of a DNase-RNase-chymotrypsin-treated E. coli sacculus which has been air dried. (c) Single scan line from the image in panel b showing the cross-sectional dimensions of the sacculus. The scan line is shown on the image in panel b as a straight white line. In panels a and b, notice how folds have occurred in the sacculus close to where the hemispherical caps (poles) are attached (arrows). These are the lowest regions seen in the cross section in panel c. The sacculus in panel b is thick because of contaminating cytoplasmic material.
FIG. 3
FIG. 3
(a) AFM image of a cylindrical portion of an air-dried E. coli sacculus obtained by sonication. Small portions of the inner face of the sacculus can be seen at each end of the cylinder, and these and the outer face seem relatively smooth and flat. (b) The same sacculus seen after rehydration. The inner face still seems relatively smooth, but the outer face now has a rough texture. The amorphous particles that make up this roughness are more or less aligned along the long cell axis.
FIG. 4
FIG. 4
AFM image of an air-dried E. coli pole (a) and its corresponding cross-sectional profile derived from a single scan line (b) (see white line in panel a). The folds can clearly be seen close to the hemispherical cap.
FIG. 5
FIG. 5
TEM image of a number of negatively stained sacculi from P. aeruginosa. Notice that they are smaller and not as long as the sacculi from E. coli. Scale bar = 500 nm.
FIG. 6
FIG. 6
AFM images of P. aeruginosa sacculi. (a) Air-dried sample showing the regular structure at the edges of the sacculi (arrows) and the external contaminating debris (large white particles) that could be removed by the AFM tip. (b) Hydrated sample close to the same region as seen in panel a. Now the sacculi show a rough texture on their outer face.
FIG. 7
FIG. 7
Mass distribution [M(z)] of a portion of a single model peptidoglycan network projected onto the z axis, as a function of z, the coordinate perpendicular to the initial plane of the network. The Debye shielding length (K−1) is 0.3 nm. Line A shows the mass distribution of the total network. Line B shows the mass distribution of the pentapeptide chains only.
FIG. 8
FIG. 8
z-piezo displacement as a function of the force (F) applied by the tip to the suspended sacculus. Curves for increasing and decreasing force (arrows) show that the sacculus response is nearly elastic. The difference between the piezo displacement on the substrate and on the sacculus is a measure of the sacculus depression into the groove and is used in the calculation of the elastic modulus of the sacculi.
FIG. 9
FIG. 9
AFM images of E. coli sacculi placed over the grooves in the silicon grating. (a) Sacculus oriented perpendicular to the grooves. (b) Sacculus oriented parallel to the grooves. The groove bridged by the sacculus in panel b and the corresponding groove in panel a are 300 nm wide.

References

    1. Barnickel G, Naumann D, Bradczek H, Labischinski H, Giesbrecht P. Computer aided molecular modeling of the three-dimensional structure of bacterial peptidoglycan. In: Hakenbeck R, Höltje J-V, Labischinski H, editors. The target of penicillin. Berlin, Germany: Walter de Gruyter & Co.; 1983. pp. 61–66.
    1. Bayer M E. Zones of membrane adhesion in the cryofixed envelope of Escherichia coli. J Struct Biol. 1991;197:268–280. - PubMed
    1. Beveridge T J. The periplasmic space and the concept of the periplasm in gram-positive and gram-negative bacteria. ASM News. 1995;61:125–130.
    1. Beveridge T J. Ultrastructure, chemistry, and function of the bacterial wall. Int Rev Cytol. 1981;72:229–317. - PubMed
    1. Beveridge T J, Graham L L. Surface layers of bacteria. Microbiol Rev. 1991;55:684–705. - PMC - PubMed

Publication types

MeSH terms