. 1999 Dec;73(12):10489-502.
doi: 10.1128/JVI.73.12.10489-10502.1999.

Consistent viral evolutionary changes associated with the progression of human immunodeficiency virus type 1 infection

Affiliations

Consistent viral evolutionary changes associated with the progression of human immunodeficiency virus type 1 infection

R Shankarappa et al. J Virol. 1999 Dec.

Abstract

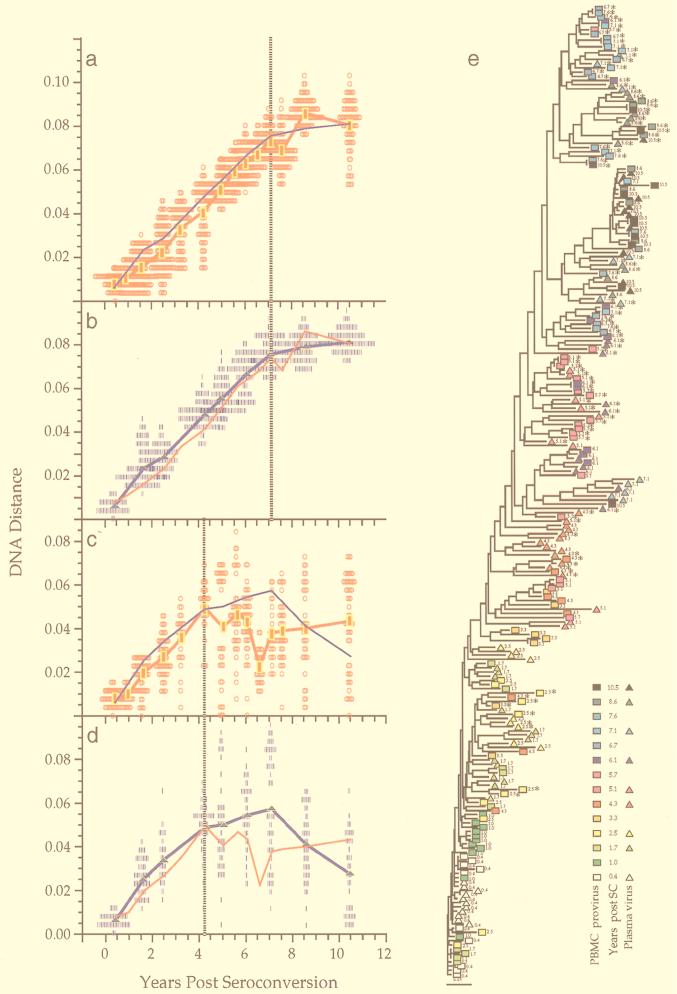
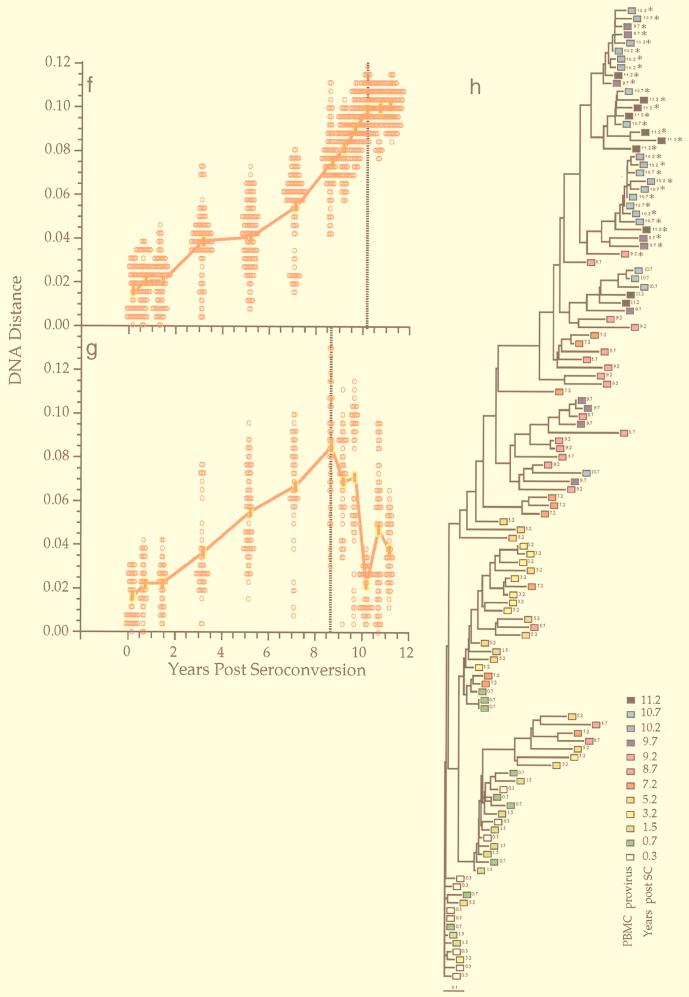
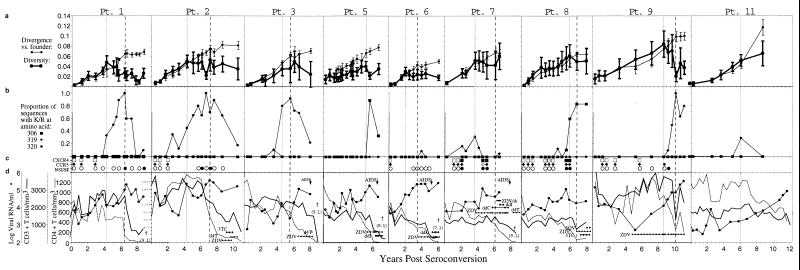
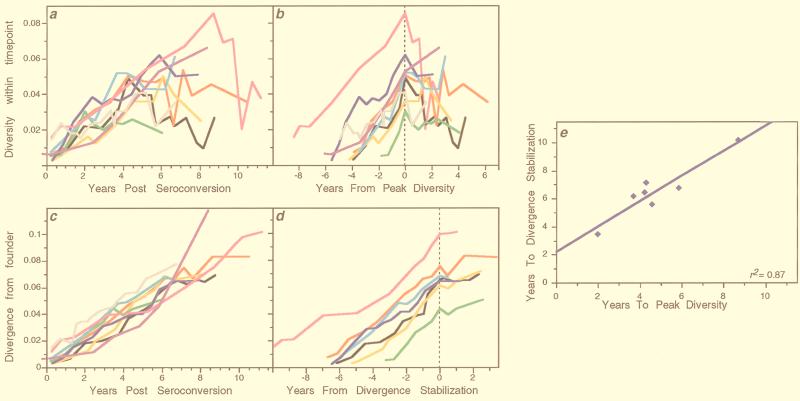
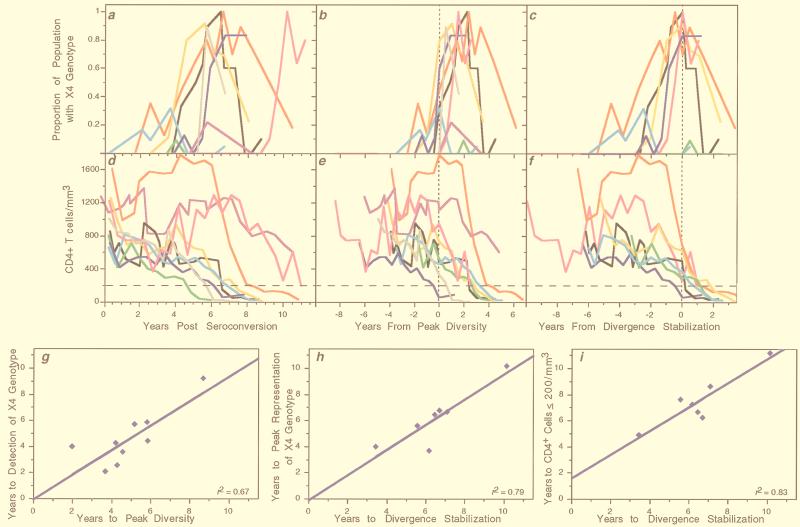
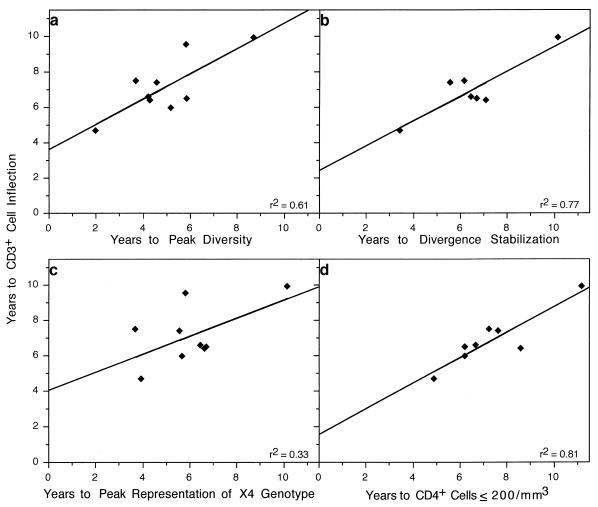
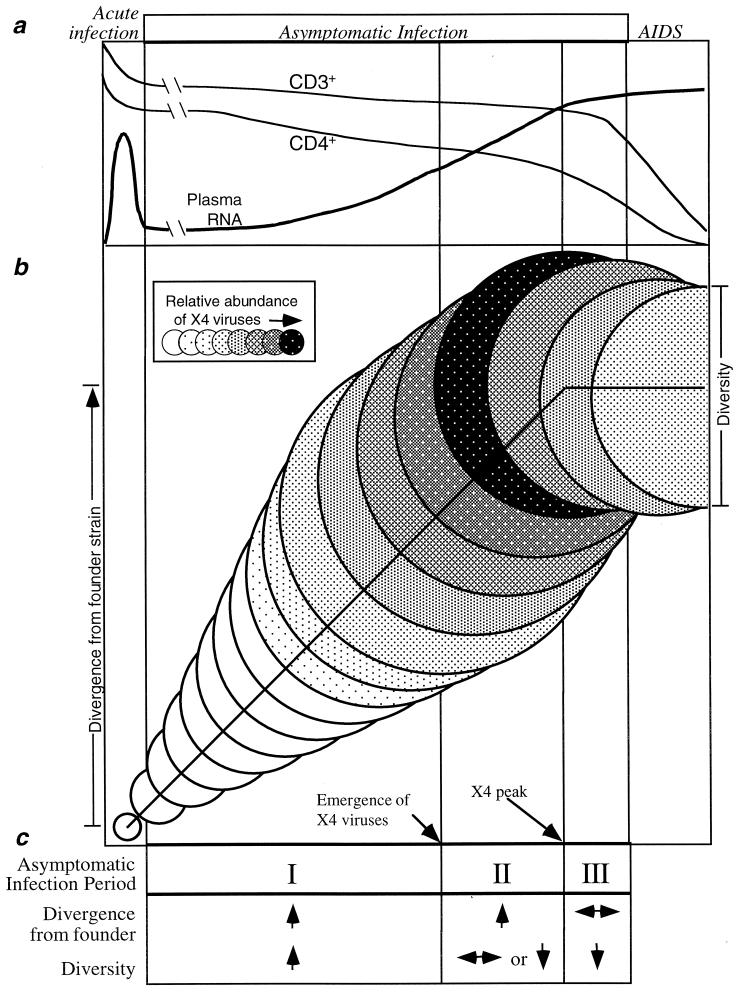
To understand the high variability of the asymptomatic interval between primary human immunodeficiency virus type 1 (HIV-1) infection and the development of AIDS, we studied the evolution of the C2-V5 region of the HIV-1 env gene and of T-cell subsets in nine men with a moderate or slow rate of disease progression. They were monitored from the time of seroconversion for a period of 6 to 12 years until the development of advanced disease in seven men. Based on the analysis of viral divergence from the founder strain, viral population diversity within sequential time points, and the outgrowth of viruses capable of utilizing the CXCR4 receptor (X4 viruses), the existence of three distinct phases within the asymptomatic interval is suggested: an early phase of variable duration during which linear increases ( approximately 1% per year) in both divergence and diversity were observed; an intermediate phase lasting an average of 1.8 years, characterized by a continued increase in divergence but with stabilization or decline in diversity; and a late phase characterized by a slowdown or stabilization of divergence and continued stability or decline in diversity. X4 variants emerged around the time of the early- to intermediate-phase transition and then achieved peak representation and began a decline around the transition between the intermediate and late phases. The late-phase transition was also associated with failure of T-cell homeostasis (defined by a downward inflection in CD3(+) T cells) and decline of CD4(+) T cells to </=200 cells/microliter. The strength of these temporal associations between viral divergence and diversity, viral coreceptor specificity, and T-cell homeostasis and subset composition supports the concept that the phases described represent a consistent pattern of viral evolution during the course of HIV-1 infection in moderate progressors. Recognition of this pattern may help explain previous conflicting data on the relationship between viral evolution and disease progression and may provide a useful framework for evaluating immune damage and recovery in untreated and treated HIV-1 infections.


Figures

FIG. 1
FIG. 1
Viral population analyses for participants 2 and 9. Analyses of sequences from participant 2 (a to e) and participant 9 (f to h) are shown. Genetic distances between all possible pairs of nucleotide sequences for viral DNA in PBMC (a, c, f, and g) and viral RNA in plasma populations (b and d) are shown (means at each time point indicated by symbols connected by thick lines) as a function of time since seroconversion. Parallel estimates with sequences sampled from plasma are shown with a thin blue line (a and c) and those from PBMC as a thin red line (b and d). Divergence from the founder strain (i.e., the first virus-positive time point; see Materials and Methods) is shown (a, b, and f). Viral population diversity (i.e., distances between all pairs of sequences within each time point; see Materials and Methods) is shown (c, d, and g). Dotted vertical lines correspond to a peak or a slowdown in the rate of change of each measure. Neighbor-joining phylograms (e and h) are shown for participants 2 and 9, respectively, derived from maximum-likelihood distances between all the sequences in each patient with PHYLIP (20). Sequences are represented by a square for PBMC sequences or a triangle for plasma sequences, with an arbitrary color gradient corresponding to the time of sampling following seroconversion, as indicated in the key. An asterisk (∗) indicates sequences with a basic amino acid substitution in the V3 loop specifying the X4 genotype.
FIG. 1
FIG. 1
Viral population analyses for participants 2 and 9. Analyses of sequences from participant 2 (a to e) and participant 9 (f to h) are shown. Genetic distances between all possible pairs of nucleotide sequences for viral DNA in PBMC (a, c, f, and g) and viral RNA in plasma populations (b and d) are shown (means at each time point indicated by symbols connected by thick lines) as a function of time since seroconversion. Parallel estimates with sequences sampled from plasma are shown with a thin blue line (a and c) and those from PBMC as a thin red line (b and d). Divergence from the founder strain (i.e., the first virus-positive time point; see Materials and Methods) is shown (a, b, and f). Viral population diversity (i.e., distances between all pairs of sequences within each time point; see Materials and Methods) is shown (c, d, and g). Dotted vertical lines correspond to a peak or a slowdown in the rate of change of each measure. Neighbor-joining phylograms (e and h) are shown for participants 2 and 9, respectively, derived from maximum-likelihood distances between all the sequences in each patient with PHYLIP (20). Sequences are represented by a square for PBMC sequences or a triangle for plasma sequences, with an arbitrary color gradient corresponding to the time of sampling following seroconversion, as indicated in the key. An asterisk (∗) indicates sequences with a basic amino acid substitution in the V3 loop specifying the X4 genotype.
FIG. 2
FIG. 2
Summary of sequences, viral phenotypes, and T-cell measures. Participant identifiers above each panel are from a previous study (65); participants 4 and 10 were excluded from the current study due to a lack of available specimens. The horizontal axis of each panel indicates the time relative to seroconversion. (a) Genetic distances of the combined population of viral DNA and RNA sequences relative to the founder strain (divergence, thin lines) and within individual time points (diversity, thick lines). The left (dotted) vertical line for each participant (and the single dotted line for participants 5 and 11) indicates the time of peak viral diversity, at which a significant stabilization or decrease in the slope of population diversity growth was observed as defined in the text. The final time point from participant 7 had an increase in overall viral diversity due to the appearance of unique divergent virus populations in the plasma versus the those in the PBMCs, although these populations taken individually had much lower levels of diversity (see appendix at reference 71a). The right (dashed) vertical line for each participant (except participants 5 and 11) indicates the time at which the divergence from the founder strain began to slow down or stabilize (divergence stabilization). (b) Viral genotype analysis. Each panel shows the proportions of deduced amino acid sequences containing mutations predictive of the X4 phenotype, based on encoding a basic amino acid (lysine or arginine, indicated by K/R in the figure) at residues 306, 319, or 320 within the envelope glycoprotein. For participant 7, mutations at both position 319 and position 320 (open symbol) were found at one time point. (c) Viral phenotype and coreceptor usage analysis. Data taken from Rinaldo et al. (65). The squares indicate CXCR4 coreceptor usage, and the diamonds indicate CCR5 coreceptor usage by virus isolates derived from the indicated time points. Open symbols indicate no growth, and filled symbols indicate growth on cells expressing the specified coreceptor plus CD4 (see Materials and Methods). The filled circles indicate syncytium formation (SI phenotype), and the open circles indicate a lack of syncytium formation (NSI phenotype) when the virus isolates were added to MT-2 cells. (d) Clinical progression. Data was taken from Rinaldo et al. (65). CD4+ T-cell levels are shown with a dotted line. Patient 2 had exceptionally high CD4+ T-cell levels early in infection which are plotted with a different scale as indicated in the panel. CD3+ T-cell numbers are shown with the thick line, whereas plasma RNA levels are shown with the filled circles connected by a thin line. Antiretroviral treatment, AIDS diagnosis by development of opportunistic infections (AIDS), and survival time are also indicated. Participants’ visits, at which time the antiretroviral drugs were prescribed, are indicated (ZDV, zidovudine; d4T, stavudine; 3TC, lamivudine; ddI, didanosine; SQV, saquinavir). Five participants died after the period of analysis shown, and this time (in years) is indicated in parentheses below the dagger (†).
FIG. 3
FIG. 3
Trends of viral diversification across individuals. Data from the nine participants shown in Fig. 2 are replotted to show the similarities of viral population intra-time-point diversity (a and b) and divergence from founder strains (c and d) across individuals. Participant 1 is shown with a black line, 2 with red, 3 with orange, 5 with gray, 6 with green, 7 with cyan, 8 with blue, 9 with magenta, and 11 with purple. (a and b) Viral population intra-time-point diversity plotted relative to the time of seroconversion (a) or the time of peak or stabilization of diversity (vertical dotted lines) (b). (c) For each participant, all of the sequences from the first virus-positive visit (the founder strain) were compared to all sequences sampled at each subsequent time point. Similar slopes were also generated when mean values at each time point were used to calculate a combined slope (data not shown). (d) Viral population divergence from the founder strain as shown in panel c but plotted relative to the estimated time of divergence stabilization (vertical dotted line). Participants 5 and 11, who had no evident stabilization, are omitted. (e) Relationship between the times from seroconversion to peak viral diversity and to divergence stabilization.
FIG. 4
FIG. 4
Trends of X4 genotype representation and CD4+ T-cell numbers across individuals. Data from all nine participants shown in Fig. 2 are replotted with the proportion of the virus population with an X4 genotype (a to c) or levels of circulating CD4+ T cells (d to f), relative to the time of seroconversion (a and d), time of peak viral population diversity (b and e), and time of divergence stabilization (c and f). Participant color-coding is the same as described in the legend to Fig. 3. The dotted vertical lines indicate the times of peak diversity (b and e) or divergence stabilization (c and f). The horizontal line across the lower panels indicates a CD4+ lymphocyte level of 200 cells/μl. (g to i) Relationships between the times from seroconversion to the times of the indicated viral population events. Slope = 0.94 ± 0.25 (g), 0.96 ± 0.22 (h), and 0.91 ± 0.19 (i).
FIG. 5
FIG. 5
Relationships between times from seroconversion to CD3+ T-cell inflection and times to viral evolutionary changes and CD4+ T-cell numbers. The time of the CD3+ cell inflection point is plotted relative to the time of peak viral diversity, slope = 0.71 ± 0.22 (a); divergence stabilization, slope = 0.70 ± 0.17 (b); peak representation of X4 viral genotypes, slope = 0.51 ± 0.28 (C); and transition of the CD4+ T-cell levels to ≤200/μl, slope = 0.72 ± 0.14 (d).
FIG. 6
FIG. 6
Schematic illustration of proposed consistent patterns in development of HIV disease in moderate progressors. (a) Clinical phases of HIV infection as well as typical patterns of CD4+ and CD3+ T cells and plasma viral RNA loads. The initial transient increase in viral RNA is estimated from the literature, whereas the later RNA increase and the CD3+ and CD4+ T-cell declines are based on the data from this study and that of Rinaldo et al. (65). (b) Patterns of viral sequence evolution within the asymptomatic period of infection identified in this study. Circle diameters represent the mean viral population diversities at increasing intervals following seroconversion. Vertical displacement of the circles represents the extent of viral population divergence from the founder strain. Shading represents the proportion of the viral population comprised of viruses with an X4 genotype. Dotted vertical lines represent (from left) the end of acute infection, peak viral diversity, stabilization of divergence from the founder strain, and the development of AIDS. (c) Characteristic changes in viral evolution in the three periods of the asymptomatic phase identified in this study (↑, increasing; ↓, decreasing; ↔, stable).

Similar articles

Cited by

References

    1. Autran B, Carcelain G, Li T S, Blanc C, Mathez D, Tubiana R, Katlama C, Debré P, Leibowitch J. Positive effects of combined antiretroviral therapy on CD4+ T cell homeostasis and function in advanced HIV disease. Science. 1997;277:112–116. - PubMed
    1. Bagnarelli P, Mazzola F, Menzo S, Montroni M, Butini L, Clementi M. Host-specific modulation of the selective constraints driving human immunodeficiency virus type 1 env gene evolution. J Virol. 1999;73:3764–3777. - PMC - PubMed
    1. Berger E, Doms R, Fenyo E, Korber B, Littman D, Moore J, Sattentau Q, Schuitemaker H, Sodroski J, Weiss R. A new classification for HIV-1. Nature. 1998;391:240. - PubMed
    1. Berger E A. HIV entry and tropism: the chemokine receptor connection. AIDS. 1997;11(Suppl. A):S3–S16. - PubMed
    1. Berkowitz R D, Alexander S, Bare C, Linquist-Steppes V, Bogan M, Moreno M E, Gibson L, Wieder E, Kosek J, Stoddart C, McCune J M. CCR5- and CXCR4-utilizing strains of human immunodeficiency virus type 1 exhibit differential tropism and pathogenesis in vitro. J Virol. 1998;72:10108–10117. - PMC - PubMed

Publication types

Associated data