. 1999 Nov 15;19(22):9939-52.
doi: 10.1523/JNEUROSCI.19-22-09939.1999.

Formation of cortical fields on a reduced cortical sheet

Affiliations

Formation of cortical fields on a reduced cortical sheet

K J Huffman et al. J Neurosci. .

Abstract

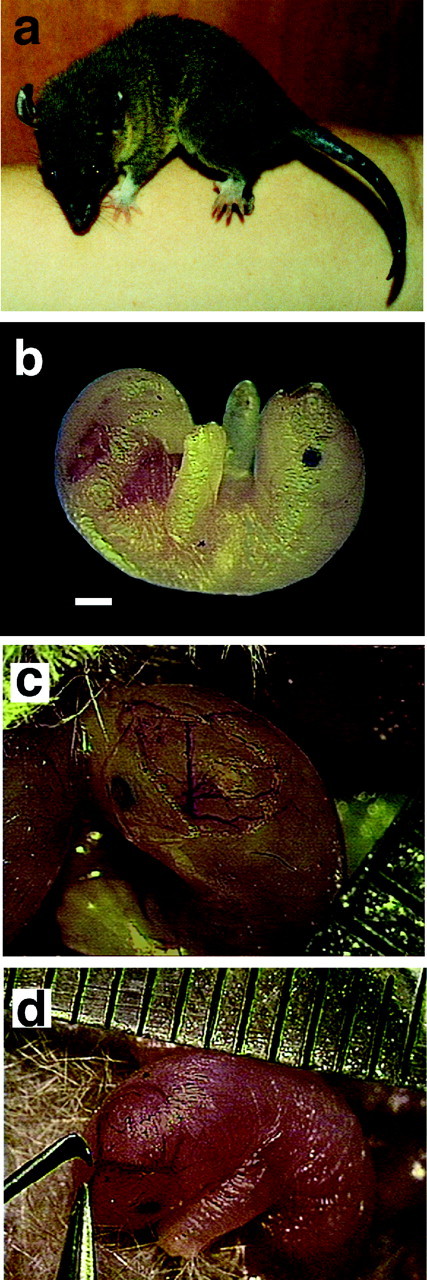
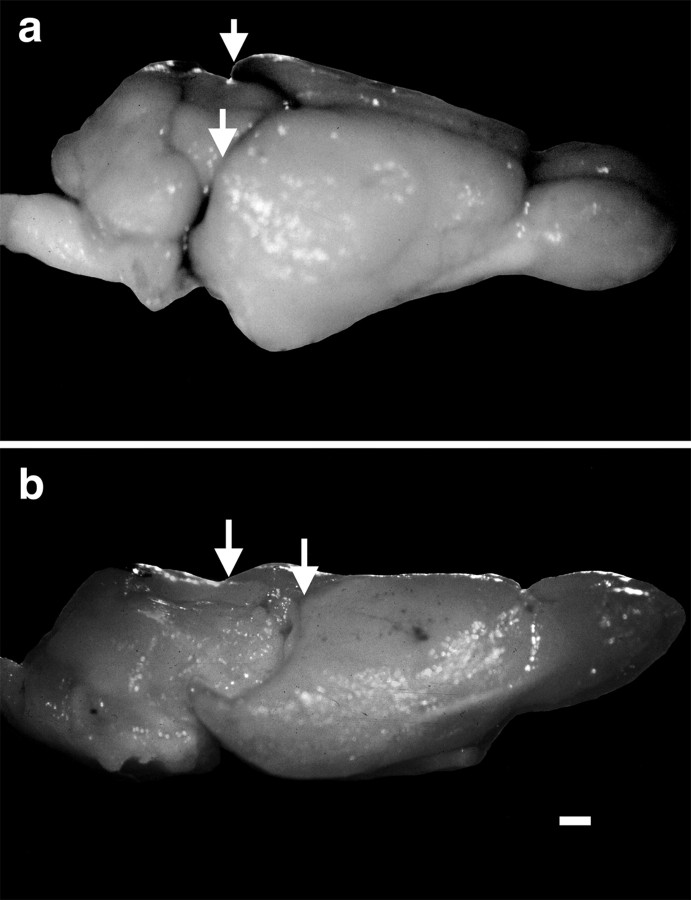
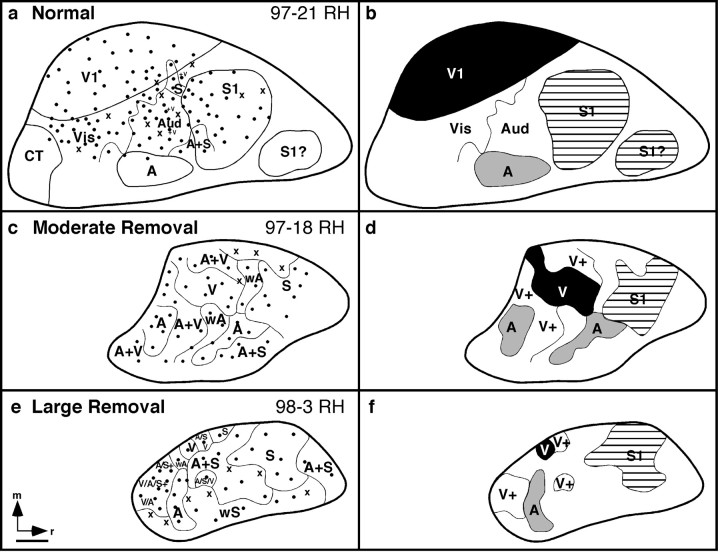
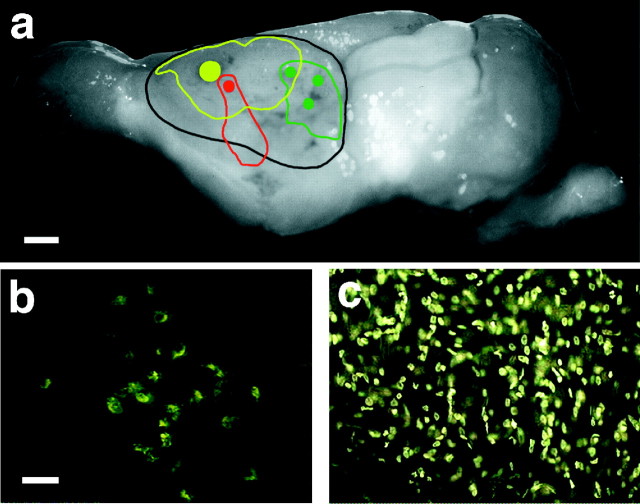
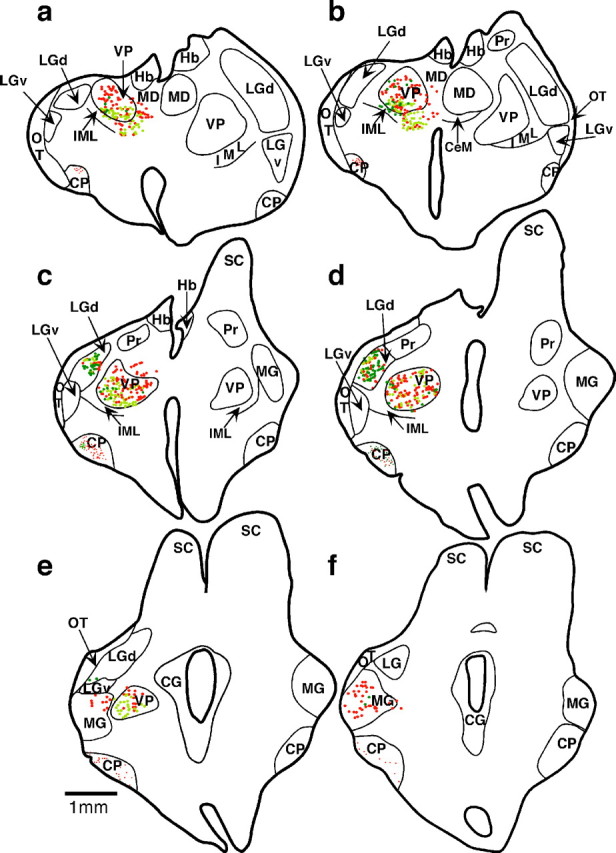
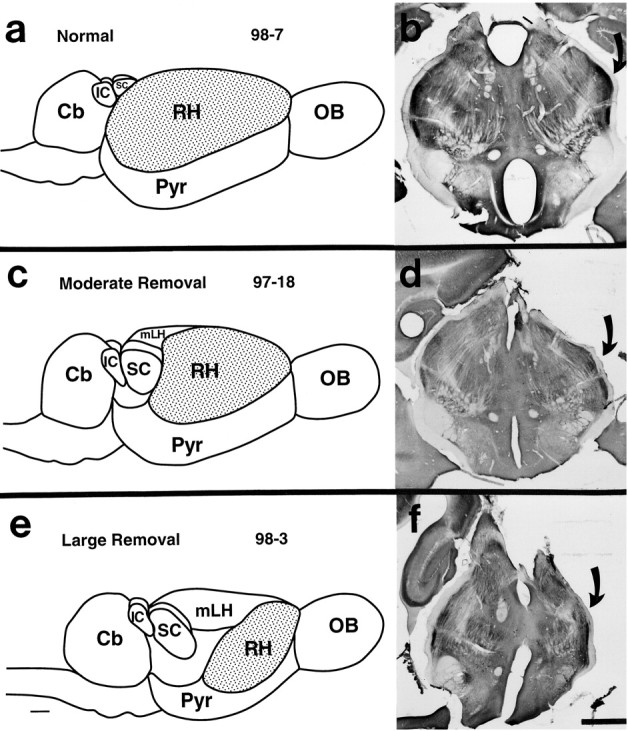
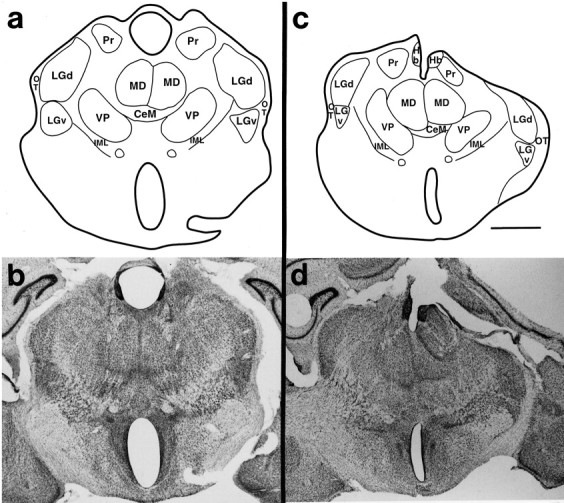
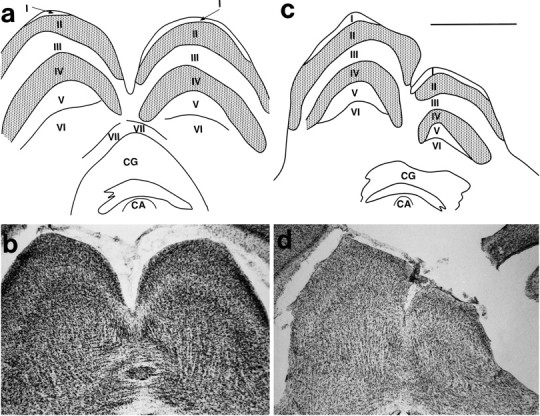
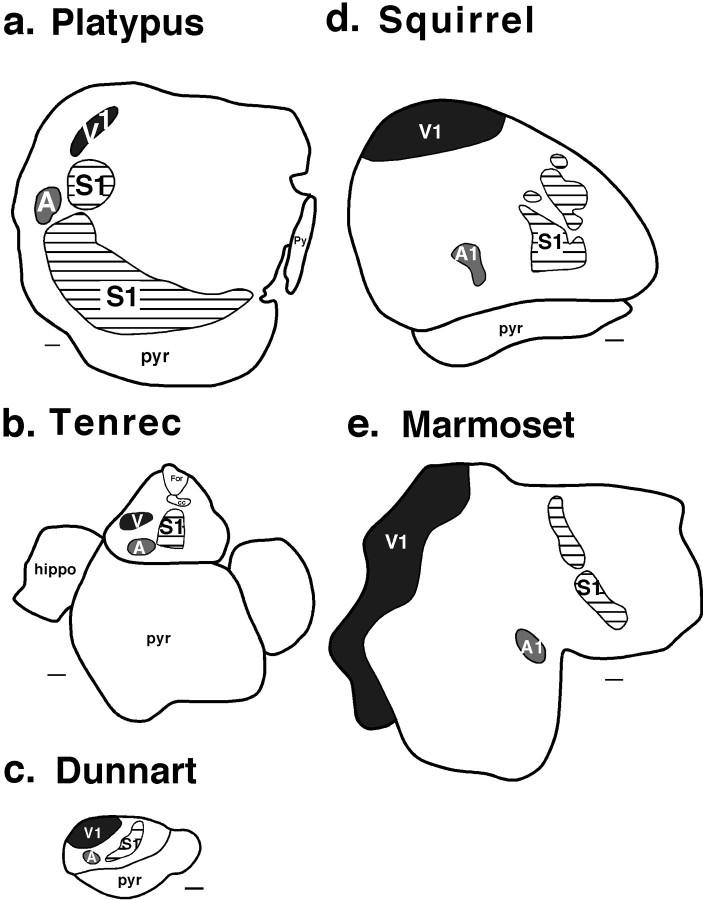
Theories of both cortical field development and cortical evolution propose that thalamocortical projections play a critical role in the differentiation of cortical fields (; ). In the present study, we examined how changing the size of the immature neocortex before the establishment of thalamocortical connections affects the subsequent development and organization of the adult neocortex. This alteration in cortex is consistent with one of the most profound changes made to the mammalian neocortex throughout evolution: cortical size. Removing the caudal one-third to three-fourths of the cortical neuroepithelial sheet unilaterally at an early stage of development in marsupials resulted in normal spatial relationships between visual, somatosensory, and auditory cortical fields on the remaining cortical sheet. Injections of neuroanatomical tracers into the reduced cortex revealed in an altered distribution of thalamocortical axons; this alteration allowed the maintenance of their original anteroposterior distribution. These results demonstrate the capacity of the cortical neuroepithelium to accommodate different cortical fields at early stages of development, although the anteroposterior and mediolateral relationships between cortical fields appear to be invariant. The shifting of afferents and efferents with cortical reduction or expansion at very early stages of development may have occurred naturally in different lineages over time and may be sufficient to explain much of the phenotypic variation in cortical field number and organization in different mammals.


Figures

Fig. 1.
Fig. 1.
Photograph of an adult short-tailed opossum,Monodelphis domestica (a), and a P4 infant (b). To document the surgical procedures, a CCD camera (Optronics) was used to produce digital images of the P4 infants while they were attached to the mother's nipple during our procedure (c). A midline incision was made, and the skin and skull were retracted in preparation for the cortical neuroepithelial reduction. After the lesion was made with the excision tool (d), the skin was repositioned with forceps and held together with glue. Scale bar, 1 mm.
Fig. 2.
Fig. 2.
a, Photograph of a lateral view of the brain of a normal adult short-tailed opossum and (b) an adult short-tailed opossum that had the caudal one-third of the right developing neocortex removed at P4. Thearrows in both figures indicate the caudal pole of each hemisphere in the normal cortex and the manipulated cortex. Note that the caudal pole of the remaining cortex (b) is far rostral to its location in the normal animal and compared with the opposite hemisphere. Rostral is to the right, and dorsal is to the top. Scale bar, 1 mm.
Fig. 3.
Fig. 3.
Electrophysiological recording results from a right cortical hemisphere of a normal adult (a,b) and two right cortical hemispheres of adults that underwent removal of a portion of the cortical neuroepithelium at P4 (cf). The illustrations to theleft depict recording sites (black dots);thin lines represent physiological boundaries that enclose regions of the cortex in which neurons responded to the same sensory modality. The illustrations at the right denote the primary sensory fields, including the primary visual, primary somatosensory, and presumptive primary auditory field (V1, S1, A) in the normal animal (b), and the pure visual, somatosensory, and auditory fields (V, S1, andA) in the animals with moderate (d) and large (f) cortical removals. In the normal animal, thick dark lines(a, b) denote architectonic boundaries. Despite the large removals of the developing neocortex, the pattern of general rostrocaudal and mediolateral organization of cortical fields, although compressed, was relatively normal. A noteworthy change in the neocortex was that as the extent of the reduction increased, the relative amount of multimodal cortex increased. Scale bar, 1 mm.V or Vis, Visual; A orAud, auditory; S, somatosensory;A+S or A/S, auditory and somatosensory; A+V or V/A, auditory and visual; V/A/S, visual, auditory, and somatosensory; wA, weak auditory; wS, weak somatosensory; V+, visual + other sensory input; x, no response; CT, caudal temporal field; m, medial; r, rostral.
Fig. 4.
Fig. 4.
a, Digital image of a brain (case 98-31) that underwent removal of the cortical neuroepithelium at P4, and a superimposition, using the software Adobe Photoshop 4.0, of the center and spread of the injection sites on the left cortical hemisphere. Scale bar, 1 mm. The injections included DY + NY (yellow) into a rostral portion of cortex, FR (red) into a middle portion of cortex, and three injections of FE (green) into the caudal pole of the cortex. b, Digital image of retrogradely labeled cells in the dorsal division of the LGN resulting from an injection of FE into the caudal pole of the remaining cortex, in the expected location of visual cortex. Scale bar for b, c, 50 μm.c, Digital image of retrogradely labeled cells in the VP resulting from an injection of DY + NY in the presumptive somatosensory/multimodal cortex.
Fig. 5.
Fig. 5.
A series of sections from anterior to posterior through the thalamus of case 98-31 (af). Each dotrepresents a retrogradely labeled cell body from a cortical injection in the left hemisphere. Yellow dots are cells labeled with DY + NY, red dots are cells labeled with FR, anddark green dots are cells labeled with FE. Thin lines represent nuclear boundaries determined by architectonic analyses of alternate, neighboring sections stained for Nissl or CO. Throughout the thalamus, most of the DY + NY-labeled cells were located in VP, although some of these cells were also found in the LGd. Most FR cells were observed in the VP, although some were seen in the MG and a few were observed in LGd. Labeled cells resulting from the most caudal set of injections in the cortex (FE) were mostly found in the LGd, demonstrating that although the entire occipital lobe was absent in this case, the LGd maintained substantial projections to the caudal portion of the remaining cortex, where, in other cases, visually responsive neurons were found. Portions of axons (small dots) labeled with FR and FE were found in the cerebral peduncle (CP). Some of the thalamic boundaries are taken from Turlejski et al. (1994). Scale bar, 1 mm. Hb, Habenula; MD, mediodorsal nucleus; LGv, ventral division of the lateral geniculate nucleus; OT, optic tract; IML, internal medullary lamina;CeM, central medial nucleus; Pr, pretectum; SC, superior colliculus; CG, central gray. Dorsal is to the top, and lateral is to the left and right of each section.
Fig. 6.
Fig. 6.
a, Photomicrograph of normal adult neocortex that has been cut coronally and stained for Nissl. The photomicrographs in b and c are from an adult neocortex where a moderate cortical neuroepithelial removal was made at P4. Cortex in this region appears normal in terms of laminar organization (b), although this was not the case for the entire extent of the reduced cortex. In some portions of the cortex, particularly the region toward the caudal end of cortex (c), the laminar organization of the cortex was more disrupted. Dorsal is up; lateral is to theright. Scale bar, 1 mm.
Fig. 7.
Fig. 7.
Illustrations of a dorsolateral view of the brain in the normal animal (a) and of one that has undergone a moderate (c) and a large (e) cortical removal. Photomicrographs of coronally cut CO-stained sections from the corresponding thalamus (b, d, f). Although the overall size of the thalamus has decreased, nuclear boundaries were still discrete. The LGd (arrows) can be seen in all cases. Scale bar, 1 mm. Cb, Cerebellum;SC, superior colliculus; IC, inferior colliculus; RH, right hemisphere; Pyr, pyriform cortex; OB, olfactory bulb; mLH, medial wall of the left hemisphere.
Fig. 8.
Fig. 8.
a, c, Reconstructions of the Nissl sections photographed in band d. These sections of the thalamus are from normal animals (a) and those with a moderate cortical removal (c). Thin lines mark nuclear boundaries determined by architectonic analyses. The corresponding photomicrographs (b, d) demonstrate that although the thalamus has been reduced on the side of the lesion, nuclear architecture is still distinct. Scale bar, 1 mm.
Fig. 9.
Fig. 9.
Illustrations of reconstructed Nissl sections (a, c) through the SC in the normal animal (a) and an animal that had undergone a moderate cortical removal at P4 (c). Thin lines mark boundaries between layers of the SC and of the CG.Stipple indicates cell-dense layers II and IV.b, d, Photomicrographs of those sections in the normal (b) and moderate removal (d) animals. Although the SC in the moderate cortical removal animal is reduced in size, its laminar pattern appears to be maintained. CA, Cerebral aqueduct. Scale bar, 1 mm. Conventions are as in previous Figures.
Fig. 10.
Fig. 10.
The organization of major sensory fields including S1, A, and V1 in various mammals. Although common areas can be identified across species, the geographic placement of these fields has shifted dramatically in different lineages with changes in cortical sheet size and peripheral specializations. With the expansion of the cortical sheet, cortical fields get larger, but this enlargement is not linear. Scale bar, 1 mm. Conventions are as in previous Figures.

Similar articles

Cited by

References

    1. Aitkin LM, Irvine DRF, Nelson JE, Merzenich MM, Clarey JC. Frequency representation in the auditory midbrain and forebrain of a marsupial, the northern native cat (Dasyurus hallucatus). Brain Behav Evol. 1986;29:17–28. - PubMed
    1. Barbe MF, Levitt R. Age-dependent specification of the corticocortical connections of cerebral grafts. J Neurosci. 1995;15:1819–1834. - PMC - PubMed
    1. Brodmann K. Vergleichende Lokalisationslehre der Grosshirnrinde in ihren Prinzipien dargestellt auf Grund des Zellenbaues. J. A. Barth; Leipzig: 1909.
    1. Bulfone A, Smiga SM, Shimamura K, Peterson A, Puelles L, Rubenstein JLR. T-Brain-1: a homolog of Brachyury whose expression defines molecularly distinct domains within the cerebral cortex. Neuron. 1995;15:63–78. - PubMed
    1. Carroll EW, Wong-Riley MTT. Quantitative light and electron microscopic analysis of cytochrome oxidase-rich zones in the striate cortex of the squirrel monkey. J Comp Neurol. 1984;222:1–17. - PubMed

Publication types

MeSH terms