. 1999 Nov 15;19(22):9975-85.
doi: 10.1523/JNEUROSCI.19-22-09975.1999.

Activity-driven synapse elimination leads paradoxically to domination by inactive neurons

Affiliations

Activity-driven synapse elimination leads paradoxically to domination by inactive neurons

M J Barber et al. J Neurosci. .

Abstract

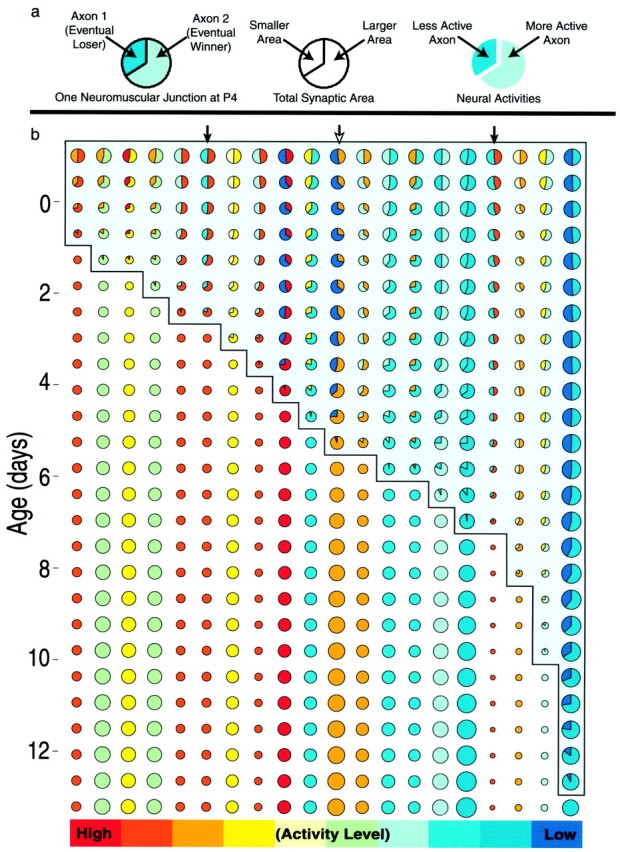
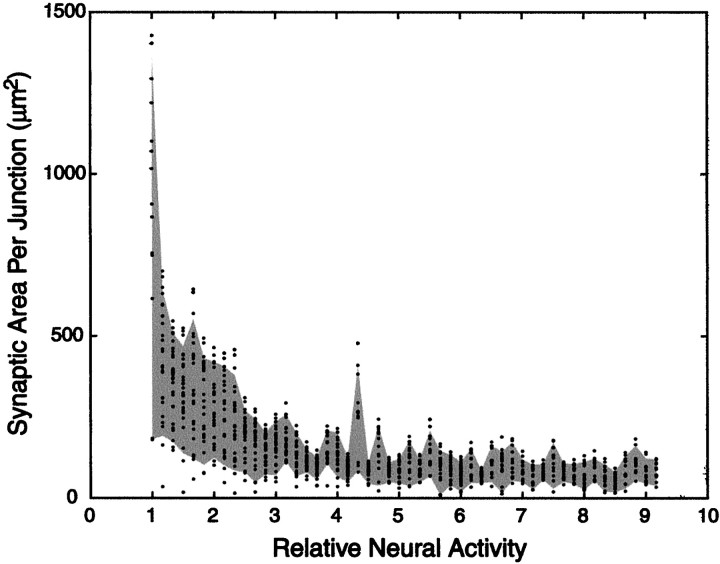
In early postnatal life, multiple motor axons converge at individual neuromuscular junctions. However, during the first few weeks after birth, a competitive mechanism eliminates all the inputs but one. This phenomenon, known as synapse elimination, is thought to result from competition based on interaxonal differences in patterns or levels of activity (for review, see Lichtman,1995). Surprisingly, experimental data support two opposite views of the role of activity: that active axons have a competitive advantage (Ribchester and Taxt, 1983; Ridge and Betz, 1984; Balice-Gordon and Lichtman, 1994) and that inactive axons have a competitive advantage (Callaway et al., 1987, 1989). To understand this paradox, we have formulated a mathematical model of activity-mediated synapse elimination. We assume that the total amount of transmitter released, rather than the frequency of release, mediates synaptic competition. We further assume that the total synaptic area that a neuron can support is metabolically constrained by its activity level and size. This model resolves the paradox by showing that a competitive advantage of higher frequency axons early in development is overcome at later stages by greater synaptic efficacy of axons firing at a lower rate. This model both provides results consistent with experiments in which activity has been manipulated and an explanation for the origin of the size principle (Henneman, 1985).


Figures

Fig. 1.
Fig. 1.
Simulations replicate the experimentally derived time course of synapse elimination. The model (solid line) reproduces the experimentally observed time course of elimination (open circles). In both cases, an initial period of gradual loss gives way to a period of more rapid loss, which finally tapers off as uniform single innervation is approached. To estimate the variability of the model results, the mean (solid line) of the fraction of multiple innervation from 10 simulations with different randomly assigned initial connectivity is presented with the range of variability (SD) shown by thegray shaded region. The physiological data shown here (Colman and Lichtman, 1993) were used to determine the rate parameters in the model (data shown are mean ± SEM).
Fig. 2.
Fig. 2.
Simulations replicate the increasing disparity seen experimentally between the synaptic areas of axons converging at the same developing neuromuscular junction. The experimentally derived synaptic strength (○; Colman and Lichtman, 1993) and synaptic area (x; Balice-Gordon et al., 1993) maintained by competing axons at a neuromuscular junction are initially similar, but steadily diverge with age. A similar trend is seen in the simulation (solid line, gray shaded region indicates mean ± SEM). In the simulations, the mean quantal content ratio or area ratio becomes more variable late in the competition period as the number of multiply innervated junctions decreases (experimental data shown are mean ± SEM).
Fig. 3.
Fig. 3.
Simulations generalize the experimentally derived relation between the relative strengths of competing inputs and the time required to complete the synapse elimination process. Shown are two experimentally derived estimates (○) of the time remaining until single innervation and the quantal contents of the competing inputs (Colman and Lichtman, 1993). In simulations, the average time it takes the competition to conclude at a doubly innervated junction (solid line, gray shaded region indicates mean ± SEM) appears to be related to the quantal content ratio by a power law (dashed line). Specifically, for quantal content ratior and remaining time t,r = (3.3240)t−0.6286. Note that quantal content ratios approximately <2:1 do not obey this power law, suggesting that the outcome of the competition is still in doubt at neuromuscular junctions in which the difference in quantal contents is minor.
Fig. 4.
Fig. 4.
Simulations mimic the trend in motor unit size development that occurs in two different muscles. a,Simulations patterned after the soleus muscle (Brown et al., 1976;Jansen and Fladby, 1990), with six axons converging on each neuromuscular junction at birth, show a definite narrowing in the range of sizes with age, whereas simulations patterned after the EDL muscle (Balice-Gordon and Thompson, 1988), in which two or three axons converge (b), maintain a similar range of sizes throughout the competition period.
Fig. 5.
Fig. 5.
In simulations, the least active motor units maintain the largest sizes. In accord with the experimentally derived size principle (Henneman, 1985), a comparison of the initial sizes (○) and final sizes (x) of motor units shows that the most active axons have a greater decrease in size than the least active axons. The least squares fits to these data sets have significantly different slopes [as a function of activity f, the initial motor unit size is (−0.0156)f + 40.0791, whereas the final motor unit size is (−1.4181)f + 27.3287].
Fig. 6.
Fig. 6.
In the simulations, blocking neural activity in a subset of motor axons increases the ability of the blocked axons to maintain synaptic connections. For each of thirty sets of initial conditions, two simulations were run: a normal simulation and a simulation in which a subset of 2 of 15 motor neurons were blocked for the latter half of the competitive period (days 5–12). The ratios of the sizes of the same motor units in the two simulations (subset blocked and normal) were calculated. The results were segregated into the effects on motor units that were active in both simulations and motor units that were blocked in one of the simulations.a, This histogram shows the ratios of motor units whose activities were normal in both the subset blocked and normal simulations. The ratios calculated for these motor units are nearly symmetrically distributed around ∼1. b, This histogram shows ratios for the minority of motor units whose activities were blocked in subset blocked simulation. For these motor units there is a rightward shift in the histogram, indicating that blocking activity increased their ability to maintain connections, consistent with the experimental findings of Callaway et al. (1989). The differences between the distributions in a andb are highly significant (p< 0.0001; two-sided Mann–Whitney U test).
Fig. 7.
Fig. 7.
Tests of possible alternatives for the cause of the maintained hyperinnervation associated with GDNF overexpression (Nguyen et al., 1998). a, For a GDNF-treated muscle in which we simulated a Gaussian-distributed initial degree of hyper-multiple innervation (inset), the model produces a time course of synapse elimination (solid line) and SD (gray shaded regions) that is inconsistent with the experimental evidence (○). The differences between the model and experimental results are significant (p < 0.05; χ2 test).b, However, when we also change the rate of competition by adjusting the model parameters, the simulation results are consistent (within one SD from the mean) with the experiments. The differences between the model and experimental results are not significant. c, Conversely, for strongly skewed initial distribution of axonal convergence (inset), simply changing the initial distribution of axonal convergence produces results in accord with the experiments. The differences between the model and experimental results are not significant. Thus, the model suggests that GDNF could generate its effect on synapse elimination in two different ways.
Fig. 8.
Fig. 8.
Simulations predict that the time ranges over which a motor unit is contracting and over which it is eliminating competitors is related to its activity level. a,Relatively active neurons tend to contract their motor units early in the competition, whereas relatively inactive neurons tend to contract their motor units late in the competition. The simulation has 50 motor neurons, each of which has a distinct activity level. Thedots in each vertical line represent the times at which the inputs of a motor axon are removed from each neuromuscular junction. The shaded gray regions(a, b) include the middle 80% of the observations to trim outliers. b, Relatively active neurons tend to eliminate competing axons early in the competition, whereas relatively inactive neurons tend to eliminate competing axons late in the competition. The dots in eachvertical line represent the times that a motor axon with a particular activity level eliminates the competing axon at each neuromuscular junction. In both a and b, it can be seen that, for each axon, the majority of changes in connectivity it undergoes and causes in competitors occur over only a few days.
Fig. 9.
Fig. 9.
The time development of individual simulated neuromuscular junctions shows many variations on a general trend.a, Left, Each neuromuscular junction is depicted as acolor-coded circle, with both the synaptic areas and the axonal activities simultaneously presented. a, Center, For each doubly innervated neuromuscular junction, the area of thecircle represents the total synaptic area at the neuromuscular junction. The circle is divided into two wedges with areas proportional to the areas maintained by each of the innervating axons. a, Right, The axonal activities are shown by the color, with the most active axons shown inred and the least active in dark blue(all neuromuscular junctions innervated by a particular axon are shown in the same color). b, Here, we show the changes that occur for 20 neuromuscular junctions, taken from a simulation consisting of 10 motor neurons and 200 muscle fibers, over a period of 12 d (14 hr between time points). The data are presented in such a way that the area of the ultimately victorious axon (wedge) at each neuromuscular junction (circle) gains by moving in a clockwise direction.
Fig. 10.
Fig. 10.
The model predicts that, after synapse elimination is complete, neuromuscular junction area is inversely related to the activity level of the innervating axon. Thedots in each vertical line show the synaptic areas maintained at individual neuromuscular junctions by a motor axon with a particular activity level. The gray shaded region shows the range of the middle 80% of the data to trim outliers.

Similar articles

Cited by

References

    1. Balice-Gordon RJ, Lichtman JW. Long-term synapse loss induced by focal blockade of postsynaptic receptors. Nature. 1994;372:519–524. - PubMed
    1. Balice-Gordon RJ, Thompson WJ. Synaptic rearrangements and alterations in motor unit properties in neonatal rate extensor digitorum longus muscle. J Physiol (Lond) 1988;398:191–210. - PMC - PubMed
    1. Balice-Gordon RJ, Chua CK, Nelson CC, Lichtman JW. Gradual loss of synaptic cartels precedes axon withdrawal at developing neuromuscular junctions. Neuron. 1993;11:801–815. - PubMed
    1. Bennett MR, Robinson J. Growth and elimination of nerve terminals at synaptic sites during polyneuronal innervation of muscle cells: a trophic hypothesis. Proc R Soc Lond B Biol Sci. 1989;235:299–320. - PubMed
    1. Brown MC, Jansen JK, Van Essen D. Polyneuronal innervation of skeletal muscle in new-born rats and its elimination during maturation. J Physiol (Lond) 1976;261:387–422. - PMC - PubMed

Publication types