. 1999 Nov 15;19(22):10082-97.
doi: 10.1523/JNEUROSCI.19-22-10082.1999.

Total number and ratio of excitatory and inhibitory synapses converging onto single interneurons of different types in the CA1 area of the rat hippocampus

Affiliations

Total number and ratio of excitatory and inhibitory synapses converging onto single interneurons of different types in the CA1 area of the rat hippocampus

A I Gulyás et al. J Neurosci. .

Abstract

The least known aspect of the functional architecture of hippocampal microcircuits is the quantitative distribution of synaptic inputs of identified cell classes. The complete dendritic trees of functionally distinct interneuron types containing parvalbumin (PV), calbindin D(28k) (CB), or calretinin (CR) were reconstructed at the light microscopic level to describe their geometry, total length, and laminar distribution. Serial electron microscopic reconstruction and postembedding GABA immunostaining was then used to determine the density of GABA-negative asymmetrical (excitatory) and GABA-positive symmetrical (inhibitory) synaptic inputs on their dendrites, somata, and axon initial segments. The total convergence and the distribution of excitatory and inhibitory inputs were then calculated using the light and electron microscopic data sets. The three populations showed characteristic differences in dendritic morphology and in the density and distribution of afferent synapses. PV cells possessed the most extensive dendritic tree (4300 microm) and the thickest dendrites. CR cells had the smallest dendritic tree (2500 microm) and the thinnest shafts. The density of inputs as well as the total number of excitatory plus inhibitory synapses was several times higher on PV cells (on average, 16,294) than on CB (3839) or CR (2186) cells. The ratio of GABAergic inputs was significantly higher on CB (29.4%) and CR (20.71%) cells than on PV cells (6.4%). The density of inhibitory terminals was higher in the perisomatic region than on the distal dendrites. These anatomical data are essential to understand the distinct behavior and role of these interneuron types during hippocampal activity patterns and represent fundamental information for modeling studies.


Figures
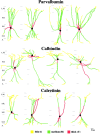
Fig. 1.
Fig. 1.
Reconstructed dendritic trees of PV-, CB-, and CR-containing interneurons from the CA1 region of the rat hippocampus. Four examples are shown from each reconstructed cell population, illustrating the characteristics of branching patterns. Different types of dendritic segments separated on the basis of their diameter are indicated with different colors. Note the variance in the total length of dendrites of individual cells within a cell group and the differential distribution of dendrites in distinct layers for the three cell populations. Parvalbumin cells had the largest dendritic tree, and calretinin cells had the smallest. The horizontal extent of the dendritic tree was widest for calbindin cells and narrowest for calretinin cells. Scale bar, 50 μm. L.M., Stratum lacunosum-moleculare; S.R., stratum radiatum;S.P., stratum pyramidale; S.O., stratum oriens.
Fig. 2.
Fig. 2.
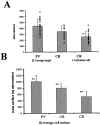
Total length of dendrites (A), and surfaces of somata (B) of CA1 area interneurons. A,PV cells have the longest total dendritic length, and CR cells have the shortest. However, as indicated by the small open squares representing the length of individual dendrites, there was a high variability among individual cells within a group. Only the length of CR dendrites showed significant (p< 0.05) difference from the other two cell populations.B, As for the total dendritic lengths, the soma surface was largest for PV cells and smallest for CR cells with considerable variance. The values are given in square micrometers. The differences among the groups were significant (n = 20;p < 0.05).
Fig. 3.
Fig. 3.
Distribution of excitatory and inhibitory inputs on medium-diameter dendrites of PV-, CB-, and CR-immunoreactive interneurons in CA1 stratum radiatum. The dendrites and the synapses were reconstructed from serial ultrathin sections immunostained for GABA. A large difference can be seen both in the absolute and relative number of excitatory and inhibitory synapses terminating on the three types of dendrites. The surface of the PV-positive dendrite is densely covered by synapses in contrast to the sparse innervation of CB- and CR-positive dendrites. On the other hand, the proportion of inhibitory terminals compared to all synaptic inputs is lowest on the PV and highest on the CB dendrites. Excitatory terminals are coloredlight gray, GABAergic inhibitory boutons aredark. Note the large variance in the size of axon terminals. GABA-negative and GABA-positive axon terminals labeled with e1–e9 and i1–i4, respectively, are shown in electron micrographs in Figure 4. Scale bar, 1 μm.
Fig. 4.
Fig. 4.
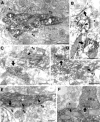
Types of afferent boutons on the dendrites of the examined interneuron populations. A, B, PV-positive dendrites received synapses from GABA-negative (e1–e5), GABA-positive (i1), as well as PV/GABA-positive terminals. From the five excitatory terminals (e1–e5) contacting a short section of the reconstructed dendrite shown in Figure 3, four (e1–e4) formed asymmetrical synapses (curved white arrows) in this plane of section. The large GABA-positive terminal (i1) also formed a synapse (white arrow) with the dendrite, however, as often happens in immunostained material, the symmetrical nature of the synapse is not evident because of the DAB precipitate in the postsynaptic profile. B demonstrates a GABA-negative, likely excitatory (e), a GABA-positive inhibitory (i), and a PV-positive (PV) terminal forming synapses on a PV-positive (nonreconstructed) dendrite. C, D, Electron micrographs of two parts of the reconstructed CB dendrite in Figure 3 demonstrate the large variation in the size of GABA-negative excitatory (e6 vs e7) and GABA-positive inhibitory (i2 vs i3) terminals forming asymmetrical (curved arrows) and symmetrical (arrow) synapses. E, F,CR-positive dendrites, besides the GABA-positive and -negative terminals, might receive inputs from CR-immunoreactive axons as well. Excitatory terminals e8 and e9 and the inhibitory synapse i4 contact the reconstructed dendrite shown in Figure 3. In F a dendrite (not shown in Fig. 3) is innervated by a GABA-positive CR-positive axon terminal as well as by a GABA-negative (e) terminal. Scale bars, 0.5 μm.
Fig. 5.
Fig. 5.
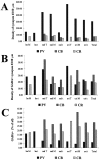
Density of total synaptic input (A) and GABA-positive (B) synapses, as well as the ratio of terminals positive for GABA (C) terminating on different dendrite subclasses of the examined interneuron populations. Densities are expressed in number of synapses per 100 μm. The density of synapses is largest on PV dendrites (A), regardless of the layer or dendrite subclass. Conversely, the density of GABA-positive terminals is largest on CB dendrites (B), which means that the ratio of GABA-positive inputs is much higher on CB than on PV dendrites (C). For abbreviations, see Table1.
Fig. 6.
Fig. 6.
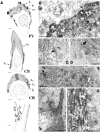
Afferents on the somata and axon initial segments of interneurons. A, Partial reconstructions of the somatic inputs of a PV, a CB, and a CR neuron, as well as the distribution of axo-axonic synapses on the axon initial segment of a PV neuron. Inhibitory cells receive both excitatory (light gray) and inhibitory (dark gray andblack) inputs onto their somata. A large proportion of the somatic inhibitory terminals on the PV somata came from PV-positive axon terminals (black). Eight to twelve axo-axonic synapses terminate on the axon initial segment of an interneuron. Innervation of the axon initial segment of a PV neuron is shown at thebottom of the panel. The axo-axonic synapses clustered close to the soma at the very beginning of the axon initial segment. Terminals labeled i1–i6 and e1–e3 are shown in electron micrographs in B–G. B,The three types of somatic input arriving onto PV cells are shown in the electron micrograph. Bouton e1 is a GABA-negative (presumed excitatory) terminal. Similar to the dendritic contacts, GABA-positive terminals could be PV-positive (PV) or negative (i1). C–E, CB- and CR-positive somata also received GABA-negative (excitatory, e2, e3) and GABA-positive (inhibitory, i2, i3-i4) synapses, but in a lower density than PV-containing somata. F, G, Low- and high-power electron micrographs of the axon initial segment (A) receiving symmetrical synapses. Note inA that the proportion of inhibitory terminals is higher in the somatic region than in the dendritic tree for all examined populations. In B–E and G,curved arrows indicate asymmetrical synapses, arrowsindicate symmetrical synapses. Scale bars: A, 2 μm for somata, 1 μm for AIS; B, D,E, G, 0.5 μm; C, 0.25 μm; F, 5 μm.
Fig. 7.
Fig. 7.
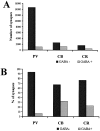
Absolute number (A) and proportion (B) of excitatory and inhibitory synapses converging onto the three examined cell populations. PV-positive cells received several times more excitatory input than CB or CR cells. The ratio of inhibition was highest on CB cells and lowest on PV cells. The SEM seen in the Tables derives from the SEM of dendritic length measurements and is not indicated here.
Fig. 8.
Fig. 8.
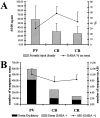
Characteristics of the somatic input.A, Density of somatic synapses (number of synapses per 100 μm2) and the ratio of GABA-positive terminals (expressed as percentage). The density of synapses, similarly to the values on the dendrites, were highest for PV cells and similar for the other two cell populations. The ratio of GABAergic terminals was higher than on the dendrites. B, Calculated total number of excitatory and inhibitory synapses on the somata of PV, CB, and CR cells, as well as the number of inhibitory synapses converging onto the axon initial segments. Because of their larger size, PV cells received many more inputs than the CB and especially the CR cells.
Fig. 9.
Fig. 9.
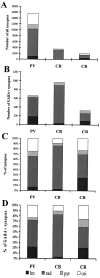
Distribution of all (A, C) and inhibitory (C, D) terminals on dendrites in different layers. A and B show the absolute, whereas C and D show the relative weight of inputs within different layers. CB cells receive most of their excitatory and inhibitory inputs in stratum radiatum. The input of the PV and especially the CR cells is more balanced.
Fig. 10.
Fig. 10.
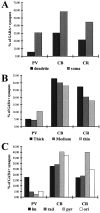
Ratio of inhibitory inputs on different compartments calculated from total convergence values.A, The ratio of inhibitory synapses on somata was higher than on dendrites for all cell populations. B, Ratio of inhibition versus dendrite thickness. Thinner and thus more remote dendritic regions had a lower percentage of inhibitory terminals than the proximal dendrites in the case of CB and CR cells. A similar trend was seen on PV cells in the case of thick and medium dendrites. The trend broke in the case of thin dendrites, most probably because a large amount of thin dendrites were found in stratum lacunosum-moleculare, where the ratio of inhibition is generally higher. C, The ratio of inhibition in different layers for the three cell types.
Fig. 11.
Fig. 11.
Relative distribution of GABA+inhibitory terminals on different domains of the examined cell types. Note that although the relative surface of the somata is small compared to the total dendritic surface, a large portion of the inhibitory inputs (15–20%) converges onto the perisomatic region (darker shades, soma, and AIS) in the case of PV cells. The contribution of dendritic inhibition (lighter shades, thin, medium, thick dendrites) is highest for CB cells and lowest for PV cells.

Similar articles

Cited by

References

    1. Acsady L, Gorcs TJ, Freund TF. Different populations of vasoactive intestinal polypeptide-immunoreactive interneurons are specialized to control pyramidal cells or interneurons in the hippocampus. Neuroscience. 1996;73:317–334. - PubMed
    1. Ali AB, Thomson AM. Facilitating pyramid to horizontal oriens-alveus interneurone inputs: dual intracellular recordings in slices of rat hippocampus. J Physiol (Lond) 1998;507:185–199. - PMC - PubMed
    1. Amaral DG, Witter MP. The three-dimensional organization of the hippocampal formation: a review of anatomical data. Neuroscience. 1989;31:571–591. - PubMed
    1. Baimbridge KG, Miller JJ. Immunohistochemical localization of calcium-binding protein in the cerebellum, hippocampal formation and olfactory bulb of the rat. Brain Res. 1982;245:223–229. - PubMed
    1. Banks MI, Li TB, Pearce RA. The synaptic basis of GABAA,slow. J Neurosci. 1998;18:1305–1317. - PMC - PubMed

Publication types

MeSH terms