. 1999 Nov 15;147(4):743-60.
doi: 10.1083/jcb.147.4.743.

Rab6 coordinates a novel Golgi to ER retrograde transport pathway in live cells

Affiliations

Rab6 coordinates a novel Golgi to ER retrograde transport pathway in live cells

J White et al. J Cell Biol. .

Erratum in

  • J Cell Biol 2000 Jan 10;148(1):followi

Abstract

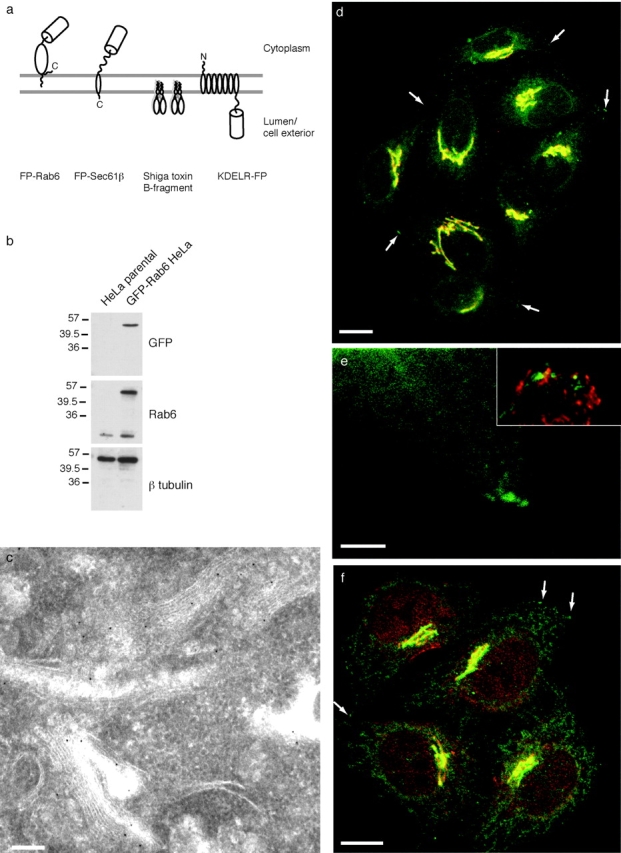
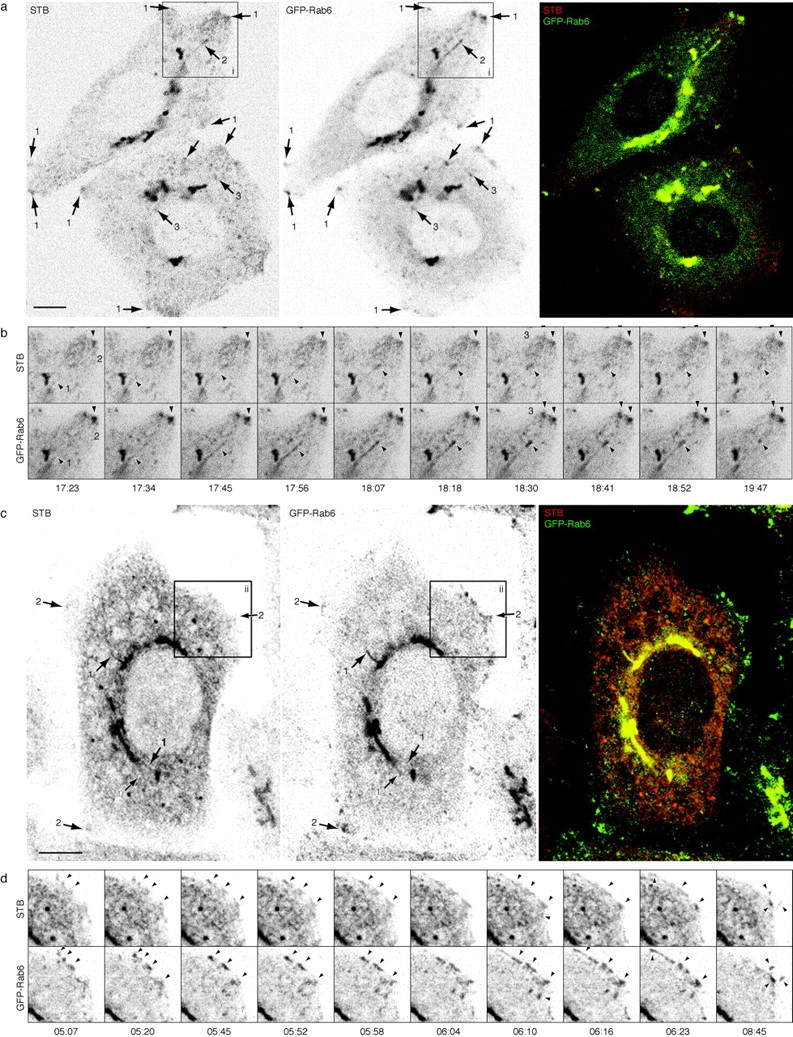
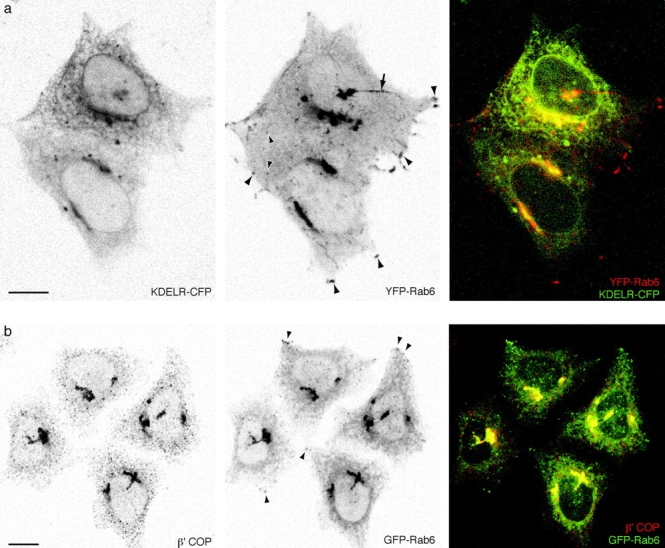
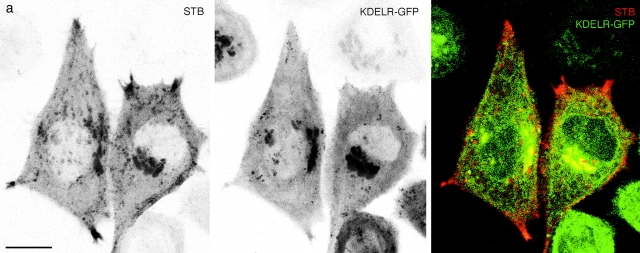
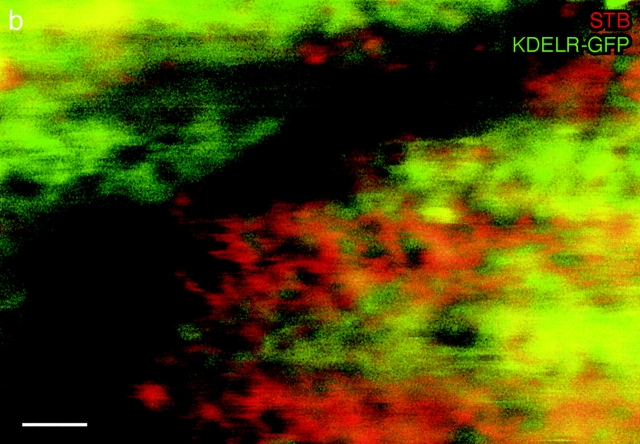
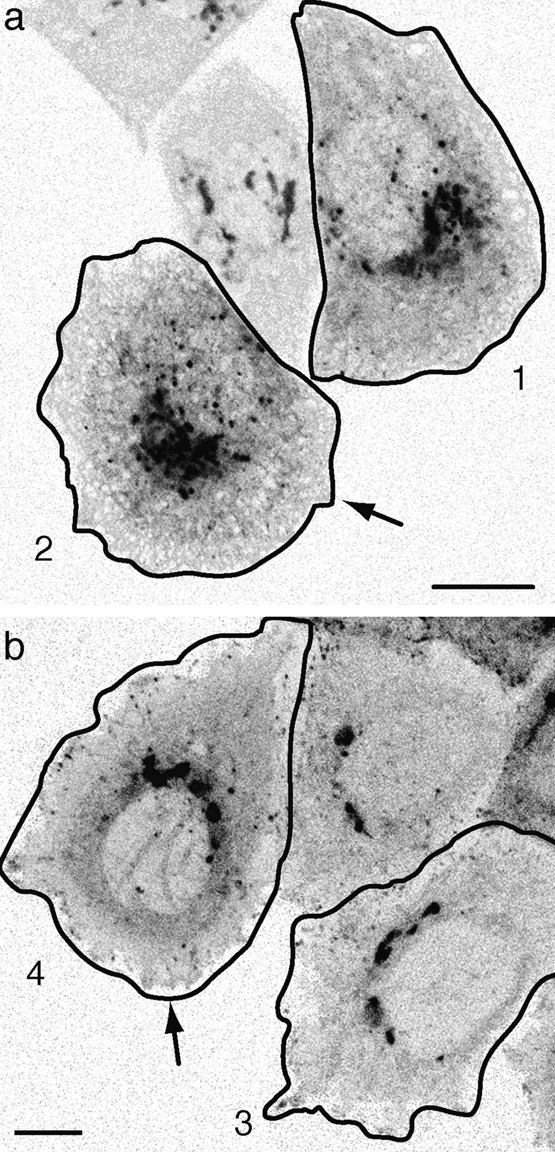
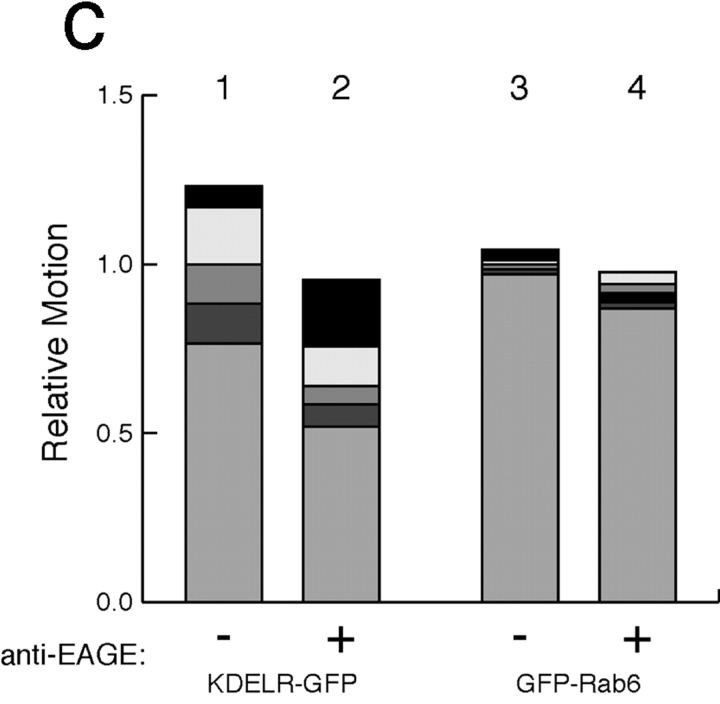
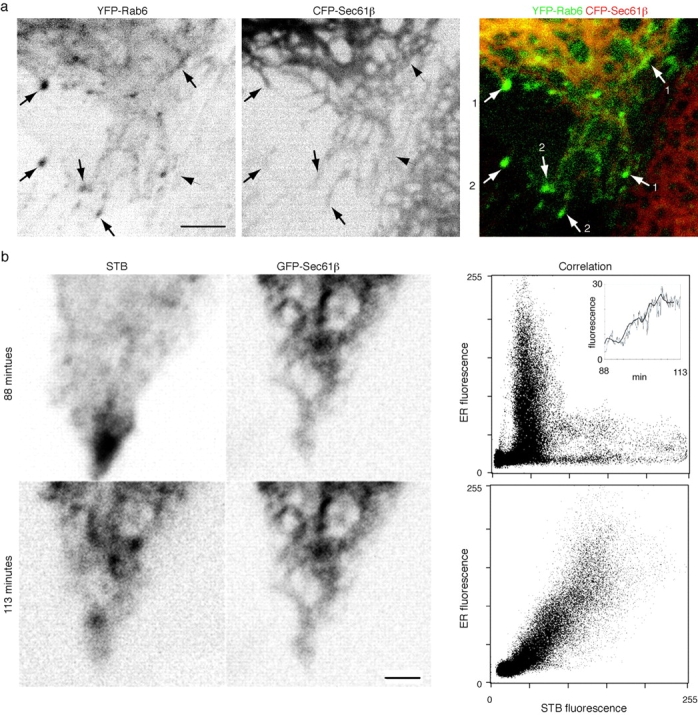
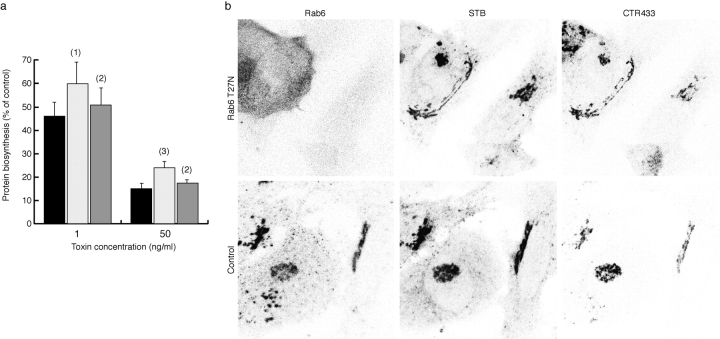
We visualized a fluorescent-protein (FP) fusion to Rab6, a Golgi-associated GTPase, in conjunction with fluorescent secretory pathway markers. FP-Rab6 defined highly dynamic transport carriers (TCs) translocating from the Golgi to the cell periphery. FP-Rab6 TCs specifically accumulated a retrograde cargo, the wild-type Shiga toxin B-fragment (STB), during STB transport from the Golgi to the endoplasmic reticulum (ER). FP-Rab6 TCs associated intimately with the ER, and STB entered the ER via specialized peripheral regions that accumulated FP-Rab6. Microinjection of antibodies that block coatomer protein I (COPI) function inhibited trafficking of a KDEL-receptor FP-fusion, but not FP-Rab6. Additionally, markers of COPI-dependent recycling were excluded from FP-Rab6/STB TCs. Overexpression of Rab6:GDP (T27N mutant) using T7 vaccinia inhibited toxicity of Shiga holotoxin, but did not alter STB transport to the Golgi or Golgi morphology. Taken together, our results indicate Rab6 regulates a novel Golgi to ER transport pathway.


Figures

Figure 1
Figure 1
Characterization of GFP-Rab6. (a) Fluorescent markers used in this study. (b) GFP-Rab6 is moderately overexpressed in stable cell lines. Whole cell extract from either stably transfected GFP-Rab6 HeLa cells or the untransfected parental cell line were blotted and probed with antibodies against GFP or native Rab6. Three sets of lanes were cut from the same gel. β-tubulin was probed as a loading control. (c) GFP-Rab6 localizes to Golgi stacks and associated tubular-vesicular profiles. Cryo-immunoelectron microscopy of GFP-Rab6 HeLa cells stained with anti-GFP antibody and detected with 10 nm gold. (d) Stably expressed GFP-Rab6 localizes to the Golgi and to peripheral elements. GFP-Rab6 (green) and the Golgi marker Giantin (red) in fixed cells. GFP-Rab6 fluorescence is from GFP; Giantin was visualized by immunofluorescence. Arrows point to representative GFP-Rab6 peripheral elements. The image is a single confocal section. (e) Peripheral GFP-Rab6 elements (green) and corner regions do not contain detectable Giantin (red, not visible), but are close to focal adhesions, revealed by Paxillin staining (inset, red). Cells fixed and stained as in D; single confocal section. (f) GFP-Rab6 expression does not alter the intracellular distribution of a Rab6 effector. Rabkinesin-6 (red) in fixed GFP-Rab6 cells. Brightest-point projection through 9 confocal sections taken every 0.7 μm. Arrows point to representative GFP-Rab6 elements that do not colocalize with Rabkinesin-6. Bars: (c) 250 nm; (d–f) 10 μm.
Figure 2
Figure 2
GFP-Rab6 trafficking in live cells is highly dynamic and reveals features of endogenous Rab6. See also the Fig. 2 movies at http://www.jcb.org/cgi/content/full/147/4/743/DC1. (a) Representative dynamic GFP-Rab6 elements. GFP-Rab6 stably expressed in a HeLa cell visualized over time at 37°C on a confocal laser-scanning microscope. Shown is a single confocal frame from a movie of 180 images taken at 1 frame/s. Representative globular (1) and tubular (2) trafficking elements are indicated with arrows. The diffuse network is visible as an irregular pattern in the cytosolic signal (also visible in b). Distinctive GFP-Rab6 edge (3) and corner (4) regions are indicated. The plane of focus is below the nucleus. Images are inverted. (b) GFP-Rab6 dynamics over time. Brightest-point projection of all 180 images of the movie in a. Movement appears as a series of dots for globular elements (1), and snake-like streaks for tubular elements (2). The high flux through the corner regions is indicated in the projection by an apparent accumulation in these regions (4, compare a with b). The line of dots between the peripheral corner points indicates trafficking between them. Blotchiness in the cytoplasmic regions indicates the underlying diffuse network. (c) Native Rab6 localizes to structures similar to those defined by GFP-Rab6. Immunofluorescence of endogenous Rab6 in untransfected HeLa cells shows the same features noted in a and b. Arrows point to corner regions (1), tubular elements (2), globular elements (3), and tubules extending from the Golgi (4). Bars, 5 μm.
Figure 3
Figure 3
FP-Rab6 trafficking elements translocate along microtubules. See the Fig. 3 movies and additional movies online at http://www.jcb.org/cgi/content/full/147/4/743/DC1. CFP-Rab6 and YFP-tubulin were transiently cotransfected and observed together in a live PtK2 cell. The peripheral edge of the cell is shown. (a) YFP-tubulin at the peripheral edge of a cell. Single confocal slice at the start of the movie. (b) CFP-Rab6 over time. Projection of 25 confocal images taken every 8.8 s. (c) Manual tracking of selected CFP-Rab6 elements over time. Ten of the most visually prominent moving elements were tracked over the course of the movie. Stable elements are near the tips of microtubules, but do not move significantly and so were not tracked. (d) CFP-Rab6 tracks follow microtubules over time. Tracks from c overlaid on a projection of 25 YFP-tubulin images. Bar, 5 μm.
Figure 4
Figure 4
Wild-type Shiga toxin B-fragment traffics in GFP-Rab6 structures during Golgi→ER retrograde transport. See also the Fig. 4 movies at http://www.jcb.org/cgi/content/full/147/4/743/DC1. (a) STB traffics in GFP-Rab6 elements during initial Golgi→ER retrograde transport. Representative frame from a movie of 220 confocal images. Cy3-labeled STB was bound to GFP-Rab6 HeLa cells at 4°C and internalized at 37°C for 20 min to accumulate the fragment in the Golgi, then shifted to 28°C to prolong Golgi exit. Other temperature shift protocols were performed as described in Results with similar outcome. Arrows point to STB and GFP-Rab6 together in corner regions (1), in a tubule extending from the Golgi (2) and in globular trafficking elements (3). Images are inverted. (b) The dynamics of GFP-Rab6 and STB from region i in a. A tubule (1) containing both GFP-Rab6 and STB extends from the Golgi, detaches, and translocates to a peripheral corner region (2). STB and GFP-Rab6 accumulate together in peripheral corner regions and exhibit the same fluctuations in intensity (3). The time indicated is min:s since the beginning of imaging. Scale same as a. (c) STB continues to traffic in GFP-Rab6 structures during later times of STB internalization. Shown is a single frame from a movie of 250 confocal images initiated after 5 h of STB internalization at 37°C. Arrows point to STB and GFP-Rab6 in tubules extending from the Golgi (1), and in peripheral corner regions (2). (d) The dynamics of GFP-Rab6 and STB from region ii in c. Arrowheads point to structures where STB and GFP-Rab6 show the same dynamics. Time indicated is min:s after imaging was initiated at 5 h of STB transport. Several globular elements move toward the upper left and extend as a tubule at 6:04 and travel away at 6:23. By 8:45, other trafficking elements have entered the peripheral site and condensed there, extending out into projections from the cell. Bars: (a and b) 5 μm; (c and d) 10 μm.
Figure 5
Figure 5
FP-Rab6 trafficking is distinct from Golgi→ER transport defined by KDELR-FP and COPI-coated peripheral structures. See also the Fig. 5 movies at http://www.jcb.org/cgi/content/full/147/4/743/DC1. (a) KDELR-CFP and YFP-Rab6 traffic in separate peripheral structures. KDELR-CFP and YFP-Rab6 were transiently cotransfected and observed together in a live cell. Shown is a single confocal slice; in the color overlay YFP-Rab6 is red and KDELR-CFP is green. An arrow points to a long YFP-Rab6 tubular element that extends to the cell periphery, it is devoid of detectable KDELR-CFP. Arrowheads point to representative globular YFP-Rab6 trafficking elements and corner regions that do not contain KDELR-CFP. The online movie shows a different cell (YFP-Rab6 in red and KDELR-CFP in green). (b) Peripheral GFP-Rab6 elements are separate from peripheral COPI-coated structures. GFP-Rab6 cells were fixed in PFA and stained for components of the COPI coatomer complex. Shown is a single confocal slice through GFP-Rab6 cells stained for β′-COP. Arrowheads show where GFP-Rab6 peripheral elements are separate from punctate structures positive for β′-COP. Bars, 10 μm.
Figure 6
Figure 6
STB is distinct from KDELR-GFP during Golgi→ER transport and segregates from KDELR-GFP in the ER. See also the Fig. 6 movies at http://www.jcb.org/cgi/content/full/147/4/743/DC1. (a) STB segregates from KDELR-GFP trafficking structures at early transport times. STB was internalized at 37°C for 20 min in stably transfected KDELR-GFP HeLa cells before imaging was initiated, after STB had visually cleared the endosomal structures and accumulated in the Golgi. Shown is a brightest-point projection through 125 frames of a movie of single confocal slices taken at 7.1 s/frame (3.55 s/channel); the entire duration of the movie is 14 min. (b) STB and KDELR-GFP partition to different regions within the network of the ER. Shown is a single confocal slice of the periphery of a living cell. STB in the ER extends further toward the periphery than KDELR-GFP ER fluorescence, and is restricted to different, complementary domains. Bars: (a) 10 μm; (b) 2 μm.
Figure 6
Figure 6
STB is distinct from KDELR-GFP during Golgi→ER transport and segregates from KDELR-GFP in the ER. See also the Fig. 6 movies at http://www.jcb.org/cgi/content/full/147/4/743/DC1. (a) STB segregates from KDELR-GFP trafficking structures at early transport times. STB was internalized at 37°C for 20 min in stably transfected KDELR-GFP HeLa cells before imaging was initiated, after STB had visually cleared the endosomal structures and accumulated in the Golgi. Shown is a brightest-point projection through 125 frames of a movie of single confocal slices taken at 7.1 s/frame (3.55 s/channel); the entire duration of the movie is 14 min. (b) STB and KDELR-GFP partition to different regions within the network of the ER. Shown is a single confocal slice of the periphery of a living cell. STB in the ER extends further toward the periphery than KDELR-GFP ER fluorescence, and is restricted to different, complementary domains. Bars: (a) 10 μm; (b) 2 μm.
Figure 7
Figure 7
GFP-Rab6 trafficking does not depend on COPI function. See also the Fig. 7 movies and the Additional Experimental Procedures online at http://www.jcb.org/cgi/content/full/147/4/743/DC1. (a) Microinjection of anti-EAGE inhibits KDELR-GFP dynamics. Image from a movie of KDELR-GFP HeLa cells, injected (arrow) and uninjected. Imaging was initiated ∼30 min after injection. A single frame was taken every 4 s for 26 min (395 frames). The focus is at the level of the ER; a cell adjacent to the injected cell has been pushed upwards by cell–cell contact. The regions used for correlation analysis to quantitate relative motion are outlined. (b) Microinjection of anti-EAGE does not inhibit GFP-Rab6 dynamics. Image from a movie of one injected (arrow) and two uninjected GFP-Rab6 HeLa cells. Imaging was initiated ∼30 min after injection. A single frame was taken every 5.1 s for 21 min (250 frames). The regions used for correlation analysis are outlined. (c) Correlation analysis of relative motion. The correlation of each sequential frame for the regions indicated was calculated for the entire movie; a cell with higher overall motility shows less correlation between frames (see supplemental Experimental Procedures at http://www.jcb.org/cgi/content/full/147/4/743/DC1). Comparative correlation analysis is most precise when the cells are imaged in the same movie as shown in A and B. The graph shows the standard deviation of the average correlation for the entire movie, normalized to the uninjected cell. The shaded regions of the bars indicate the effect of adjusting the threshold of the analysis by ±5 and ±10%; only similar shades should be compared. Error depends on the number of frames analyzed and is <1% in all cases. Bars: (a and b) 5 μm.
Figure 7
Figure 7
GFP-Rab6 trafficking does not depend on COPI function. See also the Fig. 7 movies and the Additional Experimental Procedures online at http://www.jcb.org/cgi/content/full/147/4/743/DC1. (a) Microinjection of anti-EAGE inhibits KDELR-GFP dynamics. Image from a movie of KDELR-GFP HeLa cells, injected (arrow) and uninjected. Imaging was initiated ∼30 min after injection. A single frame was taken every 4 s for 26 min (395 frames). The focus is at the level of the ER; a cell adjacent to the injected cell has been pushed upwards by cell–cell contact. The regions used for correlation analysis to quantitate relative motion are outlined. (b) Microinjection of anti-EAGE does not inhibit GFP-Rab6 dynamics. Image from a movie of one injected (arrow) and two uninjected GFP-Rab6 HeLa cells. Imaging was initiated ∼30 min after injection. A single frame was taken every 5.1 s for 21 min (250 frames). The regions used for correlation analysis are outlined. (c) Correlation analysis of relative motion. The correlation of each sequential frame for the regions indicated was calculated for the entire movie; a cell with higher overall motility shows less correlation between frames (see supplemental Experimental Procedures at http://www.jcb.org/cgi/content/full/147/4/743/DC1). Comparative correlation analysis is most precise when the cells are imaged in the same movie as shown in A and B. The graph shows the standard deviation of the average correlation for the entire movie, normalized to the uninjected cell. The shaded regions of the bars indicate the effect of adjusting the threshold of the analysis by ±5 and ±10%; only similar shades should be compared. Error depends on the number of frames analyzed and is <1% in all cases. Bars: (a and b) 5 μm.
Figure 8
Figure 8
Shiga toxin B-fragment transport, FP-Rab6 trafficking and peripheral ER dynamics. See also the Fig. 8 movies and the Additional Experimental Procedures online at http://www.jcb.org/cgi/content/full/147/4/743/DC1. (a) FP-Rab6 traffics along the peripheral ER and stably associates with the tips of ER tubules. YFP-Rab6 and CFP-Sec61β were coexpressed in a PtK2 cell. Shown is one time point from a movie covering 16 min (images acquired every 7.6 s) of a cell corner region. Arrows show FP-Rab6 TCs along the ER network (1) and stably associated with tips of ER tubules (2). (b) Shiga toxin B-fragment enters the ER from peripheral corner regions. Dispersal of STB accumulated in a peripheral corner regions was imaged for 20 min after STB was internalized 90 min at 37°C in a HeLa cell expressing the ER resident GFP-Sec61β. Images were acquired every 6.1 s. Shown are initial and final images of STB dispersal, and the correlation plots of STB and the ER at each time. Bars, 4 μm.
Figure 9
Figure 9
Overexpression of Rab6 T27N inhibits Golgi→ER transport of Shiga holotoxin. (a) Toxicity of Shiga holotoxin is reduced in cells overexpressing Rab6T27N. HeLa cells were mock transfected (dark grey) or transfected with Rab6T27N (light grey) or Rab6I46E (medium grey). After 6 h, Shiga toxin was added at the indicated concentrations and protein biosynthesis was determined as described in Materials and Methods. The data (mean ± SEM, five independent experiments) are presented as percentage of protein biosynthesis in toxin-treated cells compared with non–toxin-treated cells in the same condition. (1) P < 0.05, (2) nonsignificant, (3) P < 0.005 (paired Student's t test). Rab6T27N overexpressing cells were partially protected against Shiga toxin, when compared with control cells. (b) Overexpression of Rab6 T27N does not significantly affect earlier stages of STB transport or Golgi morphology. HeLa cells were mock transfected (control) or transfected with Rab6T27N (T27N) for 12 h. Cy3-labeled B-fragment (STB) was then bound to these cells on ice, the cells were shifted to 37°C for 1 h, then fixed and stained with CTR433 and anti-Rab6 antibodies. In cells overexpressing Rab6T27N (identified by high Rab6 cytoplasmic staining), confocal microscopy shows the Golgi is intact and accumulates STB identically to mock transfected or control cells.

Similar articles

Cited by

References

    1. Antony C., Cibert C., Geraud G., Santa Maria A., Maro B., Mayau V., Goud B. The small GTP-binding protein rab6p is distributed from medial Golgi to the trans-Golgi network as determined by a confocal microscopic approach. J. Cell Sci. 1992;103:785–796 . - PubMed
    1. Aoe T., Cukierman E., Lee A., Cassel D., Peters P.J., Hsu V.W. The KDEL receptor, ERD2, regulates intracellular traffic by recruiting a GTPase-activating protein for ARF1. EMBO (Eur. Mol. Biol. Organ.) J. 1997;16:7305–7316 . - PMC - PubMed
    1. Balch W.E., McCaffery J.M., Plutner H., Farquhar M.G. Vesicular stomatitis virus glycoprotein is sorted and concentrated during export from the endoplasmic reticulum. Cell. 1994;76:841–852 . - PubMed
    1. Bannykh S.I., Rowe T., Balch W.E. The organization of endoplasmic reticulum export complexes. J. Cell Biol. 1996;135:19–35 . - PMC - PubMed
    1. Cohen A., Hannigan G.E., Williams B.R., Lingwood C.A. Roles of globotriaosyl- and galabiosylceramide in verotoxin binding and high affinity interferon receptor. J. Biol. Chem. 1987;262:17088–17091 . - PubMed

Publication types

MeSH terms