. 1999 Nov 15;147(4):775-90.
doi: 10.1083/jcb.147.4.775.

Cathepsin S controls the trafficking and maturation of MHC class II molecules in dendritic cells

Affiliations

Cathepsin S controls the trafficking and maturation of MHC class II molecules in dendritic cells

C Driessen et al. J Cell Biol. .

Abstract

Before a class II molecule can be loaded with antigenic material and reach the surface to engage CD4+ T cells, its chaperone, the class II-associated invariant chain (Ii), is degraded in a stepwise fashion by proteases in endocytic compartments. We have dissected the role of cathepsin S (CatS) in the trafficking and maturation of class II molecules by combining the use of dendritic cells (DC) from CatS(-/-) mice with a new active site-directed probe for direct visualization of active CatS. Our data demonstrate that CatS is active along the entire endocytic route, and that cleavage of the lysosomal sorting signal of Ii by CatS can occur there in mature DC. Genetic disruption of CatS dramatically reduces the flow of class II molecules to the cell surface. In CatS(-/-) DC, the bulk of major histocompatibility complex (MHC) class II molecules is retained in late endocytic compartments, although paradoxically, surface expression of class II is largely unaffected. The greatly diminished but continuous flow of class II molecules to the cell surface, in conjunction with their long half-life, can account for the latter observation. We conclude that in DC, CatS is a major determinant in the regulation of intracellular trafficking of MHC class II molecules.


Figures
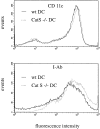
Figure 1
Figure 1
Surface expression of I-Ab molecules in wt and CatS−/− DC. DC freshly prepared from flt3 ligand–induced wt and CatS−/− splenocytes were stained with fluorochrome-labeled antibodies against I-Ab (MHC class II) and CD11c. Surface expression in the nongated live population was analyzed by FACS.
Figure 2
Figure 2
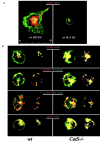
(A) Comparison of bone marrow–derived DC and DC induced by flt3 ligand treatment. Bone marrow–derived DC were generated by incubating bone marrow cells for 6 d in GM-CSF and were allowed to mature in culture for 48 h after purification of DC clusters (left). Flt3 ligand–induced DC were obtained from the spleen of mice injected with flt3 ligand–secreting melanoma cells. Both types of DC were permeabilized, stained for LAMP-1 (red) and class II molecules (green), and analyzed by confocal microscopy using identical magnification. (B) Intracellular localization of MHC class II, Ii, and H2-DM molecules in wt and CatS−/− DC. Freshly prepared flt3 ligand–induced DC from wt (left) and CatS−/− (right) mice were permeabilized and stained for the late endocytic marker LAMP-1 (red, top three rows), H2-DM (red, bottom row), and for MHC class II or Ii (green) (top and bottom rows, Y3P antibody against αβ dimers; second row, JV5 antiserum detecting the NH2 terminus of Ii; third row, JV11 antiserum recognizing COOH-terminal portion of Ii). The merged image (left image) and the image resulting from the colocalization analysis (right image) are shown for both wt and CatS−/− DC. (C) Schematic view of Ii and its breakdown intermediates. MHC Ii is degraded intracellularly in a stepwise fashion. Three invariant chain molecules (Ii) bind in their trimerization region forming a homotrimer. Three αβ dimers assemble onto this scaffold of an Ii trimer, which results in the nonameric MHC class II complex (αβIi)3 referred to as αβp (see also Fig. 6 A). This complex is disrupted by COOH-terminal proteolytic degradation of Ii by aspartyl and cysteine proteases including CatS, which leads to αβ molecules attached to degradation intermediates of Ii: p22, p18, and Iip10. In DC, NH2-terminal degradation of Ii is performed by CatS, which converts Iip10 into CLIP. The epitopes recognized by the anti-Ii antisera are indicated (JV5, NH2 terminus; JV11, COOH-terminal trimerization region).
Figure 2
Figure 2
(A) Comparison of bone marrow–derived DC and DC induced by flt3 ligand treatment. Bone marrow–derived DC were generated by incubating bone marrow cells for 6 d in GM-CSF and were allowed to mature in culture for 48 h after purification of DC clusters (left). Flt3 ligand–induced DC were obtained from the spleen of mice injected with flt3 ligand–secreting melanoma cells. Both types of DC were permeabilized, stained for LAMP-1 (red) and class II molecules (green), and analyzed by confocal microscopy using identical magnification. (B) Intracellular localization of MHC class II, Ii, and H2-DM molecules in wt and CatS−/− DC. Freshly prepared flt3 ligand–induced DC from wt (left) and CatS−/− (right) mice were permeabilized and stained for the late endocytic marker LAMP-1 (red, top three rows), H2-DM (red, bottom row), and for MHC class II or Ii (green) (top and bottom rows, Y3P antibody against αβ dimers; second row, JV5 antiserum detecting the NH2 terminus of Ii; third row, JV11 antiserum recognizing COOH-terminal portion of Ii). The merged image (left image) and the image resulting from the colocalization analysis (right image) are shown for both wt and CatS−/− DC. (C) Schematic view of Ii and its breakdown intermediates. MHC Ii is degraded intracellularly in a stepwise fashion. Three invariant chain molecules (Ii) bind in their trimerization region forming a homotrimer. Three αβ dimers assemble onto this scaffold of an Ii trimer, which results in the nonameric MHC class II complex (αβIi)3 referred to as αβp (see also Fig. 6 A). This complex is disrupted by COOH-terminal proteolytic degradation of Ii by aspartyl and cysteine proteases including CatS, which leads to αβ molecules attached to degradation intermediates of Ii: p22, p18, and Iip10. In DC, NH2-terminal degradation of Ii is performed by CatS, which converts Iip10 into CLIP. The epitopes recognized by the anti-Ii antisera are indicated (JV5, NH2 terminus; JV11, COOH-terminal trimerization region).
Figure 3
Figure 3
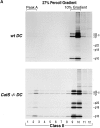
(A) Subcellular fractionation of flt3-induced DC from CatS−/− and wt mice. PNS of flt3-induced DC from CatS−/− and wt mice were fractionated using a 27% Percoll gradient as described, yielding the high-density peak A (left panel, fractions 1 and 2). The low-density peak of β-hexoaminidase activity (fractions 9 and 10) was applied subsequently onto a 10% Percoll gradient (right panel) to generate peaks B (fractions 1 and 2 of the 10% gradient) and C (fractions 11 and 12 of the 10% gradient). The β-hexosaminidase activity (beta-hex) and the distribution of incorporated radioactivity after metabolic labeling of the individual fractions are expressed as percentage of the total amounts retrieved from each gradient. (B) Comparison of the subcellular fractionation profiles from DC of different origin. DC from wt mice were either isolated from spleens after treatment with flt3 ligand (flt3 DC) or generated from bone marrow precursors of nontreated animals (BM DC). Subcellular fractions were prepared and assayed for β-hexosaminidase activity and incorporated radioactivity as in Fig. 3 A. (C) Characterization of subcellular fractions. Subcellular fractions were generated from flt3-induced splenic DC of wt mice as described. The distribution of lamp-1, M6PR, and TfR was assessed by Western blot followed by densitometry.
Figure 3
Figure 3
(A) Subcellular fractionation of flt3-induced DC from CatS−/− and wt mice. PNS of flt3-induced DC from CatS−/− and wt mice were fractionated using a 27% Percoll gradient as described, yielding the high-density peak A (left panel, fractions 1 and 2). The low-density peak of β-hexoaminidase activity (fractions 9 and 10) was applied subsequently onto a 10% Percoll gradient (right panel) to generate peaks B (fractions 1 and 2 of the 10% gradient) and C (fractions 11 and 12 of the 10% gradient). The β-hexosaminidase activity (beta-hex) and the distribution of incorporated radioactivity after metabolic labeling of the individual fractions are expressed as percentage of the total amounts retrieved from each gradient. (B) Comparison of the subcellular fractionation profiles from DC of different origin. DC from wt mice were either isolated from spleens after treatment with flt3 ligand (flt3 DC) or generated from bone marrow precursors of nontreated animals (BM DC). Subcellular fractions were prepared and assayed for β-hexosaminidase activity and incorporated radioactivity as in Fig. 3 A. (C) Characterization of subcellular fractions. Subcellular fractions were generated from flt3-induced splenic DC of wt mice as described. The distribution of lamp-1, M6PR, and TfR was assessed by Western blot followed by densitometry.
Figure 4
Figure 4
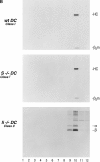
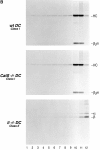
Steady-state distribution of MHC class II molecules after fractionation of wt and CatS−/−DC on a 27% Percoll gradient. DC were continuously labeled for 5 h, homogenized, and PNS were fractionated over a 27% Percoll gradient. 1-ml fractions were collected from the bottom of the tube and analyzed by immunoprecipitation, followed by boiling of the samples, 12.5% SDS-PAGE, and autoradiography. (A) Immunoprecipitation for MHC class II dimers from DC from wt and CatS−/− mice, using the N22 antibody (α/β: MHC class II α/β chain; Ii: invariant chain; p22, p18, p10: breakdown intermediates of Ii of the estimated molecular weight indicated). (B) Same subcellular fractions immunoprecipitated for MHC class I with the p8 antiserum (top and middle panels) (HC, class I heavy chain; β2m, β-2 microglobulin). (Lower panel) Identical experiment performed with DC from Ii−/− mice and immunoprecipitated with N22.
Figure 4
Figure 4
Steady-state distribution of MHC class II molecules after fractionation of wt and CatS−/−DC on a 27% Percoll gradient. DC were continuously labeled for 5 h, homogenized, and PNS were fractionated over a 27% Percoll gradient. 1-ml fractions were collected from the bottom of the tube and analyzed by immunoprecipitation, followed by boiling of the samples, 12.5% SDS-PAGE, and autoradiography. (A) Immunoprecipitation for MHC class II dimers from DC from wt and CatS−/− mice, using the N22 antibody (α/β: MHC class II α/β chain; Ii: invariant chain; p22, p18, p10: breakdown intermediates of Ii of the estimated molecular weight indicated). (B) Same subcellular fractions immunoprecipitated for MHC class I with the p8 antiserum (top and middle panels) (HC, class I heavy chain; β2m, β-2 microglobulin). (Lower panel) Identical experiment performed with DC from Ii−/− mice and immunoprecipitated with N22.
Figure 5
Figure 5
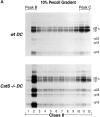
Steady-state distribution of MHC class II molecules after fractionation of wt and CatS−/− DC on consecutive 27 and 10% Percoll gradients. Fractions 9 and 10 from the 27% Percoll gradient ( Fig. 4) were applied to the second gradient (10% Percoll) to separate late endosomes from the remainder. 1-ml fractions were collected from the bottom of the tube and analyzed by immunoprecipitation, followed by boiling of the samples, 12.5% SDS-PAGE, and autoradiography. (A) Immunoprecipitation with N22 for MHC class II dimers (α/β, MHC class II α/β chain; Ii, invariant chain; p22, p18, and p10, breakdown intermediates of Ii of the estimated molecular weight indicated). (B) Immunoprecipitation for MHC class I with the p8 antiserum from the same fractions as 5a (top and middle) (HC, class I heavy chain; β2m, β-2 microglobulin). (Lower panel) Identical experiment performed with DC from Ii−/− mice and immunoprecipitated with N22.
Figure 5
Figure 5
Steady-state distribution of MHC class II molecules after fractionation of wt and CatS−/− DC on consecutive 27 and 10% Percoll gradients. Fractions 9 and 10 from the 27% Percoll gradient ( Fig. 4) were applied to the second gradient (10% Percoll) to separate late endosomes from the remainder. 1-ml fractions were collected from the bottom of the tube and analyzed by immunoprecipitation, followed by boiling of the samples, 12.5% SDS-PAGE, and autoradiography. (A) Immunoprecipitation with N22 for MHC class II dimers (α/β, MHC class II α/β chain; Ii, invariant chain; p22, p18, and p10, breakdown intermediates of Ii of the estimated molecular weight indicated). (B) Immunoprecipitation for MHC class I with the p8 antiserum from the same fractions as 5a (top and middle) (HC, class I heavy chain; β2m, β-2 microglobulin). (Lower panel) Identical experiment performed with DC from Ii−/− mice and immunoprecipitated with N22.
Figure 6
Figure 6
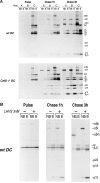
(A) Subcellular distribution of MHC class II molecules in wt and CatS−/− DC under pulse chase-labeling conditions. Flt3-induced DC from wt (upper panel) and CatS−/− (lower panel) mice were metabolically labeled with [35S]methionine/cysteine for 30 min (pulse) and chased for 1 and 3 h. At each timepoint, subcellular fractions A (lysosomes), B (late endosomes), and C (early endosomes/PM and ER–Golgi) were generated as described. Immunoprecipitation from these fractions was performed with N22 (class II) and p8 (class I) at the same time. The samples were divided into two and analyzed by 12.5% SDS-PAGE either without (NB) or with prior boiling (B). (αβp, high molecular weight nonameric [αβIi]3 complexes; αβl, 70-kD SDS-stable complex consisting of αβ bound to the Ii degradation intermediates Ii-p10, Ii-p18, or Ii-p22; αβm, mature SDS-resistant αβ dimer bound to either CLIP or peptide; HC, MHC class I heavy chain; α, mature class II alpha chain; α0, immature α chain; β, mature β-chain; Ii, full-length invariant chain; β0, immature β-chain; p10/p18/p22, COOH-terminal degradation intermediates of Ii; β2m, β-2 microglobulin). (B) Effect of LHVS on the degradation of Ii in mature wt DC. DC were metabolically labeled for 30 min, and chased for 0, 1, or 3 h as described, either in the presence (+) or the absence (–) of the CatS inhibitor LHVS at 3 nM concentration. Cell lysates were prepared without any further subcellular fractionation steps and directly analyzed by immunoprecipitation using the N22 antibody. After separation by 12.5% SDS-PAGE with (B) or without prior boiling of the samples (NB), the samples were visualized by autoradiography.
Figure 7
Figure 7
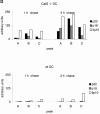
Quantitative assessment of trafficking and maturation of MHC molecules in wt and CatS−/− DC. Signals corresponding to individual polypeptides from Fig. 6 A were quantified by densitometry and plotted to assess the maturation and subcellular distribution of MHC class II molecules in DC from wt and CatS−/− mice. (A) Trafficking of MHC class I heavy chain in wt and CatS−/− DC. (B) Trafficking of total MHC class II molecules in wt and CatS−/− DC. The signal retrieved from the mature α-chain in relation to the signal from total α-chain was plotted. (C) Subcellular distribution of mature MHC class II complexes (αβm) in wt and CatS−/− DC. (D) Subcellular distribution of the Ii degradation intermediates p22, p18, and Iip10 in DC from wt and CatS−/− mice.
Figure 7
Figure 7
Quantitative assessment of trafficking and maturation of MHC molecules in wt and CatS−/− DC. Signals corresponding to individual polypeptides from Fig. 6 A were quantified by densitometry and plotted to assess the maturation and subcellular distribution of MHC class II molecules in DC from wt and CatS−/− mice. (A) Trafficking of MHC class I heavy chain in wt and CatS−/− DC. (B) Trafficking of total MHC class II molecules in wt and CatS−/− DC. The signal retrieved from the mature α-chain in relation to the signal from total α-chain was plotted. (C) Subcellular distribution of mature MHC class II complexes (αβm) in wt and CatS−/− DC. (D) Subcellular distribution of the Ii degradation intermediates p22, p18, and Iip10 in DC from wt and CatS−/− mice.
Figure 8
Figure 8
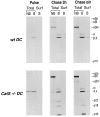
Surface labeling of MHC class II molecules in DC from wt and CatS−/− cells. Flt3-induced DC from wt (upper panels) and CatS−/− (lower panels) mice were pulsed with [35S]cysteine/methionine for 60 min, and chased 3 h and overnight (o/n), respectively. At each chase point the cell surface was biotinylated as described. The samples were immunoprecipitated with N22 to retrieve total cellular MHC class II. 10% of this immunoprecipitate was divided into two and loaded on a SDS-PAGE without or with prior boiling (total, NB, and B). The remaining 90% were reimmunoprecipitated with streptavidin-agarose beads, extensively washed, and analyzed on the same 12.5% SDS-PAGE after boiling (surf, surface; B, boiled).
Figure 9
Figure 9
125I–LHVS-PhOH as a new active site–directed probe to visualize enzymatically active CatS. (A) Structure of 125I–LHVS-PhOH. (B) DC from wt and CatS−/− mice were labeled with 125I–LHVS-PhOH. Active CatS was visualized after separation on SDS-PAGE. (C) Subcellular distribution of active CatS. DC from wt and CatS−/− were subjected to subcellular fractionation as described (see Fig. 3 A). Fractions 1–8 of the 27% Percoll gradient (including the lysosomal peak A) and the entire 10% Percoll gradient (separating late endosomes [peak B] from the remainder [peak C]) were labeled with 125I–LHVS-PhOH, separated by 12.5% SDS-PAGE, and visualized by autoradiography (left panel, high-density fractions 1–8 including peak A; right panel, 10% Percoll gradient of the low density fractions, peak B, and peak C; upper panel, wild-type DC; lower panel, CatS−/− DC).

Similar articles

Cited by

References

    1. Amigorena S., Webster P., Drake J., Newcomb J., Cresswell P., Mellman I. Invariant chain cleavage and peptide loading in major histocompatibility complex class II vesicles. J. Exp. Med. 1995;181:1729–1741 . - PMC - PubMed
    1. Bakke O., Dobberstein B. MHC class II-associated invariant chain contains a sorting signal for endosomal compartments. Cell. 1990;63:707–716 . - PubMed
    1. Banchereau J., Steinman R.M. Dendritic cells and the control of immunity. Nature. 1998;392:245–252 . - PubMed
    1. Bijlmakers M.J., Benaroch P., Ploegh H.L. Mapping functional regions in the lumenal domain of the class II-associated invariant chain. J. Exp. Med. 1994;180:623–629 . - PMC - PubMed
    1. Brown M.S., Goldstein J.L. The SREBP pathwayregulation of cholesterol metabolism by proteolysis of a membrane-bound transcription factor. Cell. 1997;89:331–340 . - PubMed

Publication types

MeSH terms