. 1999 Nov 15;190(10):1427-38.
doi: 10.1084/jem.190.10.1427.

A role for the Tec family tyrosine kinase Txk in T cell activation and thymocyte selection

Affiliations

A role for the Tec family tyrosine kinase Txk in T cell activation and thymocyte selection

C L Sommers et al. J Exp Med. .

Abstract

Recent data indicate that several members of the Tec family of protein tyrosine kinases function in antigen receptor signal transduction. Txk, a Tec family protein tyrosine kinase, is expressed in both immature and mature T cells and in mast cells. By overexpressing Txk in T cells throughout development, we found that Txk specifically augments the phospholipase C (PLC)-gamma1-mediated calcium signal transduction pathway upon T cell antigen receptor (TCR) engagement. Although Txk is structurally different from inducible T cell kinase (Itk), another Tec family member expressed in T cells, expression of the Txk transgene could partially rescue defects in positive selection and signaling in itk(-)(/)(-) mice. Conversely, in the itk(+/+) (wild-type) background, overexpression of Txk inhibited positive selection of TCR transgenic thymocytes, presumably due to induction of cell death. These results identify a role for Txk in TCR signal transduction, T cell development, and selection and suggest that the Tec family kinases Itk and Txk perform analogous functions.


Figures
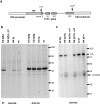
Figure 1
Figure 1
Txk overexpression in transgenic mice. (a) Transgenic construct for expressing Txk. txk cDNA expression is driven by the human CD2 promoter and enhancer. Sequences from TCR-ζ including intronic sequences were included to enhance message stability. (b) Metabolic labeling and immunoprecipitation. Thymocytes from txk homozygous (txk tg/tg), txk hemizygous (txk tg), or nontransgenic (wt) mice were subjected to metabolic labeling using [35S]methionine and cysteine before immunoprecipitation (IP) with anti-Txk or anti-Lck polyclonal antiserum. Anti-Lck was used to show equivalent loading. In lane 2, an excess of the peptide used for immunization in preparing the anti-Txk antiserum (p1) was included in the immunoprecipitation. Molecular mass markers (in kD) are shown at the right. (c) In vitro kinase assay. In lanes 1–4, extracts from thymocytes from wild-type and txk hemizygous transgenic mice were immunoprecipitated with anti-Txk antiserum followed by incubation with [32P]ATP and the substrate enolase to assess kinase activity. Increased levels of phosphorylated enolase are seen in the Txk transgenic thymocytes. This phosphorylation is blocked by peptide 1 (p1, used for immunization in preparing the Txk antiserum) but not by another peptide from Txk (p2). Extracts from LNs (ln) were also analyzed. The identity of the high molecular mass phosphorylated peptide (∼116 kD) is unknown.
Figure 2
Figure 2
Phenotype of txk transgenic mice. (a) Thymocytes from txk transgenic (txk tg) and nontransgenic (non-tg) mice were stained with anti-CD4, anti-CD8, and anti-CD3 and analyzed by flow cytometry. CD4 vs. CD8 profiles are shown with percentages of thymocytes indicated within quadrants of the dot plots. Histograms of anti-CD3 staining are also shown. (b) LN cells from txk transgenic and nontransgenic mice were stained with anti-CD4, anti-CD8, and anti-CD3 and analyzed by flow cytometry as described in a.
Figure 3
Figure 3
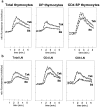
The calcium response is enhanced in Txk transgenic thymocytes and lymphocytes. (a) Wild-type B6 and Txk transgenic thymocytes were preloaded with the calcium dye indo-1 and then stimulated by the addition of 1.0 μg of biotin-H57 (anti–TCR-β) antibody at 30 s and 20 μg of streptavidin (cross-linking agent) at 60 s. Fluorescence indicating bound and unbound indo-1 was monitored over time (5 min), and kinetic data were analyzed using WinList software. The cells were also stained with anti-CD4 and anti-CD8, so that calcium flux data could be obtained on gated thymocyte subpopulations. (b) B6 and Txk transgenic LN cells were treated and analyzed as described in a, except that 0.5 μg of biotin-H57 was used. Results are representative of at least four separate experiments.
Figure 4
Figure 4
Enhanced phosphorylation of PLC-γ1 in txk transgenic thymocytes. Extracts from wild-type B6 (wt thy) or txk transgenic thymocytes (txk tg thy) were made immediately after removal from the animal (ex vivo), after a period of incubation of 5 h at 37°C (rested), or after treatment with biotinylated anti-TCR (H57) and anti-CD4 (GK1.5) and cross-linking with streptavidin for 5 min. The control lane represents immunoprecipitation of lysis buffer instead of cell extract. Immunoprecipitations with anti–PLC-γ1 (top two rows) or anti–ZAP-70 (bottom two rows) were performed. In the first row, the PLC-γ1 immunoprecipitation (IP) was followed with an antiphosphotyrosine (4G10) blot. The blot was stripped and reprobed with an additional PLC-γ1 antibody (second row). In the third and fourth rows, the ZAP-70 immunoprecipitation was followed by antiphosphotyrosine (p-tyr) blotting. The region of the blot showing ZAP-70 (70 kD) is shown in the third row, and the region showing TCR-ζ (p21 and p23 forms) is shown in the last row.
Figure 5
Figure 5
Time course of PLC-γ1 phosphorylation after TCR cross-linking. Thymocytes from nontransgenic (WT), txk hemizygous transgenic (txk tg), and txk homozygous transgenic (txk tg/tg) mice were isolated, enumerated, and rested at 37°C for 5 h. Rested thymocytes (108) were then incubated with biotinylated anti-TCR (H57) and anti-CD4 (GK1.5) on ice and cross-linked with streptavidin at 37°C for the times indicated. Cell lysates were immunoprecipitated (IP) with anti–PLC-γ1, resolved by 10% SDS-PAGE, transferred to polyvinylidene difluoride membranes, and blotted with antiphosphotyrosine (p-tyr). The blot was subsequently stripped and reprobed with PLC-γ1 antibody. Numbers indicate relative band intensity of the antiphosphotyrosine blot as determined by densitometric scanning and averaging to the relative intensity of bands obtained by PLC-γ1 reblotting.
Figure 6
Figure 6
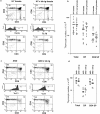
Positive selection in Txk transgenic mice. (a) Positive selection in txk transgenic (tg) × H-Y TCR transgenic female mice. Thymocytes from representative H-Y female and H-Y × txk transgenic littermate female mice were stained with anti-CD4, anti-CD8, and T3.70 (which stains the H-Y transgenic TCR) antibodies and analyzed by flow cytometry. CD4 vs. CD8 profiles of total (top panel) and T3.70hi (gated) thymocytes (bottom panel) are shown. Percentages of thymocytes are shown within the dot plots. Single color histograms of T3.70 staining are also shown to indicate placement of the gates. (b) Thymocyte numbers in H-Y female and H-Y × Txk transgenic littermate female mice. Numbers of total thymocytes, DP thymocytes, and CD8 SP thymocytes (gated as T3.70hi) for n = 11 mice are shown. Identical symbols indicate individual experiments in which age-matched mice were chosen. (c) Positive selection in txk × AND TCR littermate transgenic mice. Thymocytes from representative AND and txk × AND transgenic mice were stained with anti-CD4, anti-CD8, and anti-Vα11 (which recognizes the TCR-α chain of the AND transgenic TCR) antibodies and analyzed by flow cytometry. CD4 vs. CD8 profiles of total (top panel) and Vα11hi (gated) thymocytes (bottom panel) are shown. Single color histograms of Vα11 staining are also shown to indicate placement of the gates. (d) Thymocyte numbers in AND and txk × AND littermate transgenic mice. Numbers of total thymocytes, DP, and CD4 SP thymocytes (gated as Vα11hi) for n = 6 mice. Identical symbols indicate individual experiments in which age-matched mice were chosen.
Figure 7
Figure 7
Txk reconstitution of itk −/− mice. Positive selection was assessed in TCR transgenic itk +/− or itk −/− thymocytes in the presence or absence of the txk transgene. Thymocytes from H-Y TCR transgenic female and AND TCR transgenic mice were stained with anti-CD4, anti-CD8, and T3.70 (which stains the H-Y transgenic TCR) or anti-Vα11 (which stains the AND transgenic TCR) and analyzed by flow cytometry. CD4 vs. CD8 profiles of total (top panels in each set) or T3.70hi (gated) or Vα11hi (gated) thymocytes (bottom panels in each set) are shown. Percentages of thymocytes are shown within the dot plots. Histograms of T3.70 and Vα11 staining on total thymocytes are shown below the dot plots to indicate placement of the gates. Numbers above the plots indicate the total number of thymocytes. The results shown are representative of at least three experiments.
Figure 8
Figure 8
(a) The calcium response is enhanced in itk −/− txk transgenic thymocytes. Thymocytes from itk −/− and itk −/− txk transgenic mice were preloaded with the calcium dye indo-1 and then stimulated by the addition of 5.0 μg of biotin-H57 (anti–TCR-β) antibody at 30 s and 20 μg of streptavidin (cross-linking agent) at 60 s. Fluorescence indicating bound and unbound indo-1 was monitored over time (5 min), and kinetic data were analyzed using WinList software. The cells were also stained with anti-CD4 and anti-CD8, so that calcium flux data could be obtained on gated DP thymocytes. Ratio fluorescence (violet/blue, y axis) is plotted against time (x axis). (b) Time course of PLC-γ1 phosphorylation after TCR cross-linking. Thymocytes from itk −/− or itk −/− txk hemizygous transgenic (itk−/−, txk tg) mice were isolated and enumerated. Thymocytes (108) were then incubated with biotinylated anti-TCR (H57) and anti-CD4 (GK1.5) on ice and cross-linked with streptavidin at 37°C for the times indicated. Cell lysates were immunoprecipitated with anti–PLC-γ1, resolved by 10% SDS-PAGE, transferred to polyvinylidene difluoride membranes, and blotted with antiphosphotyrosine (p-tyr). The blot was subsequently stripped and reprobed with PLC-γ1 antibody to assess loading consistency.
Figure 8
Figure 8
(a) The calcium response is enhanced in itk −/− txk transgenic thymocytes. Thymocytes from itk −/− and itk −/− txk transgenic mice were preloaded with the calcium dye indo-1 and then stimulated by the addition of 5.0 μg of biotin-H57 (anti–TCR-β) antibody at 30 s and 20 μg of streptavidin (cross-linking agent) at 60 s. Fluorescence indicating bound and unbound indo-1 was monitored over time (5 min), and kinetic data were analyzed using WinList software. The cells were also stained with anti-CD4 and anti-CD8, so that calcium flux data could be obtained on gated DP thymocytes. Ratio fluorescence (violet/blue, y axis) is plotted against time (x axis). (b) Time course of PLC-γ1 phosphorylation after TCR cross-linking. Thymocytes from itk −/− or itk −/− txk hemizygous transgenic (itk−/−, txk tg) mice were isolated and enumerated. Thymocytes (108) were then incubated with biotinylated anti-TCR (H57) and anti-CD4 (GK1.5) on ice and cross-linked with streptavidin at 37°C for the times indicated. Cell lysates were immunoprecipitated with anti–PLC-γ1, resolved by 10% SDS-PAGE, transferred to polyvinylidene difluoride membranes, and blotted with antiphosphotyrosine (p-tyr). The blot was subsequently stripped and reprobed with PLC-γ1 antibody to assess loading consistency.

Similar articles

Cited by

References

    1. Sommers C.L., Huang K., Shores E.W., Grinberg A., Charlick D.A., Kozak C.A., Love P.E. Murine txka protein tyrosine kinase gene regulated by T cell activation. Oncogene. 1995;11:245–251. - PubMed
    1. Hu Q., Davidson D., Schwartzberg P.L., Macchiarini F., Lenardo M.J., Bluestone J., Matis L.A. Identification of Rlk, a novel protein tyrosine kinase with predominant expression in the T cell lineage. J. Biol. Chem. 1995;270:1928–1934. - PubMed
    1. Haire R.N., Litman G.W. The murine form of TXK, a novel TEC kinase expressed in thymus maps to chromosome 5. Mamm. Genome. 1995;6:476–480. - PubMed
    1. Tsukada S., Saffran D.C., Rawlings D.J., Parolini O., Allen R.C., Klisak I., Sparkes R.S., Kubagawa H., Mohandas T., Quan S. Deficient expression of a B cell cytoplasmic tyrosine kinase in human X-linked agammaglobulinemia. Cell. 1993;72:279–290. - PubMed
    1. Yamada N., Kawakami Y., Kimura H., Fukamachi H., Baier G., Altman A., Kato T., Inagaki Y., Kawakami T. Structure and expression of novel protein-tyrosine kinases, Emb and Emt, in hematopoietic cells. Biochem. Biophys. Res. Commun. 1993;192:231–240. - PubMed

Substances