. 1999 Nov 15;521 Pt 1(Pt 1):3-17.
doi: 10.1111/j.1469-7793.1999.00003.x.

Basolateral proteinase-activated receptor (PAR-2) induces chloride secretion in M-1 mouse renal cortical collecting duct cells

Affiliations

Basolateral proteinase-activated receptor (PAR-2) induces chloride secretion in M-1 mouse renal cortical collecting duct cells

M Bertog et al. J Physiol. .

Abstract

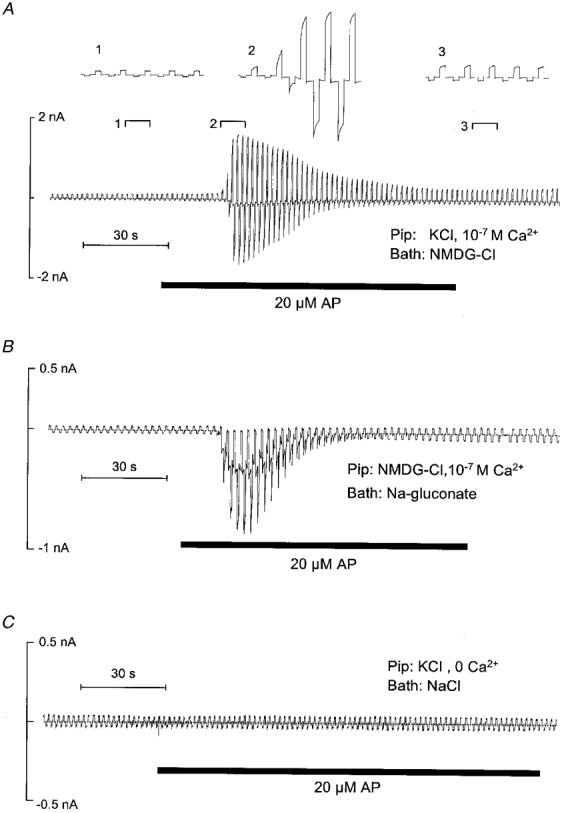
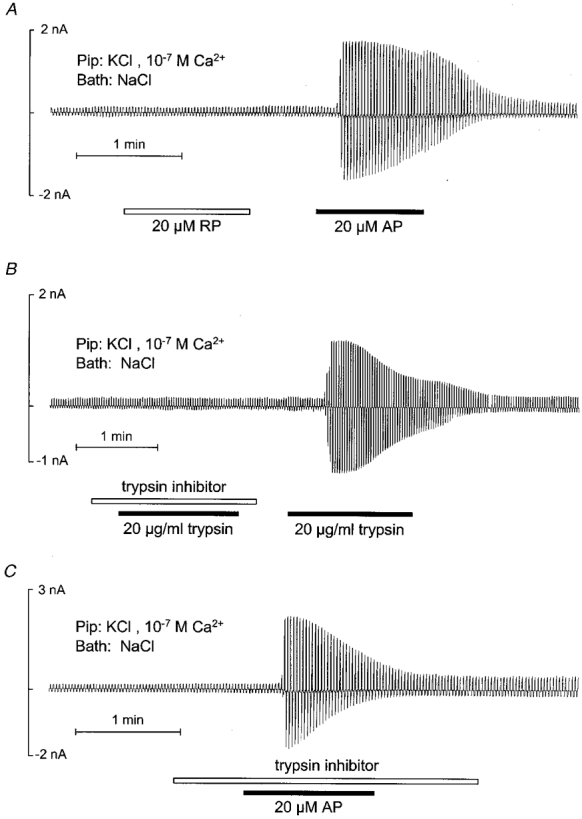
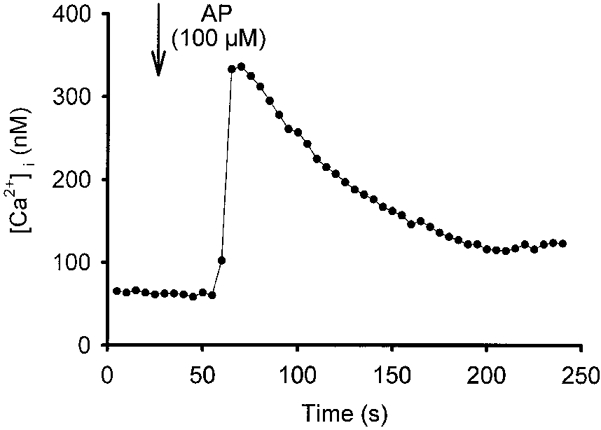
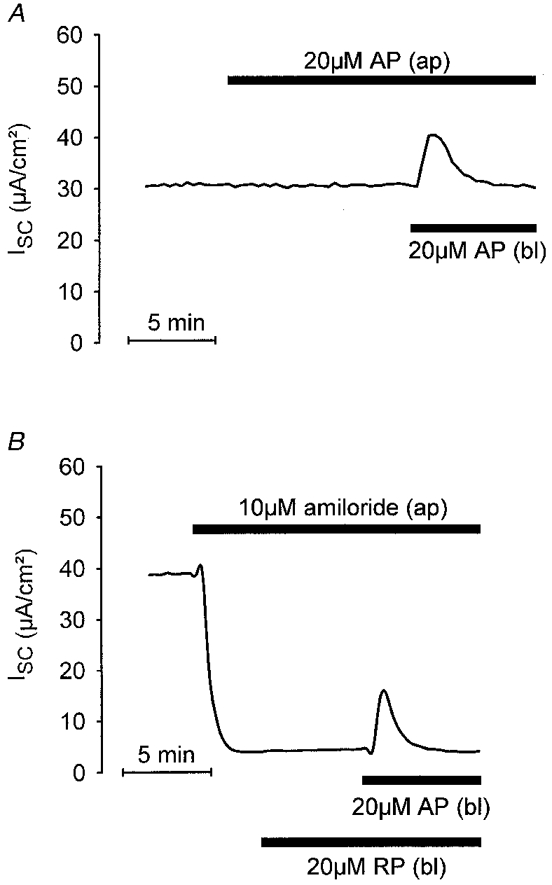
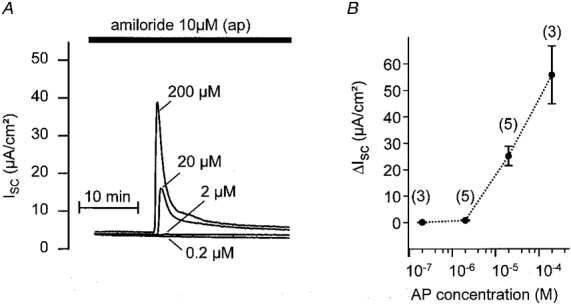
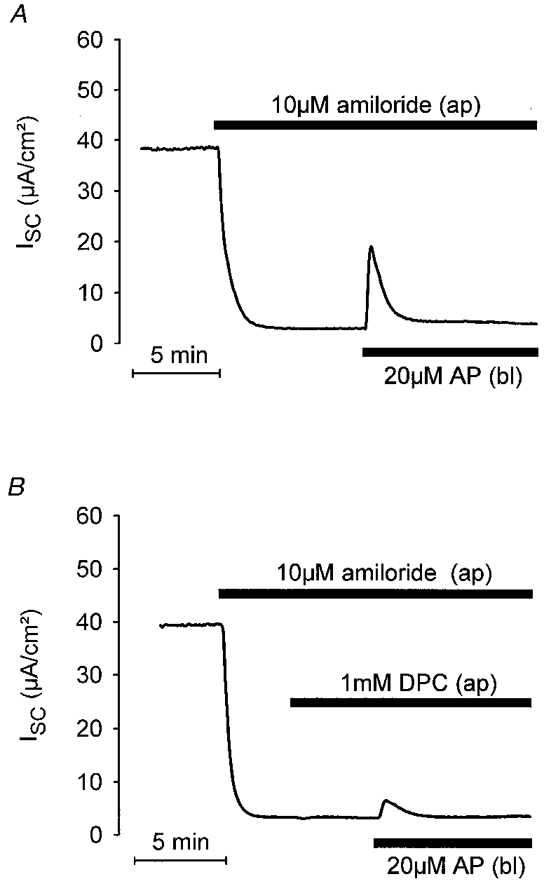
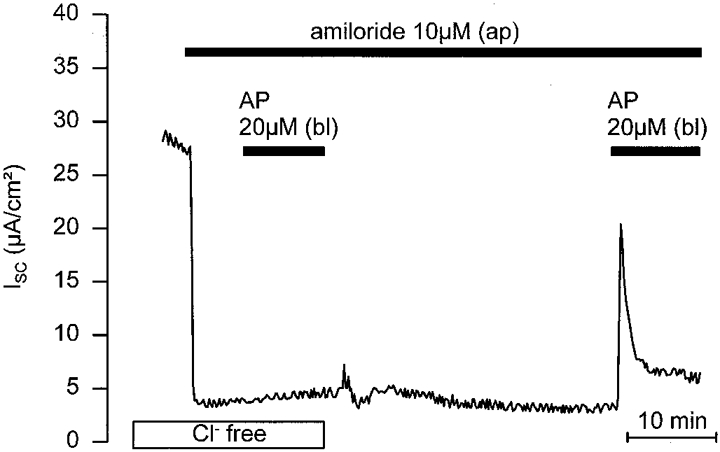
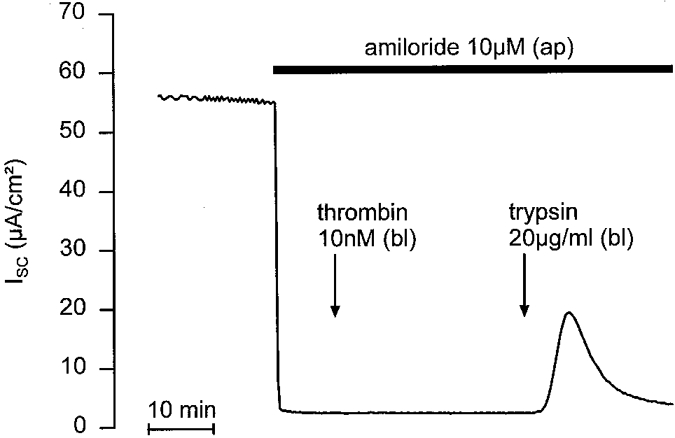
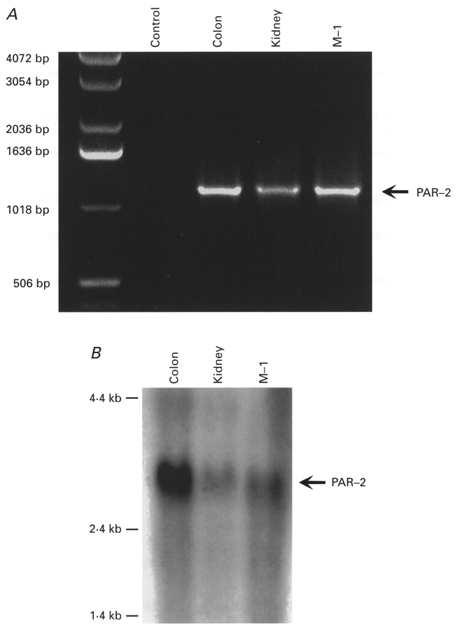
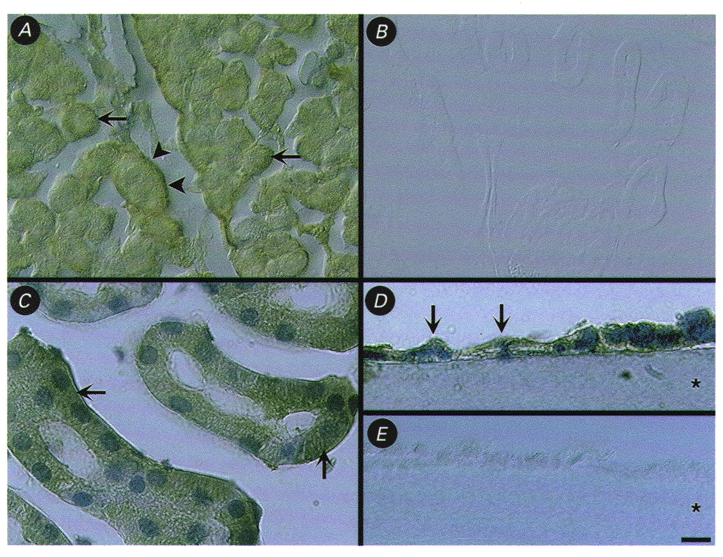
1. Using RT-PCR, Northern blot analysis, and immunocytochemistry, we confirmed renal expression of proteinase-activated receptor (PAR-2) and demonstrated its presence in native renal epithelial and in cultured M-1 mouse cortical collecting duct (CCD) cells. 2. We investigated the effects of a PAR-2 activating peptide (AP), corresponding to the tethered ligand that is exposed upon trypsin cleavage, and of trypsin on M-1 cells using patch-clamp, intracellular calcium (fura-2) and transepithelial short-circuit current (ISC) measurements. 3. In single M-1 cells, addition of AP elicited a concentration-dependent transient increase in the whole-cell conductance. Removal of extracellular Na+ had no effect while removal of Cl- prevented the stimulation of outward currents. The intracellular calcium concentration increased significantly upon application of AP while a Ca2+-free pipette solution completely abolished the electrical response to AP. 4. In confluent monolayers of M-1 cells, apical application of AP had no effect on ISC whereas subsequent basolateral application elicited a transient increase in ISC. This increase was not due to a stimulation of electrogenic Na+ absorption since the response was preserved in the presence of amiloride. 5. The ISC response to AP was reduced in the presence of the Cl- channel blocker diphenylamine-2-carboxylic acid on the apical side and abolished in the absence of extracellular Cl-. 6. Trypsin elicited similar responses to those to AP while application of a peptide (RP) with the reverse amino acid sequence of AP had no effect on whole-cell currents or ISC. 7. In conclusion, our data suggest that AP or trypsin stimulates Cl- secretion by Ca2+-activated Cl- channels in M-1 CCD cells by activating basolateral PAR-2.


Figures

Figure 1
Figure 1. PAR-2 activating peptide (AP) stimulates Ca2+-activated Cl currents in single M-1 cells
Representative whole-cell current traces that were recorded while the pipette voltage was repeatedly stepped from 0 to ± 120 mV for 400 ms are shown. Application of AP (20 μM) is indicated by bars below the traces. A, effect of AP in the absence of extracellular Na+, which was replaced by 145 mM of the impermeant cation NMDG (Bath: NMDG-Cl). The insets (1, 2, 3) show the indicated portions of the current trace on an expanded time scale. The pipette solution contained 130 mM KCl and had a free Ca2+ concentration of 10−7 M (Pip: KCl, 10−7 M Ca2+). B, effect of AP in the absence of extracellular Cl, replaced by gluconate (Bath: Na-gluconate). In the pipette solution K+ was replaced by NMDG (Pip: NMDG-Cl, 10−7 M Ca2+). C, effect of AP in the absence of intracellular Ca2+. The 130 mM KCl pipette solution was nominally Ca2+ free and contained 1 mM EGTA (Pip: KCl, 0 Ca2+); the bath solution was standard NaCl bath solution (Bath: NaCl).
Figure 2
Figure 2. Specificity of the effects of AP and trypsin on whole-cell currents of single M-1 cells
The experimental protocol was similar to that described in the legend to Fig. 1 and drugs were applied as indicated. A, sequential application of reverse peptide (RP) and AP (20 μM). B, effect of trypsin (20 μg ml−1) in the presence and absence of trypsin inhibitor (40 μg ml−1). C, application of AP in the presence of trypsin inhibitor.
Figure 3
Figure 3. AP increases intracellular Ca2+ in M-1 cells
Using fura-2, [Ca2+]i was monitored in a single M-1 cell. AP was added to the bath at the time indicated by the arrow to give a final concentration of 100 μM, and subsequently remained in the bath.
Figure 4
Figure 4. Basolateral application of AP transiently stimulates short-circuit current (ISC) in confluent monolayers of M-1 cells
Equivalent ISC was continuously monitored and two traces from representative experiments are shown. Drugs were applied as indicated either to the apical (ap) or to the basolateral (bl) side of the monolayer. A, basolateral but not apical application of 20 μM AP had an effect on ISC. B, the effect of basolateral AP was preserved in the presence of 10 μM apical amiloride; basolateral application of 20 μM RP had no effect.
Figure 5
Figure 5. Effect of AP is concentration dependent
In parallel experiments, M-1 monolayers from the same batch of cells were exposed to different concentrations of basolateral AP in the presence of apical amiloride (10 μM). A, individual ISC traces with the corresponding AP concentrations (0·2, 2, 20 or 200 μM). B, summary of similar experiments to those shown in A with the number of observations given above each data point (mean ±s.e.m.).
Figure 6
Figure 6. Cl channel blocker inhibits the ISC response to basolateral AP
The ISC response to basolateral AP was reduced by the Cl channel blocker DPC applied to the apical side of M-1 cells. A and B show representative ISC traces from matched M-1 cell monolayers to illustrate the effects of basolateral application of AP in the absence and presence of apical DPC (1 mM), respectively.
Figure 7
Figure 7. Extracellular Cl removal abolishes the ISC response to basolateral AP
M-1 cells were Cl depleted by incubation in Cl-free bath solution for 30–40 min prior to the application of basolateral AP (Cl replaced by gluconate with 6 mM calcium gluconate included to compensate for the Ca2+ chelating effect of gluconate). In the continuous absence of apical and basolateral Cl (Cl free) basolateral application of AP was without effect. Re-exposure of the monolayer to Cl resulted in a recovery of the AP response.
Figure 8
Figure 8. Effect of trypsin on ISC
Two representative ISC traces are shown. In A, 20 μg ml−1 trypsin was applied to the basolateral side of the M-1 monolayer followed by a basolateral application of 20 μM AP. In B, the sequence of application was reversed.
Figure 9
Figure 9. Thrombin has no effect on ISC
In the continuous presence of apical amiloride (10 μM), basolateral application of thrombin (10 nM) was followed by basolateral application of trypsin (20 μg ml−1) to test the responsiveness of the epithelium.
Figure 10
Figure 10. RT-PCR and Northern blot evidence for PAR-2 expression in M-1 CCD cells
A, agarose gel electrophoresis of products from RT-PCR reactions performed with primers based on mouse PAR-2 and using RNA from M-1 cells, mouse kidney and colon. Products of the predicted size of 1200 bp were detected except in the negative control in which water was used instead of RNA. B, Northern blot analysis using a cDNA probe to mouse PAR-2 and RNA isolated from M-1 cells, mouse kidney and colon. A primary transcript of the predicted size of approximately 3 kb was detected in M-1 cells, as well as in intact kidney and colon.
Figure 11
Figure 11. Localisation of immunoreactive PAR-2 in mouse kidney and M-1 cells by immunoperoxidase staining
A and C, localisation of PAR-2 immunoreactivity in intracellular locations (arrows) and in the basal region (arrowheads) of epithelial cells of the renal cortex. D, localisation of PAR-2 immunoreactivity (arrows) in cultured M-1 CCD cells grown on Cellagen filter. B and E, control staining of renal cortex (B) and M-1 cells (E) with PAR-2 antibody pre-absorbed with the peptide used for immunisation. Images in A and B were taken using Nomarski optics. Specimens in C and D were counterstained with Haematoxylin. The asterisks in D and E indicate the filter. Scale bar = 25 μm in A and B, 10 μm in C, 5 μm in D and E.

References

    1. Böhm SK, Khitin LM, Grady EF, Aponte G, Payan DG, Bunnett NW. Mechanisms of desensitization and resensitization of proteinase-activated receptor-2. Journal of Biological Chemistry. 1996a;271:22003–22016. - PubMed
    1. Böhm SK, Kong W, Brömme D, Smeekens SP, Anderson DC, Connolly A, Kahn M, Nelken NA, Coughlin SR, Payan DG, Bunnett NW. Molecular cloning, expression and potential functions of the human proteinase-activated receptor-2. Biochemical Journal. 1996b;314:1009–1016. - PMC - PubMed
    1. Chalfant ML, Peterson-Yantorno K, O'Brien TG, Civan MM. Regulation of epithelial Na+ channels from M-1 cortical collecting duct cells. American Journal of Physiology. 1996;271:F861–870. - PubMed
    1. Chraibi A, Vallet V, Firsov D, Hess SK, Horisberger J-D. Protease modulation of the activity of the epithelial sodium channel expressed in Xenopus oocytes. Journal of General Physiology. 1998;111:127–138. - PMC - PubMed
    1. Christine CW, Laskowski FH, Gitter AH, Beyenbach KW, Gross P, Frömter E. Anion channels in the apical membrane of collecting duct principal cells in culture. Cellular Physiology and Biochemistry. 1991;1:76–88. - PubMed

Publication types

MeSH terms

LinkOut - more resources