

Early postnatal switch in magnesium sensitivity of NMDA receptors in rat CA1 pyramidal cells
- PMID: 10562337
- PMCID: PMC2269654
- DOI: 10.1111/j.1469-7793.1999.00099.x
Early postnatal switch in magnesium sensitivity of NMDA receptors in rat CA1 pyramidal cells
Abstract
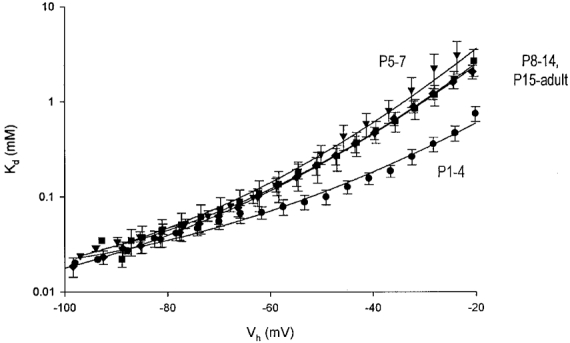
1. Whole-cell patch-clamp recordings of iontophoretically induced N-methyl-D-aspartate (NMDA) receptor-mediated currents (INMDA) in CA1 pyramidal cells in hippocampal slices from 1- to 40-day-old rats were used to characterize developmental changes in the Mg2+ sensitivity of NMDA receptors. 2. The dose-response relations for extracellular Mg2+ blockade of INMDA indicated a high affinity binding of Mg2+ to NMDA receptors at membrane potentials more negative than -60 mV, independent of postnatal age. 3. Depolarizing the cells unblocked NMDA receptors by decreasing their affinity for Mg2+. The efficacy of depolarization in unblocking NMDA receptors markedly increased after postnatal day 4 (P4), endowing the receptors with a greater voltage dependence. 4. The NR2B subunit-specific NMDA antagonist ifenprodil reduced INMDA in pyramidal cells of all ages. The sensitivity of INMDA to ifenprodil was greatest during the first postnatal week and decreased thereafter, indicating an enhanced contribution of NR2B subunit-containing NMDA receptors to INMDA in the first week after birth. 5. In the first postnatal week, the ifenprodil-insensitive INMDA component had a lower voltage dependence than the total INMDA. In older pyramidal cells, the voltage dependence of the ifenprodil-insensitive component and the total INMDA were similar. 6. In another set of CA1 pyramidal cells, single-cell reverse transcription and polymerase chain reaction (RT-PCR) were used to characterize concomitant developmental changes in NMDA subunit mRNA expression. The mRNA for the NR2D subunit was detected during the first postnatal week in 50 % of the cells and disappeared thereafter. The proportion of cells expressing the NR2A and NR2B subunits remained relatively constant throughout the first five postnatal weeks. 7. We conclude that NMDA receptors in hippocampal CA1 pyramidal cells are effectively blocked by Mg2+ at all ages. After 4 days they become much less sensitive to Mg2+ at depolarized membrane potentials. This postnatal switch in voltage control of Mg2+ binding to NMDA receptors may be due to the downregulation of NR2D subunit expression in developing CA1 pyramidal cells.
Figures


 , B) remains relatively constant. NR2D mRNA (
 , D) expression decreases from 50% in the youngest age group to nil in the oldest age group. NR2C mRNA (▪, C) was detected in one adult cell only.
Similar articles
-
Synaptic NMDA receptors in developing mouse hippocampal neurones: functional properties and sensitivity to ifenprodil.J Physiol. 1996 Dec 1;497 ( Pt 2)(Pt 2):437-55. doi: 10.1113/jphysiol.1996.sp021779. J Physiol. 1996. PMID: 8961186 Free PMC article.
-
Fractional Ca2+ currents through somatic and dendritic glutamate receptor channels of rat hippocampal CA1 pyramidal neurones.J Physiol. 1996 Mar 15;491 ( Pt 3)(Pt 3):757-72. doi: 10.1113/jphysiol.1996.sp021255. J Physiol. 1996. PMID: 8815209 Free PMC article.
-
Reduced Mg2+ blockade of synaptically activated N-methyl-D-aspartate receptor-channels in CA1 pyramidal neurons in kainic acid-lesioned rat hippocampus.Neuroscience. 1999;88(3):727-39. doi: 10.1016/s0306-4522(98)00253-x. Neuroscience. 1999. PMID: 10363813
-
Developmental changes in NMDA receptor glycine affinity and ifenprodil sensitivity reveal three distinct populations of NMDA receptors in individual rat cortical neurons.J Neurosci. 1998 Mar 15;18(6):1935-43. doi: 10.1523/JNEUROSCI.18-06-01935.1998. J Neurosci. 1998. PMID: 9482779 Free PMC article. Review.
-
Kindling, prenatal exposure to ethanol and postnatal development selectively alter responses of hippocampal pyramidal cells to NMDA.Adv Exp Med Biol. 1990;268:407-17. doi: 10.1007/978-1-4684-5769-8_45. Adv Exp Med Biol. 1990. PMID: 2150157 Review.
Cited by
-
Modulation of NMDA receptor properties and synaptic transmission by the NR3A subunit in mouse hippocampal and cerebrocortical neurons.J Neurophysiol. 2008 Jan;99(1):122-32. doi: 10.1152/jn.01044.2006. Epub 2007 Nov 14. J Neurophysiol. 2008. PMID: 18003876 Free PMC article.
-
Modulation of the NMDA Receptor Through Secreted Soluble Factors.Mol Neurobiol. 2016 Jan;53(1):299-309. doi: 10.1007/s12035-014-9009-x. Epub 2014 Nov 29. Mol Neurobiol. 2016. PMID: 25429903 Review.
-
Contribution of NMDA and AMPA receptors to temporal patterning of auditory responses in the inferior colliculus.J Neurosci. 2007 Feb 21;27(8):1954-63. doi: 10.1523/JNEUROSCI.2894-06.2007. J Neurosci. 2007. PMID: 17314291 Free PMC article.
-
Subtypes of NMDA receptors in new-born rat hippocampal granule cells.J Physiol. 2002 May 15;541(Pt 1):41-64. doi: 10.1113/jphysiol.2001.014001. J Physiol. 2002. PMID: 12015419 Free PMC article.
-
GluN2D-containing NMDA receptors-mediate synaptic currents in hippocampal interneurons and pyramidal cells in juvenile mice.Front Cell Neurosci. 2015 Mar 25;9:95. doi: 10.3389/fncel.2015.00095. eCollection 2015. Front Cell Neurosci. 2015. PMID: 25859181 Free PMC article.
References
-
- Audinat E, Lambolez B, Rossier J, Crepel F. Activity-dependent regulation of N-methyl-D-aspartate receptor subunit expression in rat cerebellar granule cells. European Journal of Neuroscience. 1994;6:1792–1800. - PubMed
-
- Ben-Ari Y, Cherubini E, Krnjevic K. Changes in voltage dependence of NMDA currents during development. Neuroscience Letters. 1988;94:88–92. - PubMed
-
- Bliss TV, Collingridge GL. A synaptic model of memory: long-term potentiation in the hippocampus. Nature. 1993;361:31–39. - PubMed
Publication types
MeSH terms
Substances
LinkOut - more resources
Full Text Sources
Miscellaneous