

Review
doi: 10.1101/gr.9.11.1106.
Exploring expression data: identification and analysis of coexpressed genes
Affiliations
- PMID: 10568750
- PMCID: PMC310826
- DOI: 10.1101/gr.9.11.1106
Item in Clipboard
Review
Exploring expression data: identification and analysis of coexpressed genes
Genome Res.
1999 Nov.
Abstract
Analysis procedures are needed to extract useful information from the large amount of gene expression data that is becoming available. This work describes a set of analytical tools and their application to yeast cell cycle data. The components of our approach are (1) a similarity measure that reduces the number of false positives, (2) a new clustering algorithm designed specifically for grouping gene expression patterns, and (3) an interactive graphical cluster analysis tool that allows user feedback and validation. We use the clusters generated by our algorithm to summarize genome-wide expression and to initiate supervised clustering of genes into biologically meaningful groups.
Figures
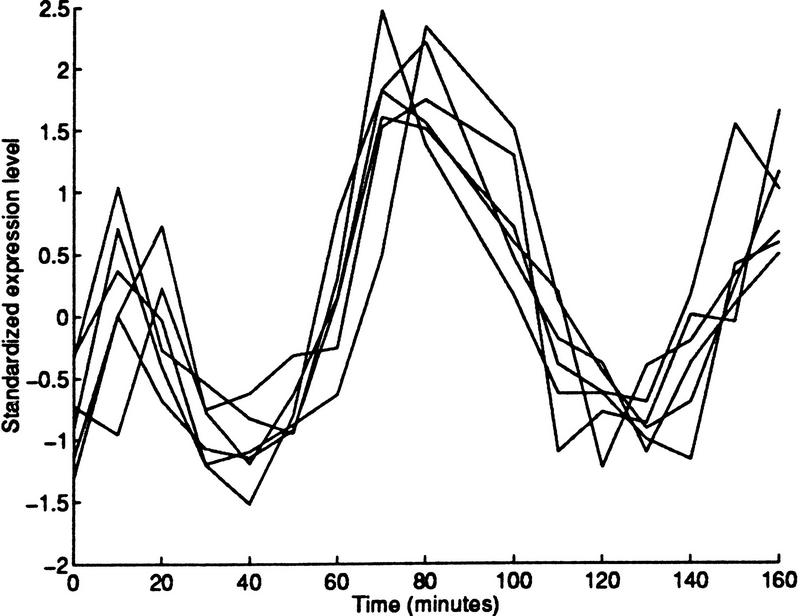
Expression levels of the six members of the MCM protein complex: MCM2, MCM3, MCM6, CDC46, CDC47, and CDC54. The data have been standardized by subtracting the mean and dividing by the standard deviation.
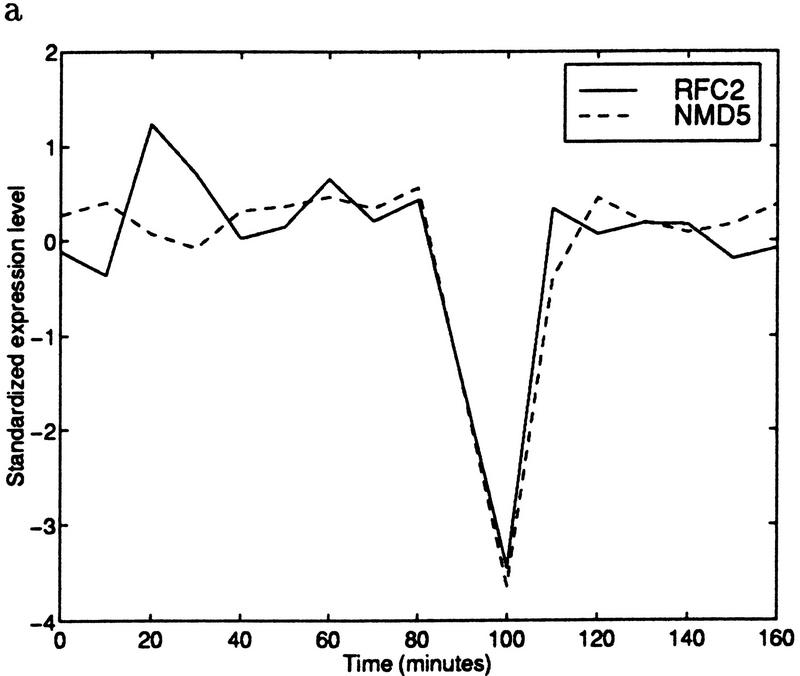
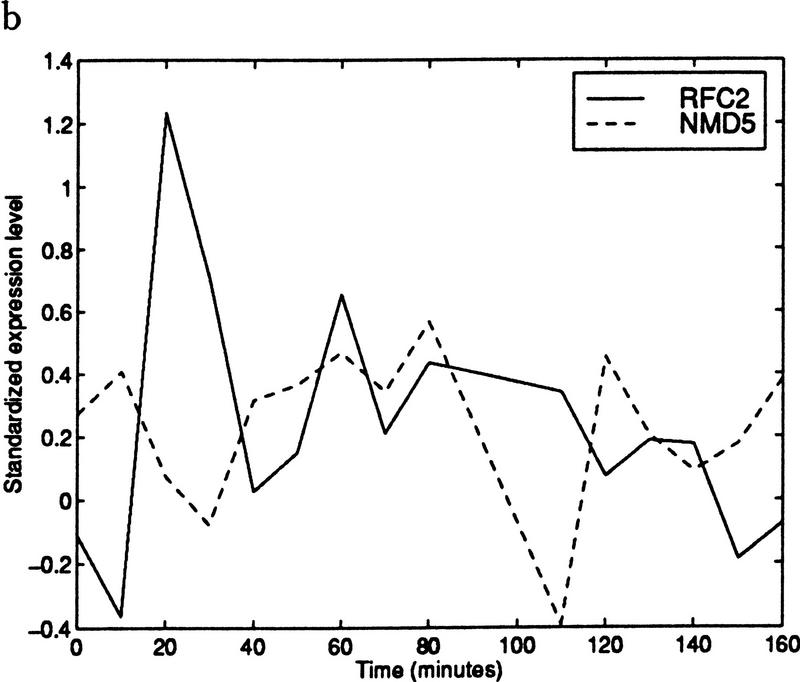
(a) Standardized expression data for YJR068W (RFC2) and YJR132W (NMD5). The gene pair has a correlation coefficient of 0.87. (b) Standardized expression data for the same two genes with time 100 removed. Using only the remaining points results in a correlation coefficient of −0.29. (Solid line) RFC2; (broken line) NMD5.
(a) Standardized expression data for YJR068W (RFC2) and YJR132W (NMD5). The gene pair has a correlation coefficient of 0.87. (b) Standardized expression data for the same two genes with time 100 removed. Using only the remaining points results in a correlation coefficient of −0.29. (Solid line) RFC2; (broken line) NMD5.
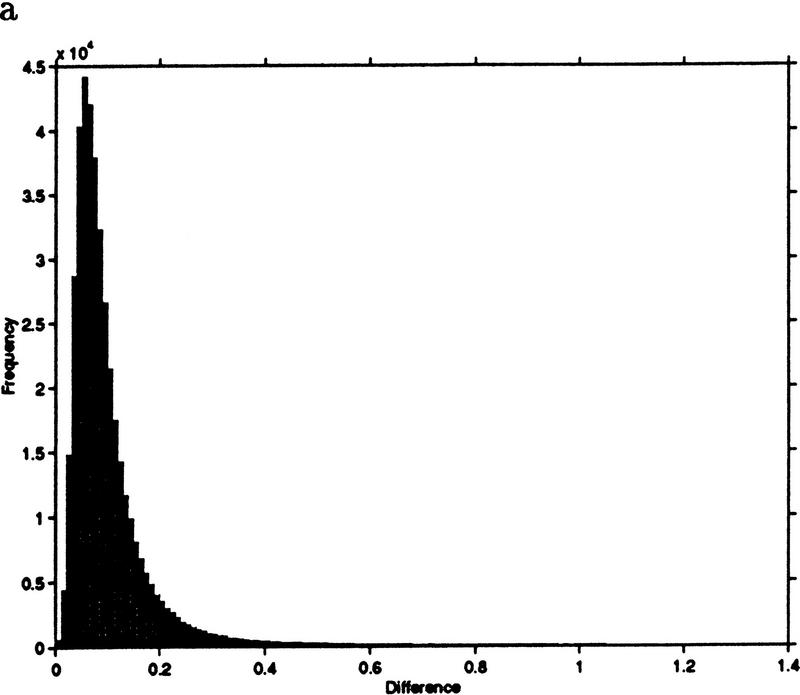
(a) Frequency histogram of the difference between correlation and jackknife correlation for gene pairs whose correlation exceeds 0.6. (b) An amplification of the tail of the histogram shown in a.
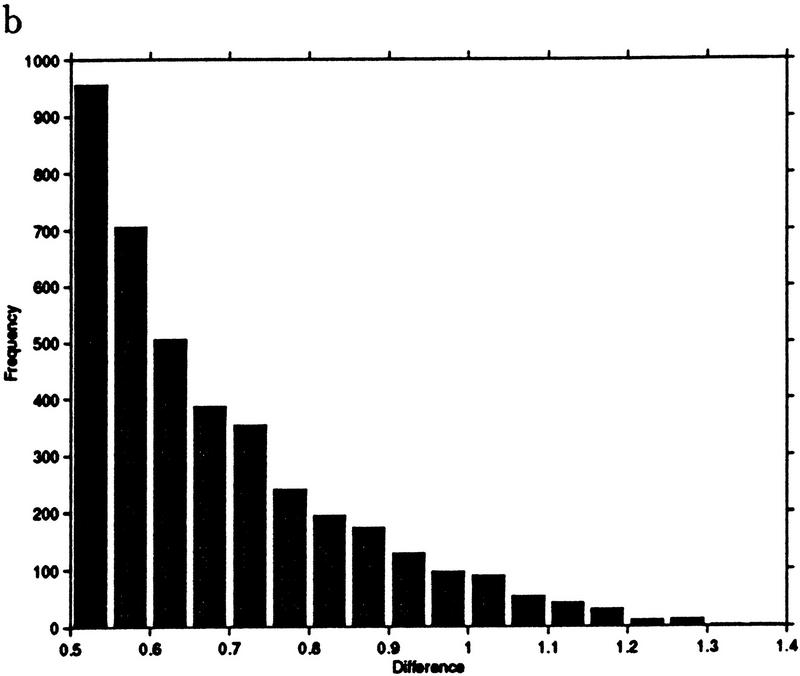
(a) Frequency histogram of the difference between correlation and jackknife correlation for gene pairs whose correlation exceeds 0.6. (b) An amplification of the tail of the histogram shown in a.
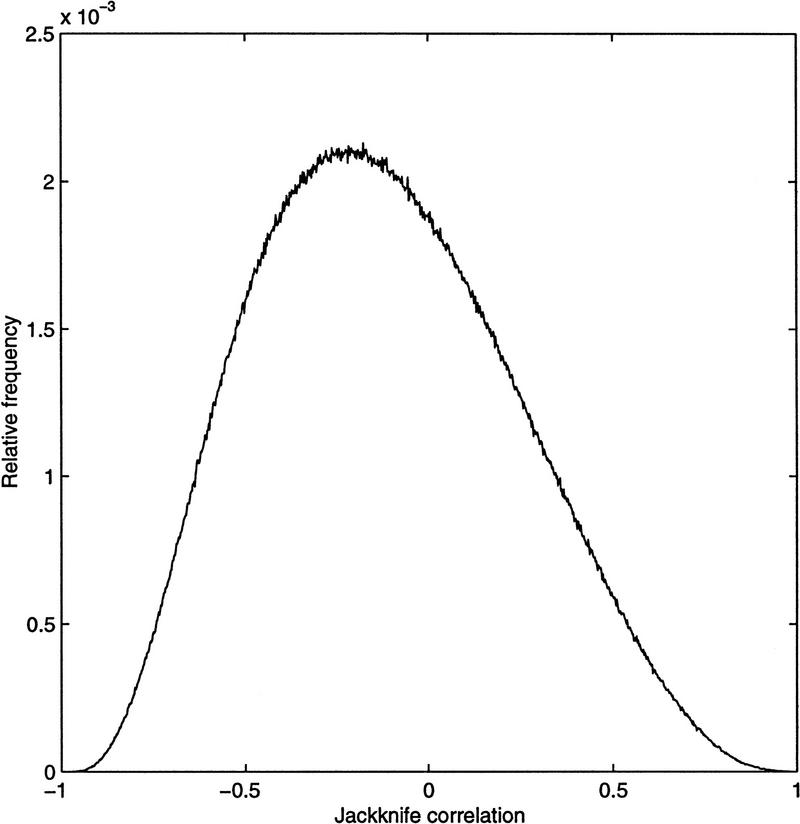
Relative frequency histogram of jackknife correlation values. All 8,688,196 pairwise scores are represented. The number of pairs in each bin is normalized by this total.
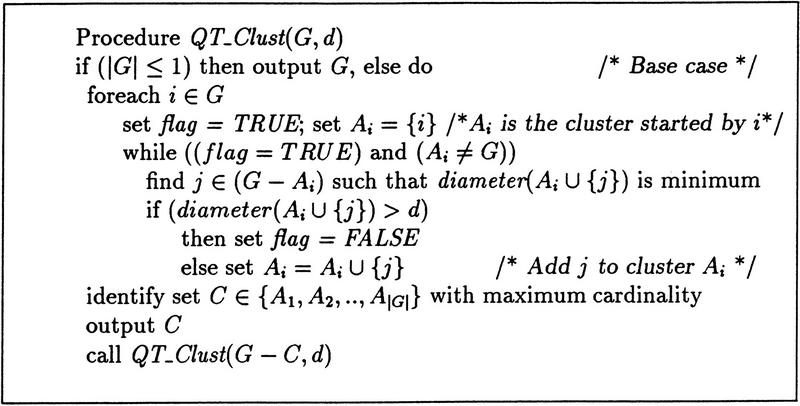
Algorithm QT_Clust takes as input the set G of ORFs and a diameter threshold d, and returns a set of clusters.
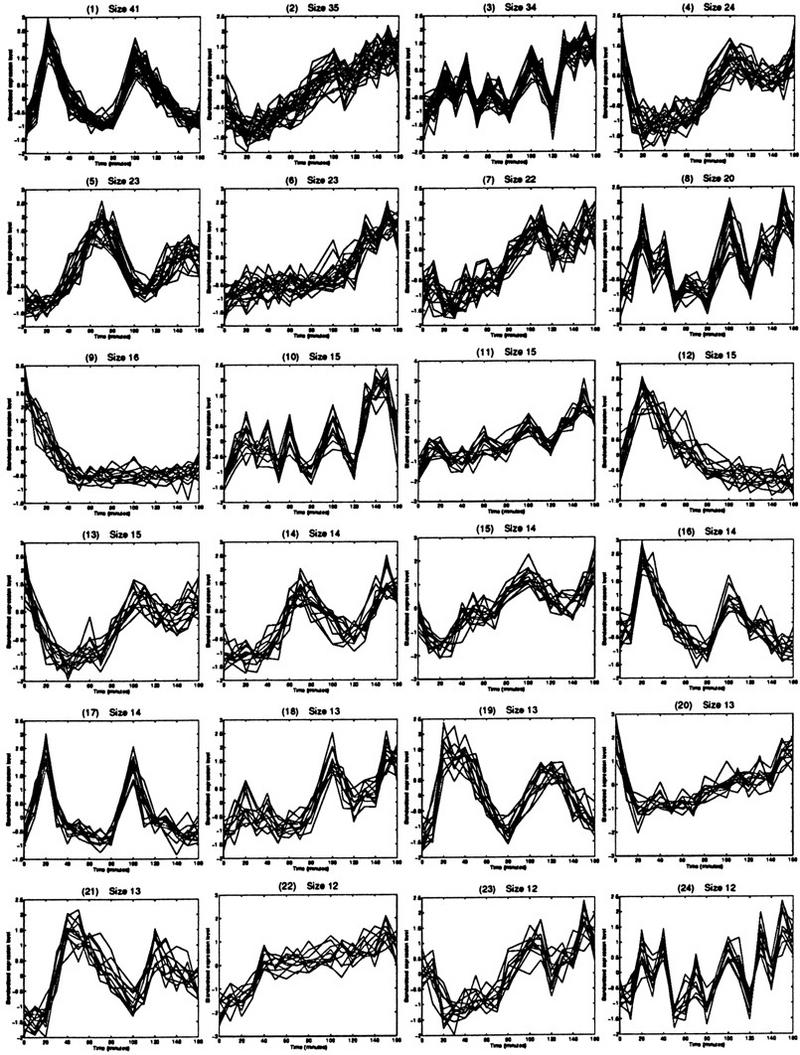
The 24 largest clusters found by QT_Clust. These plots give a good overview of the types of patterns found in the data.
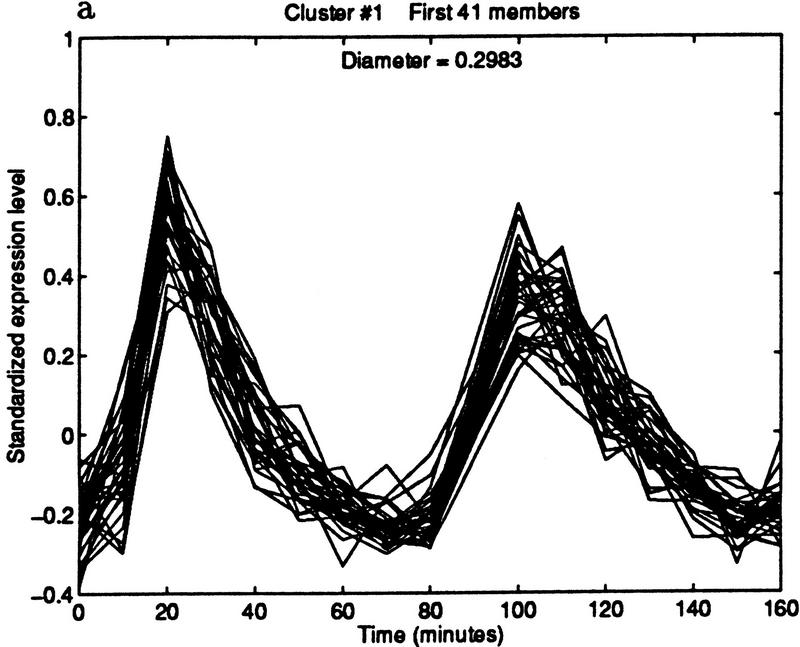
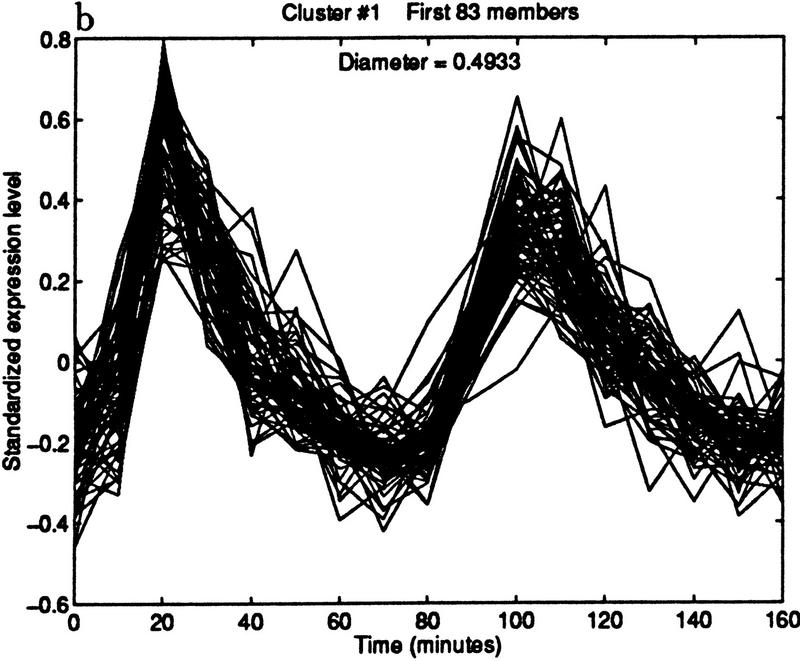
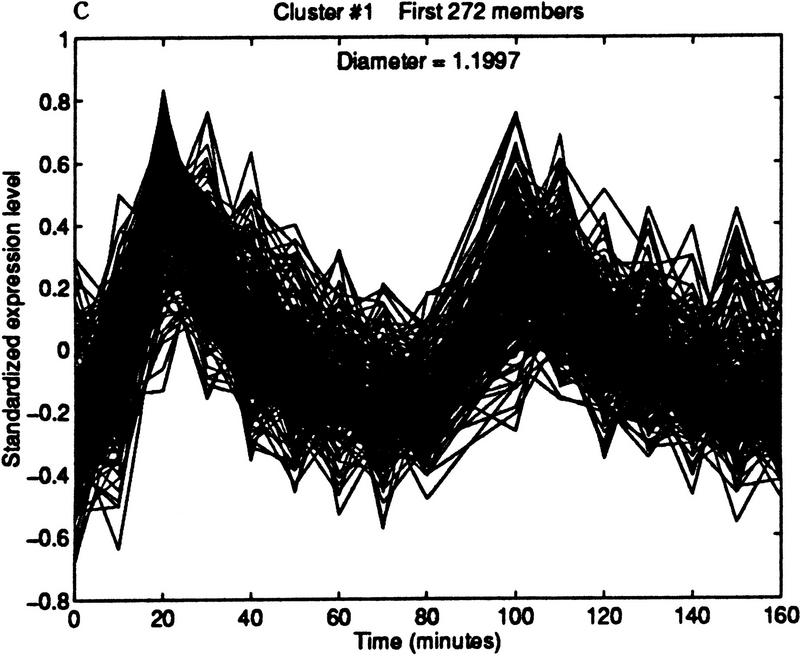
Iterative building of G1 cluster. (a) Forty-one elements within a diameter threshold of 0.3. (b) Eighty-three elements within a diameter of 0.5. The cluster is beginning to contain patterns that peak in phases other than G1. (c) By increasing the diameter threshold to 1.2, the cluster grows to 272 elements, but now clearly contains poorly matching patterns.
Iterative building of G1 cluster. (a) Forty-one elements within a diameter threshold of 0.3. (b) Eighty-three elements within a diameter of 0.5. The cluster is beginning to contain patterns that peak in phases other than G1. (c) By increasing the diameter threshold to 1.2, the cluster grows to 272 elements, but now clearly contains poorly matching patterns.
Iterative building of G1 cluster. (a) Forty-one elements within a diameter threshold of 0.3. (b) Eighty-three elements within a diameter of 0.5. The cluster is beginning to contain patterns that peak in phases other than G1. (c) By increasing the diameter threshold to 1.2, the cluster grows to 272 elements, but now clearly contains poorly matching patterns.
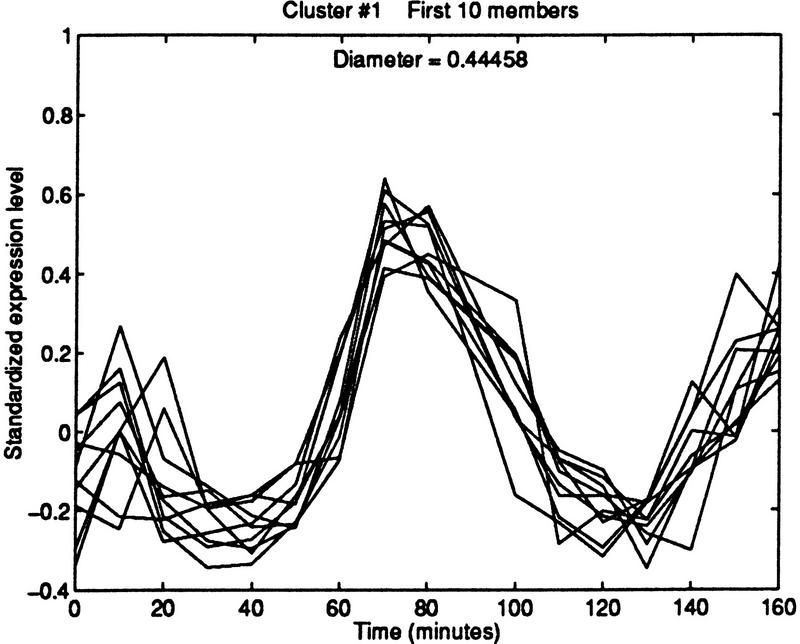
Iterative building of MCM cluster. The first 10 members of the cluster include 4 of the 5 members of the MCM family that were available to the clustering procedure.
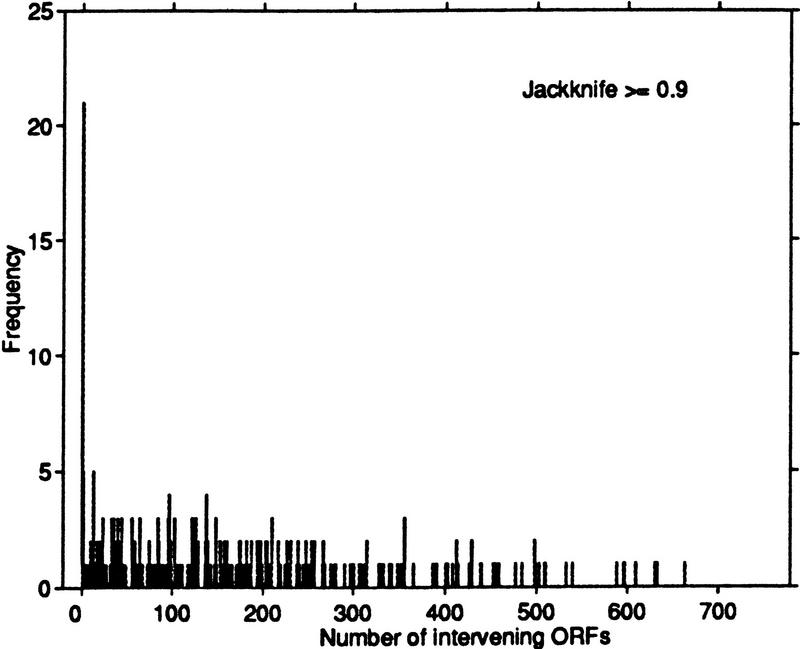
Histogram of the distance between ORFs with a jackknife correlation of at least 0.9. Distance is measured in terms of the number of intervening ORFs separating the members of the pair. A disproportionate number (21) are consecutive on their respective chromosomes.
References
-
- Cho R, Campbell M, Winzeler E, Steinmetz L, Conway A, Wodicka L, Wolfsberg T, Gabrielian A, Landsman D, Lockhart D, Davis R. A genome-wide transcriptional analysis of the mitotic cell cycle. Mol Cell. 1998;2:65–73. - PubMed
-
- Chu S, DeRisi J, Eisen M, Mulholland J, Botstein D, Brown P, Herskowitz I. The transcriptional program of sporulation in budding yeast. Science. 1998;282:699–705. - PubMed
-
- DeRisi J, Iyer V, Brown P. Exploring the metabolic and genetic control of gene expression on a genome scale. Science. 1997;278:680–686. - PubMed
-
- Efron B. The Jackknife, the Bootstrap, and Other Resampling Plans. CBMS-NSF Regional Conference Series in Applied Mathematics; 38. Society for Industrial & Applied Mathematics; 1982.
Publication types
MeSH terms
Grants and funding
LinkOut - more resources
Full Text Sources
Other Literature Sources
Molecular Biology Databases