. 1999 Dec;67(12):6558-64.
doi: 10.1128/IAI.67.12.6558-6564.1999.

Influence of environmental conditions on hydrogen peroxide formation by Streptococcus gordonii

Affiliations

Influence of environmental conditions on hydrogen peroxide formation by Streptococcus gordonii

J P Barnard et al. Infect Immun. 1999 Dec.

Abstract

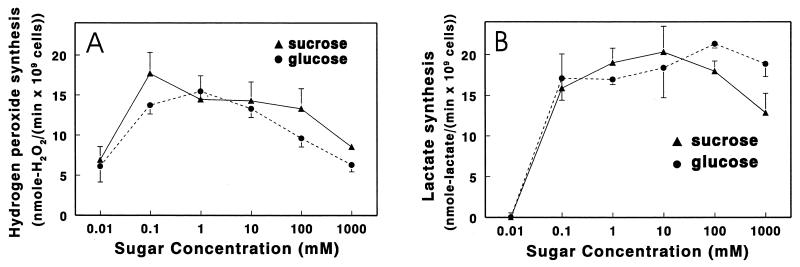
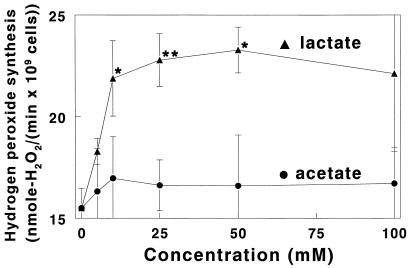
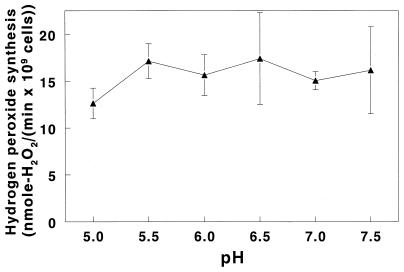
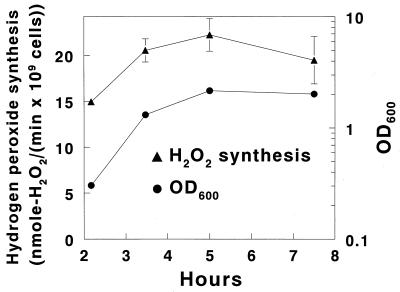
Hydrogen peroxide generated by viridans group streptococci has an antagonistic effect on many bacterial species, including a number of pathogens, in the oral environment. This study examines the influence of a variety of environmental conditions on rates of hydrogen peroxide synthesis by Streptococcus gordonii. Hydrogen peroxide was synthesized at every concentration of glucose and sucrose tested from 10 microM to 1 M, with the highest rates occurring at 0.1 mM sucrose and 1 mM glucose. S. gordonii appeared to have an intracellular store of polysaccharide which supported hydrogen peroxide formation even when the assay buffer contained no carbohydrate. Most heavy metal ions inhibited peroxidogenesis, and anaerobic conditions induced adaptive down-regulation of hydrogen peroxide synthesis; however, peroxidogenesis was generally insensitive to moderate increases in salt concentration, alteration of the mineral content of the assay solution, and changes in pH between 5.0 and 7.5. In contrast, stimulation of peroxidogenesis occurred in 1 mM Mg(2+) and 10 to 50 mM potassium L-lactate. Maximum peroxidogenesis occurred during the mid-logarithmic and late-logarithmic phases of bacterial growth. These bacterial responses may have significant implications for oral ecology and oral health.


Figures

FIG. 1
FIG. 1
Initial rates of hydrogen peroxide and l-lactic acid formation by S. gordonii CH1 in selected concentrations of glucose or sucrose. Cultures were grown to mid-logarithmic phase in TSBY–10 U of catalase per ml with vigorous shaking in air to obtain highly peroxidogenic cells. Cells were washed by repeated centrifugation and resuspension in 25 mM KH2PO4-K2HPO4 (pH 7.0)–1 mM MgCl2 containing the indicated concentration of glucose or sucrose. The accumulation of hydrogen peroxide or l-lactic acid was measured at 37°C over time to determine initial rates of hydrogen peroxide formation (A) and l-lactic acid formation (B). In assay buffer which contained no carbohydrate, the rate of peroxidogenesis was 1.1 ± 0.3 nmol/(min · 109 cells). Results are means ± SD of three rate determinations at each concentration point.
FIG. 2
FIG. 2
Initial rates of hydrogen peroxide production by S. gordonii CH1 in 1 mM glucose and selected concentrations of potassium l-lactate and potassium acetate. Cells were grown and initial rates of hydrogen peroxide synthesis were measured as described in Materials and Methods and in the legend to Fig. 1. Results are means ± SD of three rate determinations at each concentration point, and asterisks denote the level of statistical significance between data for equal concentrations of potassium l-lactate and potassium acetate (∗, P < 0.05; ∗∗, P < 0.005).
FIG. 3
FIG. 3
Influence of pH on initial rates of hydrogen peroxide formation by S. gordonii CH1. Rates of hydrogen peroxide synthesis were measured as described in Materials and Methods and in the legend to Fig. 1, except that the assay solution was supplemented with 20 mM piperazine and 20 mM bis-Tris buffer. The glucose concentration for all determinations was 1 mM. Results are means ± SD of three rate determinations at each pH.
FIG. 4
FIG. 4
Initial rates of hydrogen peroxide production by S. gordonii CH1 harvested at various stages of growth. Streptococci were grown and rates of hydrogen peroxide synthesis were measured as described in Materials and Methods and in the legend to Fig. 1, except that a rapid filtration wash technique was used and cells were harvested at the early-logarithmic, mid-logarithmic, late-logarithmic, and stationary phases of growth. Turbidity of the cultures at time zero, as determined by measuring the OD600, was 0.043 ± 0.006. The glucose concentration for all determinations of hydrogen peroxide synthesis was 1 mM, and results are means ± SD of three rate determinations at each stage of growth. For each data point, error bars are shown only if they fall outside the plot symbol.

References

    1. Ali R W, Johannessen A C, Dahlen G, Socransky S S, Skaug N. Comparison of the subgingival microbiota of periodontally healthy and diseased adults in northern Cameroon. J Clin Periodontol. 1997;24:830–835. - PubMed
    1. Barnard J P, Stinson M W. The alpha-hemolysin of Streptococcus gordoniiis hydrogen peroxide. Infect Immun. 1996;64:3853–3857. - PMC - PubMed
    1. Bhaduri S, Demchick P H. Simple and rapid method for disruption of bacteria for protein studies. Appl Environ Microbiol. 1983;46:941–943. - PMC - PubMed
    1. Carlsson J, Edlund M B. Pyruvate oxidase in Streptococcus sanguisunder various growth conditions. Oral Microbiol Immunol. 1987;2:10–14. - PubMed
    1. Carlsson J, Iwami Y, Yamada T. Hydrogen peroxide excretion by oral streptococci and effect of lactoperoxidase-thiocyanate-hydrogen peroxide. Infect Immun. 1983;40:70–80. - PMC - PubMed

Publication types

MeSH terms

LinkOut - more resources