. 1999 Nov 23;96(24):13656-61.
doi: 10.1073/pnas.96.24.13656.

Insulin selectively increases SREBP-1c mRNA in the livers of rats with streptozotocin-induced diabetes

Affiliations

Insulin selectively increases SREBP-1c mRNA in the livers of rats with streptozotocin-induced diabetes

I Shimomura et al. Proc Natl Acad Sci U S A. .

Abstract

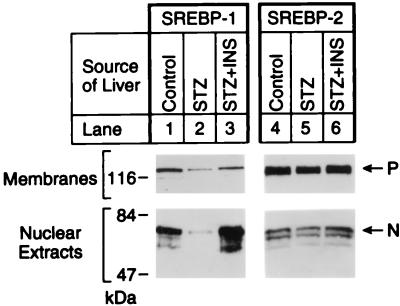
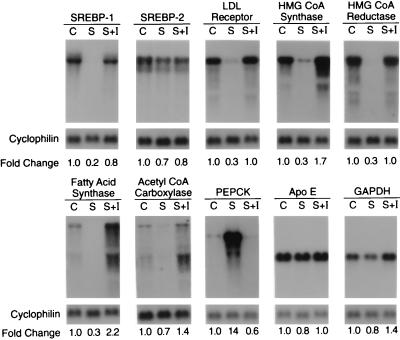
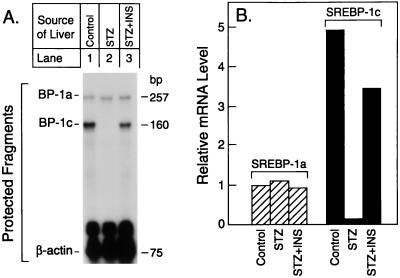
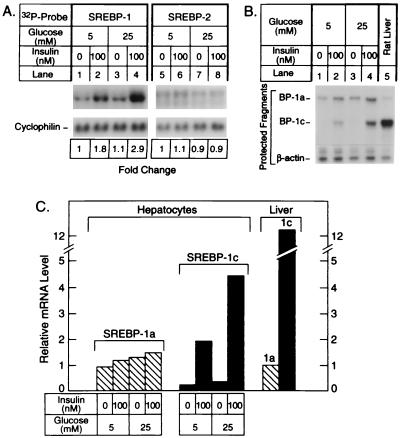
Sterol regulatory element binding proteins (SREBPs) enhance transcription of genes encoding enzymes of cholesterol and fatty acid biosynthesis and uptake. In the current experiments, we observed a decline in the mRNA encoding one SREBP isoform, SREBP-1c, in the livers of rats that were rendered diabetic by treatment with streptozotocin. There was no change in the mRNA encoding SREBP-1a, which is derived from the same gene as SREBP-1c but uses a different promoter. The ratio of SREBP-1c:1a transcripts fell 25-fold from 5:1 in control rats to 0.2:1 in the diabetic animals. The SREBP-1c mRNA rose nearly to normal, and the 1c:1a ratio increased 17-fold when the diabetic rats were treated for 6 h with insulin. These treatments produced no change in the mRNA for SREBP-2, which is encoded by a separate gene. The SREBP-1c mRNA also fell selectively in freshly isolated rat hepatocytes and rose when the cells were treated with insulin. Considered together with recent data on hepatocytes [Foretz, M., Pacot, C., Dugal, I., et al. (1999) Mol. Cell. Biol. 19, 3760-3768], the current in vivo studies suggest that insulin may stimulate lipid synthesis in the liver by selectively inducing transcription of the SREBP-1c gene.


Figures

Figure 1
Figure 1
Immunoblot analysis of SREBP-1 and -2 in membranes and nuclear extracts from livers of control rats and rats treated with STZ without or with INS. Livers from the three groups of rats in Table 1 (four male rats per group) were pooled, and aliquots of the membrane pellet (30 μg of protein) and nuclear extract (30 μg) were subjected to SDS/PAGE (8% gel). Immunoblot analysis was performed with 5 μg/ml rabbit anti-rat SREBP-1 IgG (lanes 1, 2, and 3) or anti-rat SREBP-2 IgG (lanes 4, 5, and 6) as the primary antibody and 0.25 μg/ml horseradish peroxidase-coupled donkey anti-rabbit IgG as the secondary antibody. Filters were exposed to Reflection NEF496 film for 15 s (lanes 1, 2, and 3) or 30 s (lanes 4, 5, and 6) at room temperature. P and N denote the precursor and cleaved nuclear forms of SREBP, respectively.
Figure 2
Figure 2
Amounts of various mRNAs in livers of control rats and rats treated with STZ without or with INS as measured by blot hybridization. The rats used in this experiment are described in Table 1. For each experimental group, total RNA isolated from the livers of four male rats were pooled, and 10 μg aliquots were subjected to electrophoresis and blot hybridization with the indicated 32P-labeled cDNA probe. The amount of radioactivity in each band was quantified as described in Materials and Methods. The -fold change in each mRNA of the STZ-treated diabetic group (S) and STZ-treated diabetic group supplemented with INS (S+I) relative to that of the control group (C) was calculated after correction for loading differences by measurement of cyclophilin mRNA. These values are shown below each blot.
Figure 3
Figure 3
(A) Relative amounts of mRNAs for SREBP-1a and -1c in the livers of rats treated with STZ without or with INS as measured by RNase protection. Total RNA was isolated from the livers of the three groups of rats described in Table 1. Aliquots of pooled RNA (10 μg) were hybridized in solution for 10 min at 68°C to a mixture of 32P-labeled cRNA probes for SREBP-1 and β-actin as described in Materials and Methods. After RNase digestion, the protected fragments were separated by gel electrophoresis and exposed to film for 16 h at −80°C. (B) Quantification of hepatic mRNAs for SREBP-1a and -1c. The data in (A) were quantified as described in Materials and Methods and normalized relative to the β-actin signal. The data for SREBP-1c mRNA are plotted as the -fold change relative to the SREBP-1a mRNA level in the control group.
Figure 4
Figure 4
(A) Amounts of mRNAs for total SREBP-1 (lanes 1–4) and SREBP-2 (lanes 5–8) in rat hepatocytes incubated with low or high glucose with or without INS. Hepatocytes were isolated from rat livers and incubated for 16 h with Medium 199 with Earle’s salts (5 mM glucose) containing 100 nM dexamethasone, 1 nM INS, 100 nM triiodothyronine, and antibiotics as described in Materials and Methods. The cell monolayers were then incubated for 6 h in the same medium containing the indicated concentration of INS and glucose. The cells were homogenized, and aliquots of total RNA (10 μg) were subjected to blot hybridization as described in the legend to Fig. 2. (B) Relative amounts of mRNAs for SREBP-1a and -1c as measured by RNase protection. Aliquots of total RNA were isolated from the hepatocytes and subjected to the RNase protection assay as described in the legend to Fig. 3 (lanes 1–4). As a control, a 10-μg aliquot of total RNA pooled from the livers of four ad libitum-fed male Sprague–Dawley rats was used (lane 5). (C) Quantification of mRNAs for SREBP-1a and -1c. The data from B were quantified as described in Materials and Methods and normalized relative to the β-actin signal. The data for SREBP-1a and -1c mRNA are plotted as the -fold change relative to the SREBP-1a mRNA level in rat liver.

Comment in

References

    1. Hillgartner F B, Salati L M, Goodridge A G. Physiol Rev. 1995;75:47–76. - PubMed
    1. McGarry J D. Science. 1992;258:766–770. - PubMed
    1. Horton J D, Bashmakov Y, Shimomura I, Shimano H. Proc Natl Acad Sci USA. 1998;95:5987–5992. - PMC - PubMed
    1. Foretz M, Pacot C, Dugail I, Lemarchand P, Guichard C, Lièpvre X L, Berthelier-Lubrano C, Spiegelman B, Kim J B, Ferré P, et al. Mol Cell Biol. 1999;19:3760–3768. - PMC - PubMed
    1. Wang X, Briggs M R, Hua X, Yokoyama C, Goldstein J L, Brown M S. J Biol Chem. 1993;268:14497–14504. - PubMed

Publication types

MeSH terms