. 1999 Nov 23;96(24):13668-73.
doi: 10.1073/pnas.96.24.13668.

The structural basis for the oriented assembly of a TBP/TFB/promoter complex

Affiliations

The structural basis for the oriented assembly of a TBP/TFB/promoter complex

O Littlefield et al. Proc Natl Acad Sci U S A. .

Abstract

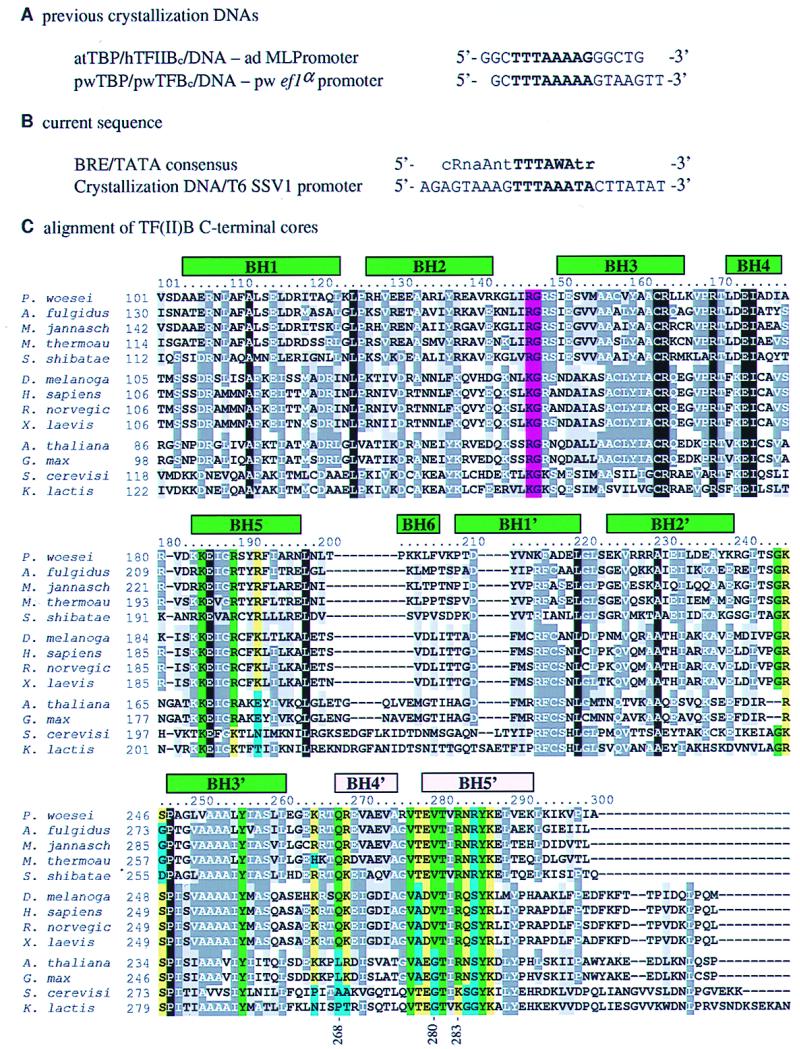
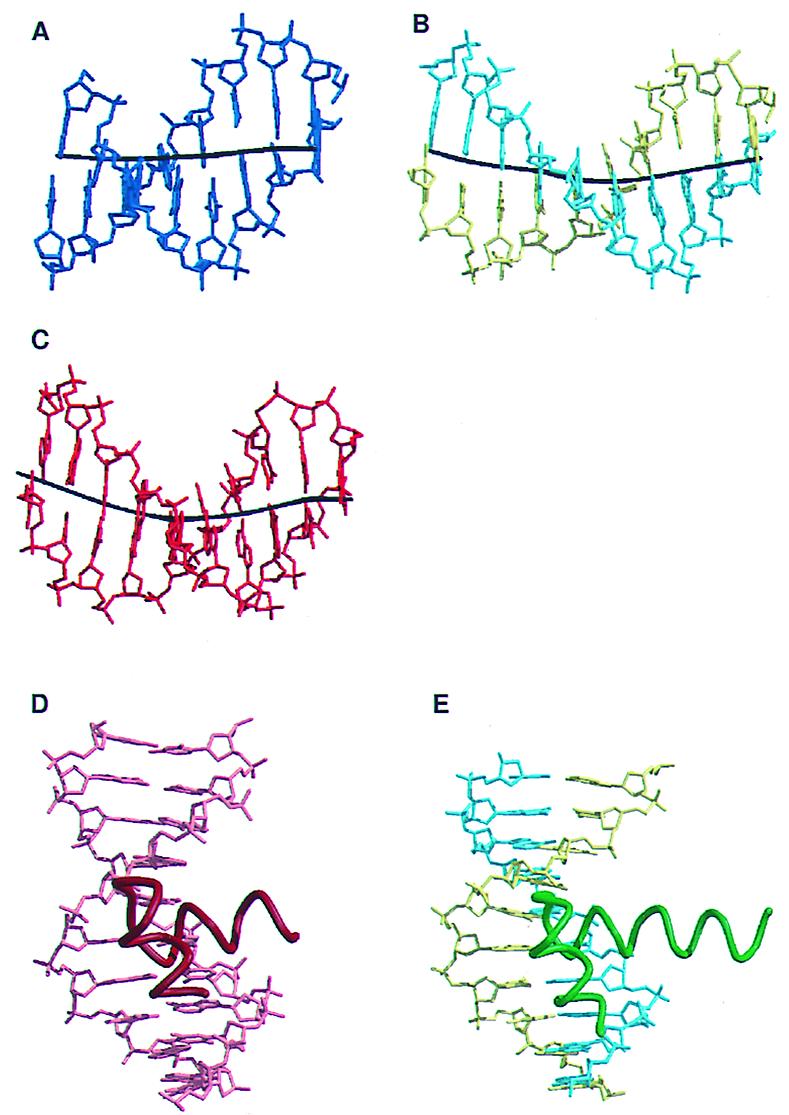
Recently the definition of the metazoan RNA polymerase II and archaeal core promoters has been expanded to include a region immediately upstream of the TATA box called the B recognition element (BRE), so named because eukaryal transcription factor TFIIB and its archaeal orthologue TFB interact with the element in a sequence-specific manner. Here we present the 2.4-A crystal structure of archaeal TBP and the C-terminal core of TFB (TFB(c)) in a complex with an extended TATA-box-containing promoter that provides a detailed picture of the stereospecific interactions between the BRE and a helix-turn-helix motif in the C-terminal cyclin repeat of TFB(c). This interaction is important in determining the level of basal transcription and explicitly defines the direction of transcription.


Figures

Figure 1
Figure 1
Oligonucleotides and sequence alignment. (A) Oligonucleotides used in previous crystal structures (14, 15, 20). The abbreviations used are as follows: h, human; at, Arabidopsis thaliana; pw, Pyrococcus woesei; TF(II)Bc, C-terminal core of TF(II)B; and ad MLPromoter, adenovirus major late promoter. (B) Comparison of the archaeal BRE consensus (18) with the oligonucleotide used in the current TBP/TFB/DNA structure. (C) clustalw (21) alignment of the C-terminal cores of TFB and TFIIB. The TFBs listed (and their database accession numbers) are from Pyrococcus woesei (P29095), Archaeoglobus fulgidus (AE001014), Methanococcus jannaschii (AAB98771), Methanobacterium thermoautotrophicum (AE000864), and Sulfolobus shibatae (AAA81380). The metazoan TFIIBs listed are from Drosophila melanogaster (AAA79093), Homo sapiens (AAA61149), Rattus norvegicus (CAA46766), and Xenopus laevis (CAA44668). The plant TFIIBs listed are from Arabidopsis thaliana (AAC35529) and Glycine max (AAB09756). The fungal TFIIBs listed are from Saccharomyces cerevisiae (AAB68135) and Kluyveromyces lactis (AAA35258). Conservation is indicated as follows: white text on a black background, completely conserved; white text on a dark gray background, conserved; black text on a light gray background, similar; black text on a white background, unconserved; black text on a light green background, conserved in all metazoan and archaeal proteins and contacts BRE; black text on a light yellow background, similar and contacts BRE; black text on a light blue background, unconserved and contacts BRE; and black text on a magenta background, contacts the DNA downstream of the TATA box. Helices are indicated as green boxes above the sequence alignment, labeled using the nomenclature of Nikolov et al. (9). The two helices of the helix–turn–helix (HTH) motif are colored pink. Residues explicitly mentioned in the text are indicated by numbers underneath the alignment. C was made with boxshade [maintained by K. Hofmann (khofmann@isrec-sun1.unil.ch) and M. D. Baron (michael.baron@bbsrc.ac.uk)].
Figure 2
Figure 2
Overall view of the TBP/TFBc/DNA complex. TBP is shown as a ribbon diagram with the N-terminal repeat colored red and the C-terminal repeat colored pink. TFBc is shown as a ribbon diagram with the N-terminal cyclin repeat colored dark green and the C-terminal cyclin repeat colored green with the HTH highlighted in magenta. The DNA is shown as a stick drawing with the sense strand in cyan and the antisense strand in yellow. The TATA box is colored blue and orange. (A) View of the complex looking down the distorted double-helical axis of the TATA-box DNA. The upstream DNA is nearest the viewer. (B) View of the complex rotated from the orientation in A by 90° about the vertical axis. The arrow points in the direction of the start site of initiation. (C) View of the complex, highlighting the TFBc/BRE interaction. (D) Stereo diagram of a (2FoFc) electron-density map contoured at 1 rms deviation, showing contacts between TFBc and the phosphate backbone of the BRE upstream of the TATA box. Red dots represent water molecules. (E) Same view as D with hydrogen bonds shown as dashed black lines. The phosphates are numbered with respect to the TATA-box sequence. Figures were created with bobscript (28) and raster-3d (29).
Figure 3
Figure 3
Details of the specific interactions between TFBc and the BRE. (A) Stereo diagram of the residues involved in sequence-specific contacts between TFBc and the major groove of the DNA in the BRE. (B) Schematized representation of the protein/DNA interactions in the complex. The red and green boxes represent residues from TBP and TFBc, respectively, that contact the DNA. The approximate locations of the β-strands of TBP are shown as pink stripes. Hydrogen bonds are shown as dashed lines, salt bridges are solid lines, and van der Waals contacts are shown as a solid line with a bar at the end or by a plain box overlaying the DNA site. The DNA is represented with circles, pentagons, and rectangles for the phosphates, ribose moieties, and bases, respectively. (C) Superposition of the C-terminal cyclin domains of TFBc from the current and previous TBP/TFBc/DNA complexes with the DNA. The current structure is shown in the same color scheme as in Fig. 2 with the −5 and −6 bases displayed. The previous structure of the archaeal complex (20) is shown as purple and dark blue for TFBc and the DNA, respectively, with the +5 and +6 bases displayed. The HTH structural motif is shown in vivid color, while the rest of the C-terminal cyclin domain of TFBc is shown in faded color. The surface of the major groove clearly forms a closer and more extensive contact with TFBc in the current structure. (D) A side view of the superposition shown in C. The DNAs are displayed as tubes running through the phosphate backbone. The DNA in the current structure can be seen bending up toward TFBc, allowing the protein to contact more of the major groove. Figures were created with bobscript (28), molscript (32), and raster-3d (29).
Figure 4
Figure 4
Comparison to other HTH protein/DNA complexes. (A) A stick diagram of the downstream DNA from the previously determined structure of the TBP/TFBc/DNA complex. (B) A stick diagram of the upstream DNA from the current structure of the TBP/TFBc/DNA complex. (C) A stick diagram of the DNA from the PU.1/DNA complex (30). PU.1 is a member of the ETS winged HTH DNA-binding domains. In A, B, and C, the helical axes of the DNAs are shown as black lines. The PU.1 DNA and the upstream DNA from the current structure show the bend typical of HTH-bound DNA, whereas the downstream DNA from the previous determined structure of the archaeal TBP/TFBc/promoter complex is straighter. (D) The HTH and DNA from the λ repressor/operator complex (31). (E) The HTH and upstream DNA from the current TBP/TFBc/DNA complex. In D and E the DNAs are shown as stick figures and the HTHs are shown as coils.

References

    1. Hausner W, Wettach J, Hethke C, Thomm M. J Biol Chem. 1996;271:30144–30148. - PubMed
    1. Qureshi S A, Bell S D, Jackson S P. EMBO J. 1997;16:2927–2936. - PMC - PubMed
    1. Roeder R G. Trends Biochem Sci. 1996;21:327–335. - PubMed
    1. Baumann P, Qureshi S A, Jackson S P. Trends Genet. 1995;11:279–283. - PubMed
    1. Bell S D, Jackson S P. Cold Spring Harbor Symp Quant Biol. 1998;63:41–51. - PubMed

Publication types

Associated data

LinkOut - more resources