. 1999 Nov 23;96(24):13756-61.
doi: 10.1073/pnas.96.24.13756.

Fluorescence-intensity distribution analysis and its application in biomolecular detection technology

Affiliations

Fluorescence-intensity distribution analysis and its application in biomolecular detection technology

P Kask et al. Proc Natl Acad Sci U S A. .

Abstract

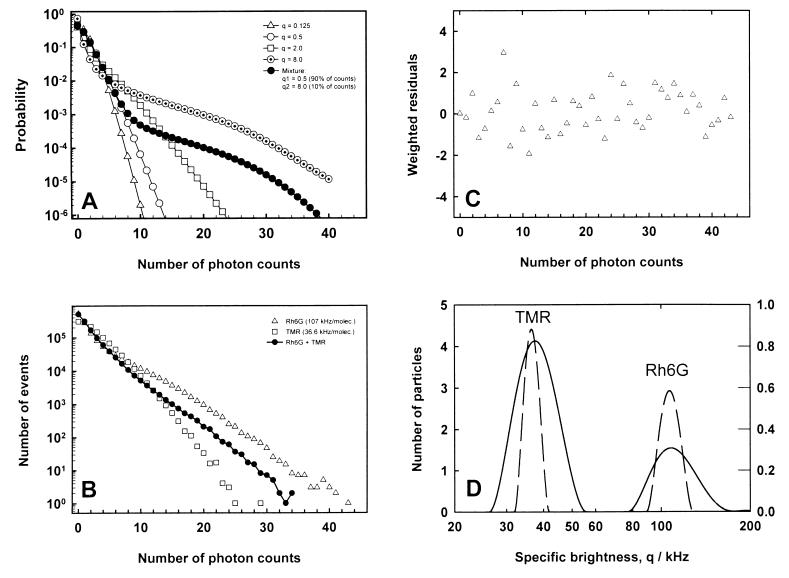
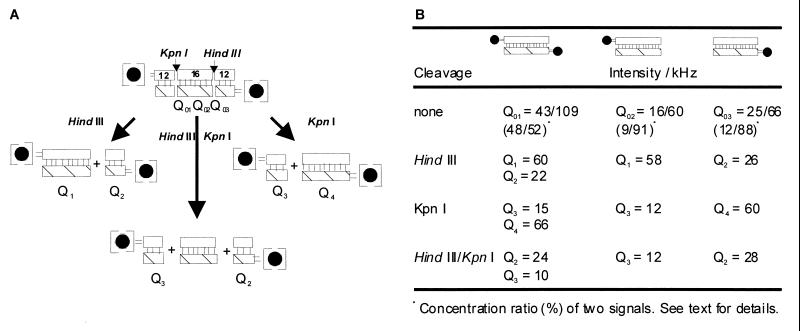
A methodology, fluorescence-intensity distribution analysis, has been developed for confocal microscopy studies in which the fluorescence intensity of a sample with a heterogeneous brightness profile is monitored. An adjustable formula, modeling the spatial brightness distribution, and the technique of generating functions for calculation of theoretical photon count number distributions serve as the two cornerstones of the methodology. The method permits the simultaneous determination of concentrations and specific brightness values of a number of individual fluorescent species in solution. Accordingly, we present an extremely sensitive tool to monitor the interaction of fluorescently labeled molecules or other microparticles with their respective biological counterparts that should find a wide application in life sciences, medicine, and drug discovery. Its potential is demonstrated by studying the hybridization of 5'-(6-carboxytetramethylrhodamine)-labeled and nonlabeled complementary oligonucleotides and the subsequent cleavage of the DNA hybrids by restriction enzymes.


Figures

Figure 1
Figure 1
Theoretical and experimental distributions of the number of photon counts. (A) Expected probability distributions P(n) for five cases of equal mean count rate, n̄ = 1.0. The open symbols correspond to solutions of single species but with different values of the mean count number per particle qT. The solid line is calculated for a mixture of two species, one with qT = 0.5 and the other with qT = 8.0. (B) Measured distributions of the number of photon counts. The data for three samples are presented: the solutions of 0.5 nM Rh6G, 1.5 nM tetramethylrhodamine (TMR), and a mixture of them (0.8 nM TMR, 0.1 nM Rh6G). The time window of 40 μs was used, and the number of photon counts was determined 1,250,000 times in each of the 50s experiments. (C) Weighted residuals from multicomponent fit analysis of the count number distribution measured for Rh6G. (D) Results of ITR analysis applied to the curves shown in Fig. 1B. The dashed lines correspond to the solutions of single dyes (Rh6G and TMR), and the solid line corresponds to their mixture. The ordinates give the mean number of particles within the confocal volume element (left, single dyes; right, mixture).
Figure 2
Figure 2
ITR analysis of hybridized (A–C) and restriction enzyme-cleaved (D and E) labeled oligonucleotides. All ITR curves are of exemplary nature. They result from a set of 20 individual 10 s measurements which show variations among each other of less than 10%.
Figure 3
Figure 3
Hybridization and restriction enzyme cleavage of different combinations of labeled and unlabeled oligonucleotides. Restriction digest analyses of the hybrid DNA were performed with the restriction enzymes HindIII and KpnI either alone or in combination. The restriction sites lead to symmetrically cleaved fragments (2x12 mers, 1x16 mer for double digest). The filled circles correspond to labeled DNA. Q01–03, intensities of DNA hybrids; Qi, intensities of cleavage products.

References

    1. Mets Ü, Rigler R. J Fluoresc. 1994;4:259–264. - PubMed
    1. Elson E L, Magde D. Phys Rev Lett. 1974;13:1–27.
    1. Magde D, Elson E L, Webb W W. Biopolymers. 1974;13:29–61. - PubMed
    1. Magde D, Elson E L, Webb W W. Phys Rev Lett. 1972;29:704–708.
    1. Qian H, Elson E L. Proc Natl Acad Sci USA. 1990;87:5479–5483. - PMC - PubMed

LinkOut - more resources