. 1999 Nov 23;96(24):13983-8.
doi: 10.1073/pnas.96.24.13983.

Localization of a putative transcriptional regulator (ATRX) at pericentromeric heterochromatin and the short arms of acrocentric chromosomes

Affiliations

Localization of a putative transcriptional regulator (ATRX) at pericentromeric heterochromatin and the short arms of acrocentric chromosomes

T L McDowell et al. Proc Natl Acad Sci U S A. .

Abstract

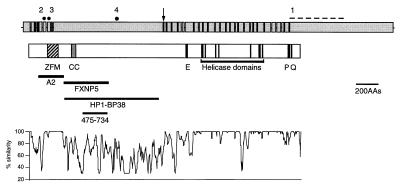
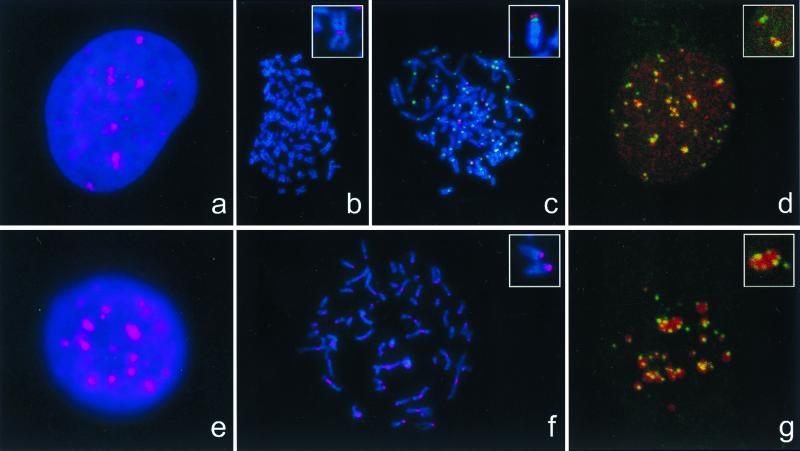
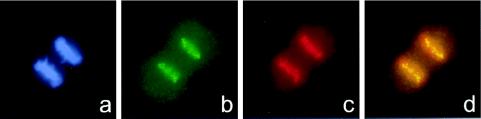
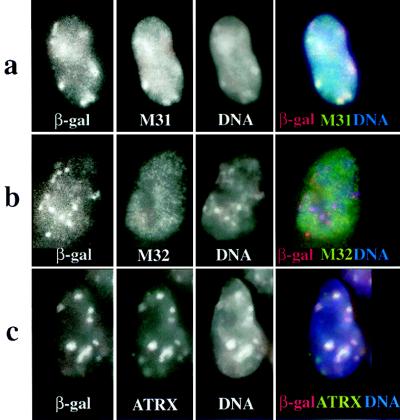
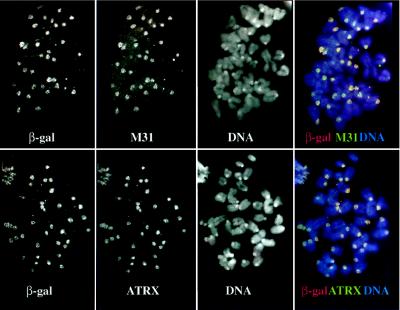
ATRX is a member of the SNF2 family of helicase/ATPases that is thought to regulate gene expression via an effect on chromatin structure and/or function. Mutations in the hATRX gene cause severe syndromal mental retardation associated with alpha-thalassemia. Using indirect immunofluorescence and confocal microscopy we have shown that ATRX protein is associated with pericentromeric heterochromatin during interphase and mitosis. By coimmunofluorescence, ATRX localizes with a mouse homologue of the Drosophila heterochromatic protein HP1 in vivo, consistent with a previous two-hybrid screen identifying this interaction. From the analysis of a trap assay for nuclear proteins, we have shown that the localization of ATRX to heterochromatin is encoded by its N-terminal region, which contains a conserved plant homeodomain-like finger and a coiled-coil domain. In addition to its association with heterochromatin, at metaphase ATRX clearly binds to the short arms of human acrocentric chromosomes, where the arrays of ribosomal DNA are located. The unexpected association of a putative transcriptional regulator with highly repetitive DNA provides a potential explanation for the variability in phenotype of patients with identical mutations in the ATRX gene.


Figures

Figure 1
Figure 1
Structure of the human ATRX gene and protein. The top of the figure shows exons 1–36 (excluding exon 7, which is alternatively spliced) of the human ATRX gene with the introns (not to scale). The position of mutations discussed in the text are marked by solid circles or a dashed line: 1, ped. 26; 2, ped. N29; 3, ped. 12; 4, ped.10. [The mutations are referred to by the pedigree (ped.) in which they were found. Affected members of the same family are distinguished by pedigree order.] The position at which insertion of the trap assay cassette occurred is indicated by an arrow. Below this, the main features of the ATRX protein structure are shown. ZFM, C2—C2 and PHD finger domains; CC, coiled coil; E, stretch of 21 glutamic acid residues; P, a region conserved in other SNF2 proteins; and Q, glutamine-rich region. The positions of the helicase domains are indicated. The locations of recombinant proteins (A2 and FXNP5) used to generate antibodies are shown. HP1-BP38 is the polypeptide that interacts with mHP1α in a two-hybrid screen (10). 475–734, Region that interacts with EZH2. At the bottom of the figure is a plot of percentage similarity between the predicted human and mouse ATRX proteins.
Figure 2
Figure 2
Western blot analyses by using a panel of anti-ATRX antibodies. (a) Nuclear extracts from EBV-transformed lymphocytes probed with polyclonal (FXNP5) and monoclonal (71f, 39f, 23c, and 38d) antibodies. An antibody against TAF II p250 was used as a control. Lanes: N, normal individual; 1, ped. 26; 2, ped. N29. (b) Nuclear extracts from EBV-transformed lymphocytes probed with the anti-ATRX antibody 39f. Annotations are as above; 3, ped. 12; 4, ped. 10 (II-3). (c) Nuclear extracts probed with anti-ATRX antibody 23c and anti-TAF II p250. Annotations are as before; 5, ped. 10 (II-2); 6, ped. 58; 7, ped. 59 (III-10); 8, ped. 59 (III-1); 9, ped. N1 (III-5); 10, ped. N1 (III-4); 11, ped. 38; 12, ped. 17; 13, ped. 27. Arrows indicate: A, full-length ATRX protein; T, TAF II p250; Tr, truncated ATRX protein.
Figure 3
Figure 3
Localization of ATRX protein in interphase and metaphase. HeLa (ad) or L929 (eg) cells were grown on coverslips (a, d, e, and g) or cytospun onto glass slides (b, c, and f), and ATRX (pseudocolored red) and CREST (pseudocolored green) were indirectly immunolabeled. Nucleic acids were counterstained with DAPI (blue). Images of ATRX, centromere staining, and nucleic acids were obtained in a charge-coupled device camera (ac, e, and f) or on confocal images, without DAPI (d and g), and merged. d and g are projections of z series of optical sections taken across whole nuclei. Insets in d and g show the detail observed in a single optical section in which CREST-stained, centromeric heterochromatin is found closely associated with densely staining regions of ATRX. Identical results were obtained by using either 39f or 23c anti-ATRX antibodies.
Figure 4
Figure 4
The distribution of ATRX in mitosis. A Hela cell in telophase stained with DAPI (a), CREST serum (b), anti-ATRX antibody (c), and CREST and anti-ATRX antibody (d).
Figure 5
Figure 5
Localization of β-gal/18D6 fusion, M31, M32, and ATRX proteins in mouse (F9/18D6) nuclei. Immunostaining of F9/18D6 nuclei with antibody against β-gal (images on the far left and red in merged images), together with antibodies against M31 (a), M32 (b), and ATRX (c) (second from left and green in merged images), is shown. DNA was counterstained with DAPI (second from right and blue in merged images). Colocalized signals appear as white.
Figure 6
Figure 6
Localization of β-gal/18D6 fusion, M31, and ATRX proteins on mouse (F9/18D6) metaphase chromosomes. Immunostaining of F9/18D6 metaphase chromosomes with antibody against β-gal (images on the far left and red in merged images), together with antibodies against M31 (Upper, second from left) and ATRX (Lower, second from left and green in merged images), is shown. DNA was counterstained with DAPI (second from right and blue in merged images). Note the intense DAPI staining at the pericentromeric heterochromatin of the mouse chromosomes. Colocalized signals appear as white.

References

    1. Gibbons R J, Brueton L, Buckle V J, Burn J, Clayton-Smith J, Davison B C C, Gardner R J M, Homfray T, Kearney L, Kingston H M, et al. Am J Med Genet. 1995;55:288–299. - PubMed
    1. Gibbons R J, Picketts D J, Villard L, Higgs D R. Cell. 1995;80:837–845. - PubMed
    1. Picketts D J, Higgs D R, Bachoo S, Blake D J, Quarrell O W J, Gibbons R J. Hum Mol Genet. 1996;5:1899–1907. - PubMed
    1. Kingston R E, Bunker C A, Imbalzano A N. Genes Dev. 1996;10:905–920. - PubMed
    1. Gibbons R J, Bachoo S, Picketts D J, Aftimos S, Asenbauer B, Bergoffen J, Berry S A, Dahl N, Fryer A, Keppler K, et al. Nat Genet. 1997;17:146–148. - PubMed

Publication types

MeSH terms