. 1999 Nov 23;96(24):14079-84.
doi: 10.1073/pnas.96.24.14079.

Detection of neuritic plaques in Alzheimer's disease by magnetic resonance microscopy

Affiliations

Detection of neuritic plaques in Alzheimer's disease by magnetic resonance microscopy

H Benveniste et al. Proc Natl Acad Sci U S A. .

Abstract

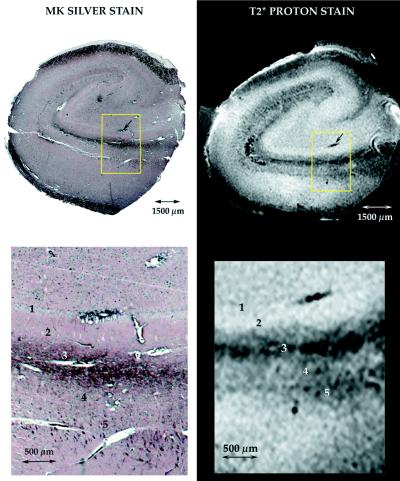
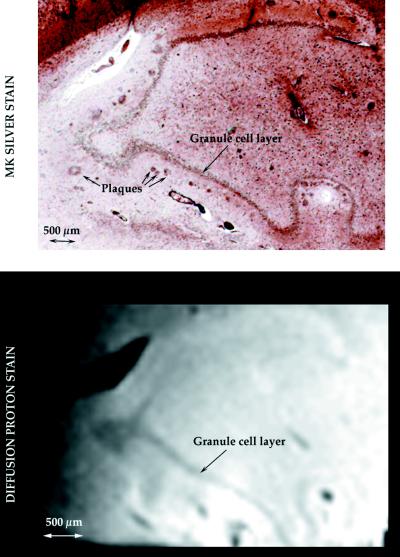
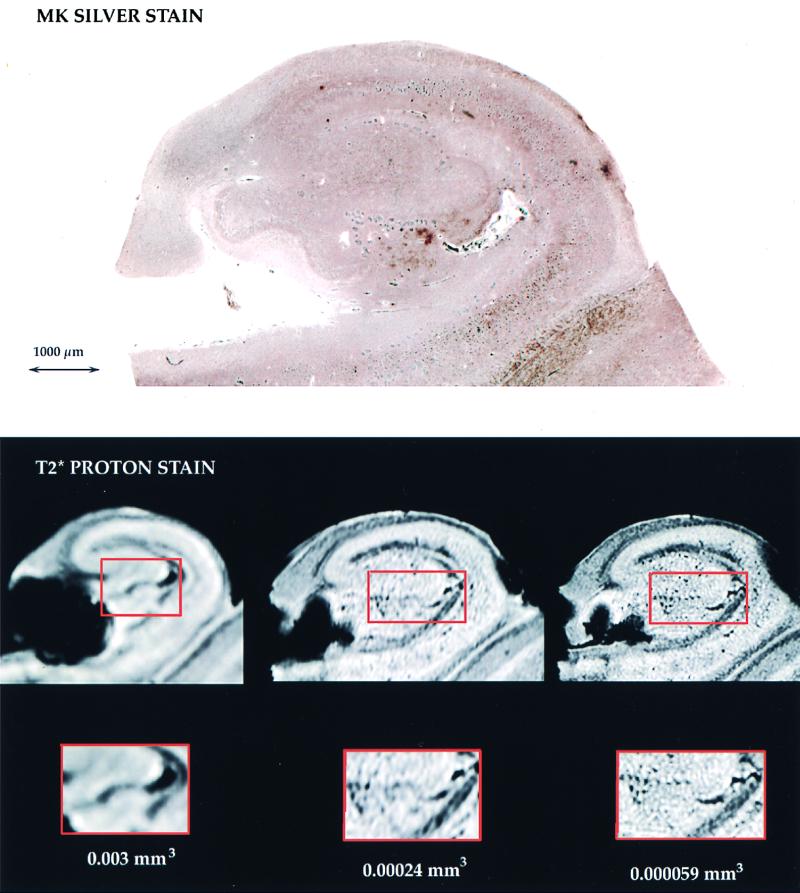
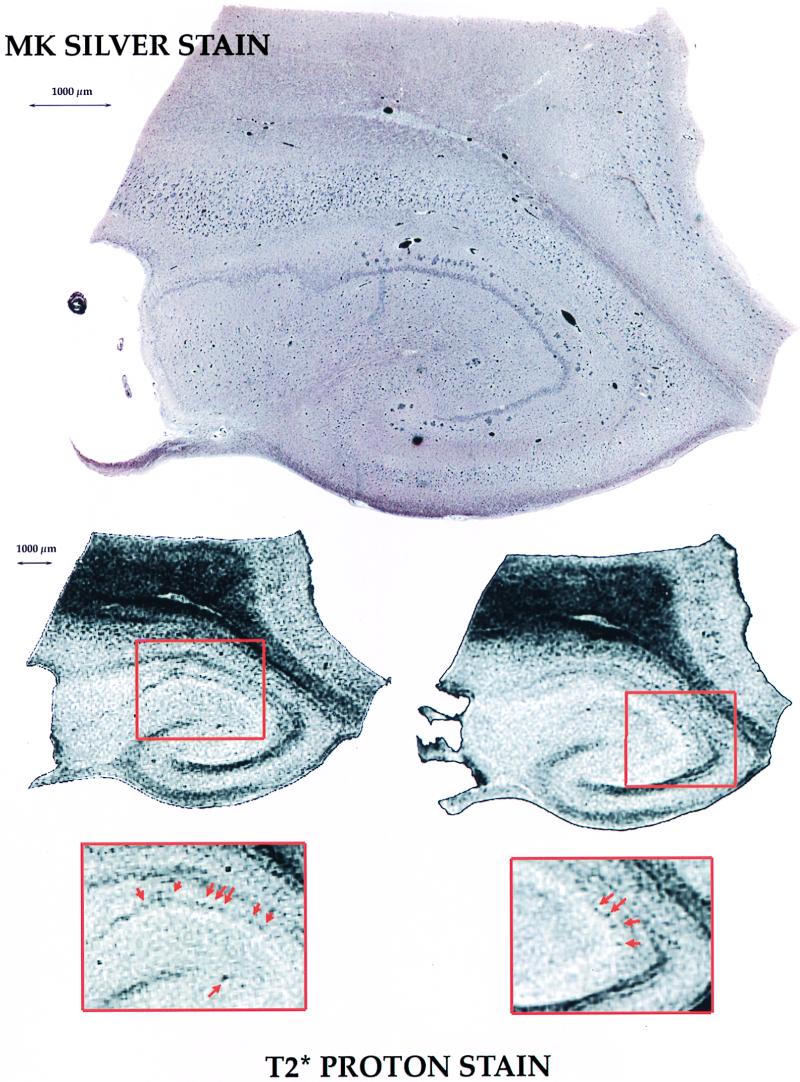
Magnetic resonance microscopy (MRM) theoretically provides the spatial resolution and signal-to-noise ratio needed to resolve neuritic plaques, the neuropathological hallmark of Alzheimer's disease (AD). Two previously unexplored MR contrast parameters, T2* and diffusion, are tested for plaque-specific contrast to noise. Autopsy specimens from nondemented controls (n = 3) and patients with AD (n = 5) were used. Three-dimensional T2* and diffusion MR images with voxel sizes ranging from 3 x 10(-3) mm(3) to 5.9 x 10(-5) mm(3) were acquired. After imaging, specimens were cut and stained with a microwave king silver stain to demonstrate neuritic plaques. From controls, the alveus, fimbria, pyramidal cell layer, hippocampal sulcus, and granule cell layer were detected by either T2* or diffusion contrast. These structures were used as landmarks when correlating MRMs with histological sections. At a voxel resolution of 5.9 x 10(-5) mm(3), neuritic plaques could be detected by T2*. The neuritic plaques emerged as black, spherical elements on T2* MRMs and could be distinguished from vessels only in cross-section when presented in three dimension. Here we provide MR images of neuritic plaques in vitro. The MRM results reported provide a new direction for applying this technology in vivo. Clearly, the ability to detect and follow the early progression of amyloid-positive brain lesions will greatly aid and simplify the many possibilities to intervene pharmacologically in AD.


Figures

Figure 1
Figure 1
(Upper) A representative coronal hippocampal MK silver-stained section and corresponding T2* proton stain from nondemented control subject. The resolution of the T2* proton stain was 1.2 × 10⁻⁴ mm3, and the average SNR was 54:1. (Lower) Hippocampal subfields, indicated by numbers, are based on their known anatomical location: 1, granule cell layer of gyrus dentatus; 2, molecular layer of gyrus dentatus; 3, vestigial hippocampal sulcus; 4, molecular layer of the CA1; 5, stratum lacunosum of the CA1. Note that multiple vessels present on the MK-stained section do not consistently emerge on the T2* proton stain.
Figure 2
Figure 2
Corresponding 10-μm-thick MK silver-stained hippocampal section and 80-μm-thick diffusion proton stain from an AD subject (Braak and Braak stage III; ref. 11). The voxel size in the diffusion proton stain is 4.7 × 10⁻⁴ mm3, and the average SNR is 69. The granule cell layer is recognized as a black, discrete band. On the MK silver-stained section, plaques of the diffuse type without prominent amyloid cores (shorter arrows) can be seen in their typical location, that is, in the molecular layer of the dentate gyrus, approximately two-thirds of the way from the top of the hippocampal sulcus. Plaque-like structures cannot be recognized on the corresponding diffusion proton stain.
Figure 3
Figure 3
(Upper) T2* proton-stained, MK-stained hippocampal section from an AD subject. Neuritic plaques with prominent amyloid cores can be seen in multiple locations. For example, in front of a crescent-shaped vessel, a row of plaque can be seen. (Lower) Corresponding T2* proton stains acquired of this specimens at progressively higher spatial resolution; at voxel sizes of 3 × 10⁻³ mm3 and 2.4 mm3, the row of plaques cannot be seen in front of the large vessel. However, at a voxel size of 5.9 × 10⁻⁵ mm3, individual plaque-like structures can be easily identified. The plaques on the MK silver-stained section measure from 50 to 150 μm across. On the T2* proton stain, plaque-like structures measure from 100 to 150 μm across.
Figure 4
Figure 4
Another example of plaque visualization on a T2* proton stain. A row of plaques can be seen on the MK silver-stained section in parallel to the granule cell layer. On the T2* proton stain, the granule cell layer can be identified as a faint, bright line. Above this bright layer, a row of black, rounded elements can be visualized. This particular hippocampal specimen was from a subject diagnosed with severe AD (Braak and Braak stage VI; ref. 11).

References

    1. Johnson G A, Benveniste H, Black R D, Hedlund L W, Maronpot R R, Smith B R. Magn Reson Q. 1993;9:1–30. - PubMed
    1. Johnson G A, Benveniste H, Engelhardt R T, Qui H, Hedlund L W. Ann N Y Acad Sci. 1997;820:139–148. - PubMed
    1. Smith B, Linney E, Huff D, Johnson G. Comp Med Imag Graphics. 1996;20:483–490. - PubMed
    1. Probst A, Langui D, Ulrich J. Brain Pathol. 1991;1:229–239. - PubMed
    1. Esiri M M, Hyman B T, Beyreuther K, Masters C L. In: Greenfield’s Neuropathology. Graham D I, Lantos P L, editors. Vol. 2. London: Arnold; 1997. pp. 153–234.

Publication types