. 1999 Nov 23;96(24):14088-93.
doi: 10.1073/pnas.96.24.14088.

Neuronal overexpression of mutant amyloid precursor protein results in prominent deposition of cerebrovascular amyloid

Affiliations

Neuronal overexpression of mutant amyloid precursor protein results in prominent deposition of cerebrovascular amyloid

M E Calhoun et al. Proc Natl Acad Sci U S A. .

Abstract

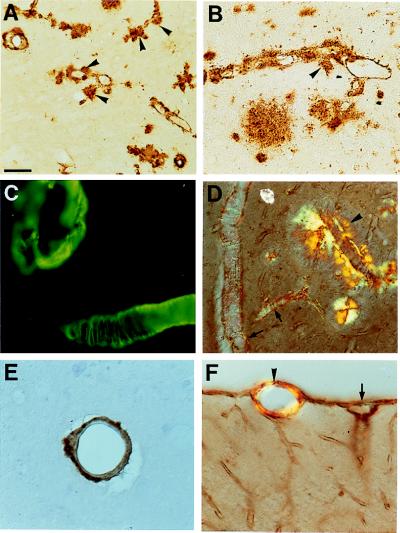
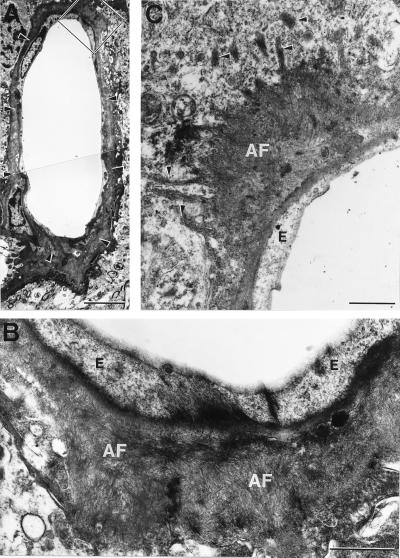
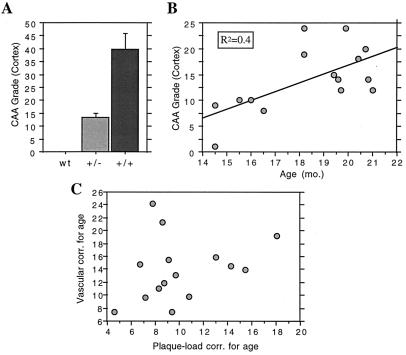
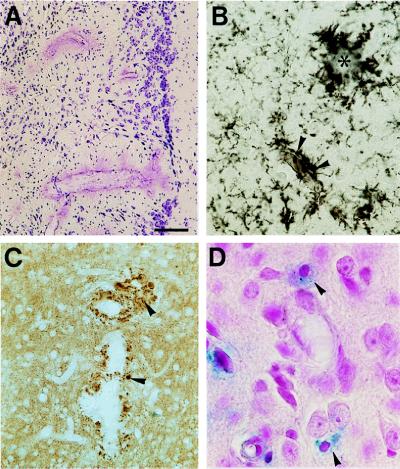
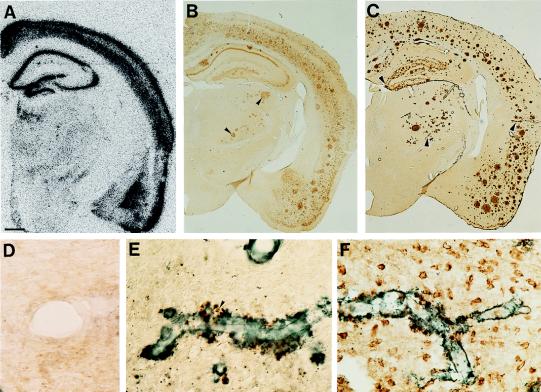
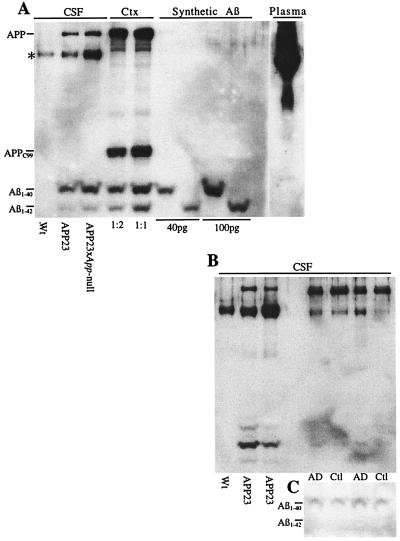
Transgenic mice that overexpress mutant human amyloid precursor protein (APP) exhibit one hallmark of Alzheimer's disease pathology, namely the extracellular deposition of amyloid plaques. Here, we describe significant deposition of amyloid beta (Abeta) in the cerebral vasculature [cerebral amyloid angiopathy (CAA)] in aging APP23 mice that had striking similarities to that observed in human aging and Alzheimer's disease. Amyloid deposition occurred preferentially in arterioles and capillaries and within individual vessels showed a wide heterogeneity (ranging from a thin ring of amyloid in the vessel wall to large plaque-like extrusions into the neuropil). CAA was associated with local neuron loss, synaptic abnormalities, microglial activation, and microhemorrhage. Although several factors may contribute to CAA in humans, the neuronal origin of transgenic APP, high levels of Abeta in cerebrospinal fluid, and regional localization of CAA in APP23 mice suggest transport and drainage pathways rather than local production or blood uptake of Abeta as a primary mechanism underlying cerebrovascular amyloid formation. APP23 mice on an App-null background developed a similar degree of both plaques and CAA, providing further evidence that a neuronal source of APP/Abeta is sufficient to induce cerebrovascular amyloid and associated neurodegeneration.


Figures

Figure 1
Figure 1
CAA in APP23 mouse brain. (A and B) CAA is predominantly found in pial, cortical, hippocampal, and thalamic vessels. Shown is Aβ-immunostaining in the thalamus (A) and cortex (B) of a 16-month-old homozygous APP transgenic mouse. Vascular amyloid often infiltrates the nearby neuropil (arrowheads). (C) Thioflavin-S staining verified that the amyloid was fibrillary and the ring-like staining was similar to that seen in human CAA. (D) Congo red birefringence was also apparent in this section, which was double-stained for β-dystroglycan (brown) to visualize all vessels. Pathology ranged from amyloid confined to the vessel wall (arrows) to vessels with amyloid fibrils extending into the neuropil (arrowhead). (E) Semithin section of a vessel with Aβ-immunoreactivity confined to the outer vessel wall. (F) Side-by-side view of a Congo red-positive artery (arrowhead) and a Congo red-negative vein (arrow) at the pial surface. [Bars = 70 μm (A), 30 μm (B), 20 μm (C), 50 μm (D), 10 μm (E), and 25 μm (F).]
Figure 2
Figure 2
Ultrastructure of vascular amyloid in APP23 mice. (A) Cortical vessel of a 20-month-old hemizygous APP23 mouse that is surrounded by amyloid (arrowheads). Boxed area is shown in B. (B) High power view of amyloid fibrils (AF) between the endothelial cells (E) and the neuropil. (C) Fine radiating amyloid fibrils often infiltrate the nearby neuropil (arrowheads). Such infiltrating fiber-bundles are surrounded by a dense granular cytoplasm. [Bars = 5 μm (A) and 1 μm (B and C).]
Figure 3
Figure 3
Effects of APP expression, age, and plaque load on CAA. (A) Quantification of CAA grade indicates that homozygous mice (+/+) have significantly more vascular amyloid than hemizygous mice (+/−) within the same age-range. No vascular amyloid is observed in wild-type (wt) mice. Error bars indicate SEM. (B) CAA development is age-dependent, as shown for the hemizygous mice with ages ranging from 14–21 months. (C) Because the development of parenchymal amyloid (plaques) is also age-dependent, we used partial correlation to examine the relationship between amyloid plaque load and CAA grade with age held constant. Individual CAA grade and plaque load values were adjusted by a linear formula inverse to their respective age regression lines (age held constant at the mean of 18.3 months). The resulting graph (C) and partial correlation statistics (r = 0.21) failed to indicate a significant relationship between plaques and CAA.
Figure 4
Figure 4
Neurodegeneration associated with vascular amyloid in APP23 mice. (A) Cresyl violet staining suggests neuron loss surrounding vessels with extensive vascular amyloid. (B) Activated microglia were observed when amyloid was present in the neuropil either in the form of plaques (asterisk) or dyshoric amyloid-containing vessels (arrowheads). (C) Synaptophysin-labeling reveals dystrophic boutons (arrowheads) around vascular amyloid infiltrating the neuropil. (D) Staining for iron (blue) shows microglia that have incorporated products from the blood—an indication of microhemorrhage. [Bars = 40 μm (A), 60 μm (B), 13 μm (C), and 10 μm (D).]
Figure 5
Figure 5
Regional and neuron-specific expression of human APP in APP23 mice. (A) In situ hybridization for human APP reveals labeling in neocortex, hippocampus, and amygdala. Other regions, such as the thalamus, had no detectable APP expression. (B) Similarly, immunohistochemistry with an antibody specific to human APP reveals neuron labeling in the same regions. However, labeling of dystrophic boutons in the thalamus is also apparent (arrowheads). (C) Immunohistochemistry with an antibody to Aβ reveals vascular amyloid (arrowheads) and amyloid plaques in neocortex, hippocampus, amygdala, and also thalamus. (D) A high magnification view of a thalamic vessel stained for human APP indicates no expression of the transgene within the vasculature. (E and F) Amyloid-laden vessels are shown at high magnification for comparison of human APP expression (brown) and Aβ deposition (blue–gray) between thalamus (E) and neocortex (F). In the cortex, clear localization of APP is apparent within neurons and in dystrophic neurites around amyloid. In the thalamus, in contrast, no neuronal labeling is apparent, although APP is also localized within dystrophic neurites (arrowhead). [Bars = 500 μm (AC), 10 μm (D), and 30 μm (E and F).]
Figure 6
Figure 6
High levels of human Aβ in CSF of APP23 mice. (A) Western blot for human Aβ in CSF (1 μl) from a nontransgenic control [wild-type (Wt)], APP23, and APP23 × App-null mouse, with cortex from an APP23 mouse and synthetic Aβ shown for comparison. The wild-type mice showed no reactivity to human Aβ. In contrast, APP23 and APP23 × App-null showed CSF levels of Aβ1–40 of ≈40 pg/μl. Aβ1–42 was also detectable; however, levels were much lower than Aβ1–40. APP (secreted and full length) was also detectable, and, in CSF, the ratio of Aβ to APP was much higher than in cortex, indicating the presence of cellular APP forms in cortex. When the blot was incubated with a C-terminal antibody (C8; not shown), the APP and Aβ bands from the CSF samples were no longer present, indicating that the APP band in CSF represents secreted APP. A nonspecific band (*) was observed in all CSF samples, which showed no relationship to either APP or Aβ levels and was highly variable from experiment to experiment. A 2-μl plasma sample from an APP23 mouse is shown with no detectable levels of Aβ indicated. (B) Comparison of Aβ and APP levels between mouse and human CSF. Again, high levels of Aβ were present in CSF (2 μl) from the two additional APP23 mice shown, which was not seen in the WT mouse. CSF samples from two AD patients and two aged human controls had much lower Aβ levels than the transgenic mice. Interestingly, the human CSF had a higher ratio of APP to Aβ, perhaps because of the Swedish mutation used in APP23 mice. (C) To better measure Aβ levels in human CSF, five times the volume was loaded (10 μl) and indicated values <5 pg/μl.

References

    1. Vinters H V. Stroke. 1987;18:311–324. - PubMed
    1. Levy E, Carman M D, Fernandez-Madrid I J, Power M D, Lieberburg I, van Duinen S G, Bots G T, Luyendijk W, Frangione B. Science. 1990;248:1124–1126. - PubMed
    1. Itoh Y, Yamada M, Hayakawa M, Otomo E, Miyatake T. J Neurol Sci. 1993;116:135–141. - PubMed
    1. Kawai M, Kalaria R N, Cras P, Siedlak S L, Velasco M E, Shelton E R, Chan H W, Greenberg B D, Perry G. Brain Res. 1993;623:142–146. - PubMed
    1. Walker L C. Brain Res Brain Res Rev. 1997;25:70–84. - PubMed

Publication types

Substances

LinkOut - more resources