

Editorial
doi: 10.1085/jgp.114.4.589.
Graphic representation of the results of kinetic analyses
- PMID: 10577023
- PMCID: PMC2229466
- DOI: 10.1085/jgp.114.4.589
Item in Clipboard
Editorial
Graphic representation of the results of kinetic analyses
J Gen Physiol.
1999 Oct.
No abstract available
Figures
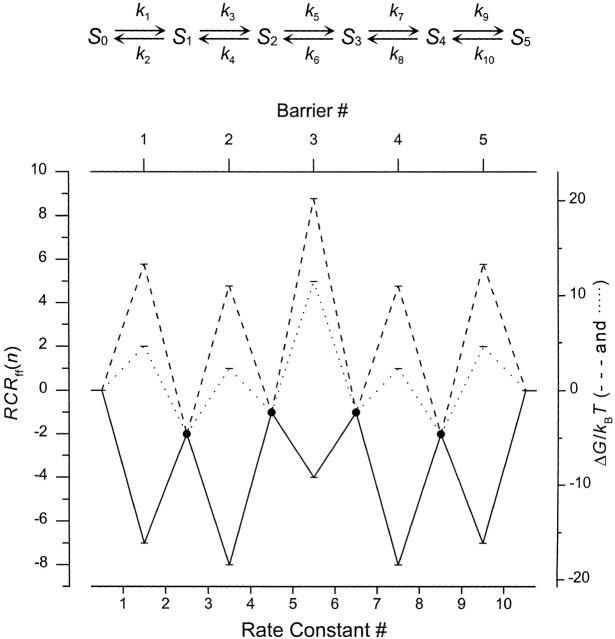
Graphic representation of the rate constants in a linear kinetic scheme. (Top) The kinetic scheme denoting the kinetic states (S
0 − S
5) and the rate constants (k
1 − k
10). (Bottom left-hand axis) The three lines denote rate constant representations using and ff = 1 s−1 (______), 109 s−1 (……), and 6 · 1012 s−1 (- - - -), respectively (for k
1 = k
10 = 107 s−1, k
2 = k
9 = 105 s−1, k
3 = k
8 = 106 s−1, k
4 = k
7 = 107 s−1, and k
5 = k
6 = 103 s−1). (Note that for ff = 1 s−1, the peaks are below the wells.) (Bottom, right-hand axis) The free energy profile deduced using (- - - -) and a similar profile deduced using ff = 109 s−1 (……).
