. 1999 Sep 1;519 Pt 2(Pt 2):415-25.
doi: 10.1111/j.1469-7793.1999.0415m.x.

Cortical spreading depression in the gyrencephalic feline brain studied by magnetic resonance imaging

Affiliations

Cortical spreading depression in the gyrencephalic feline brain studied by magnetic resonance imaging

M F James et al. J Physiol. .

Abstract

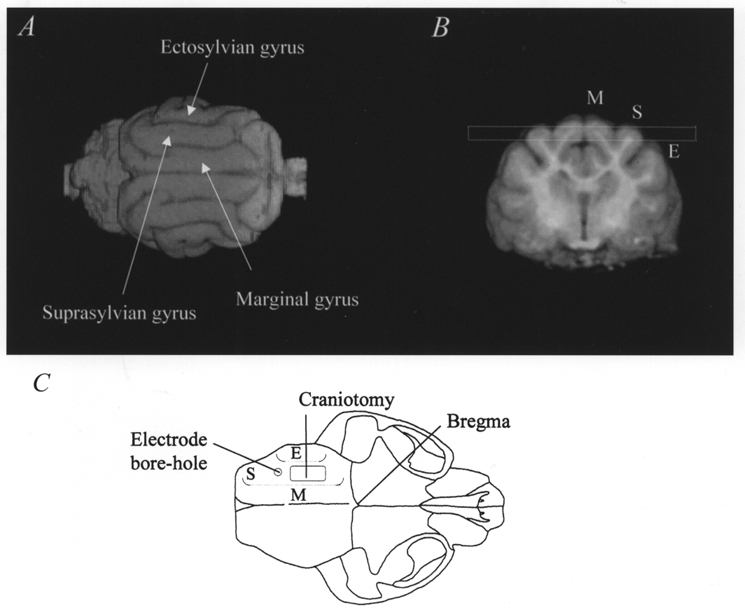
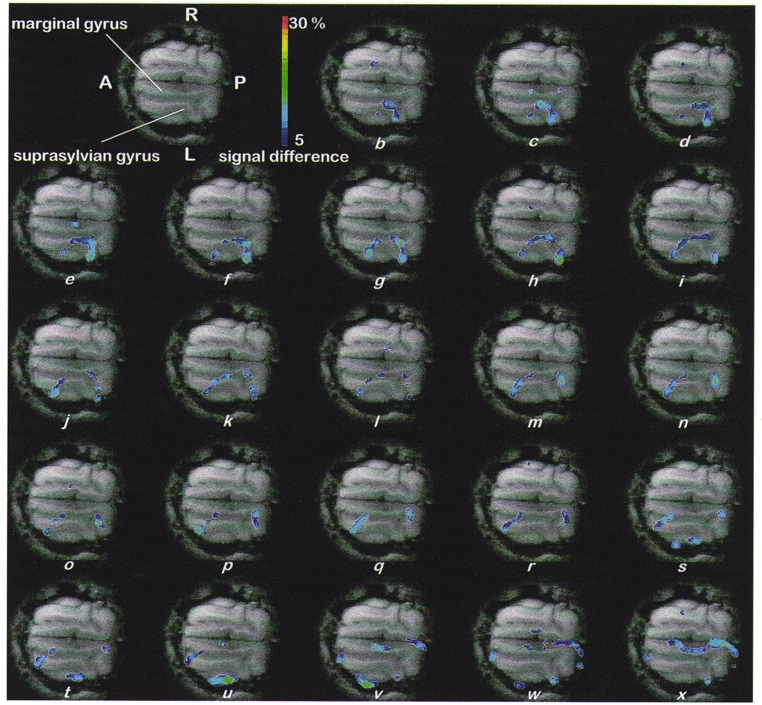
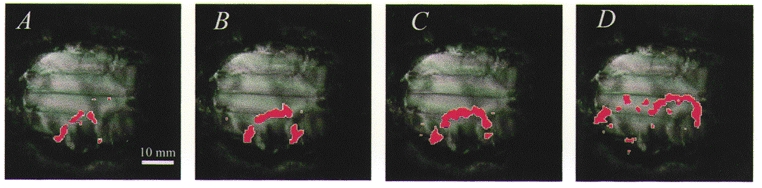
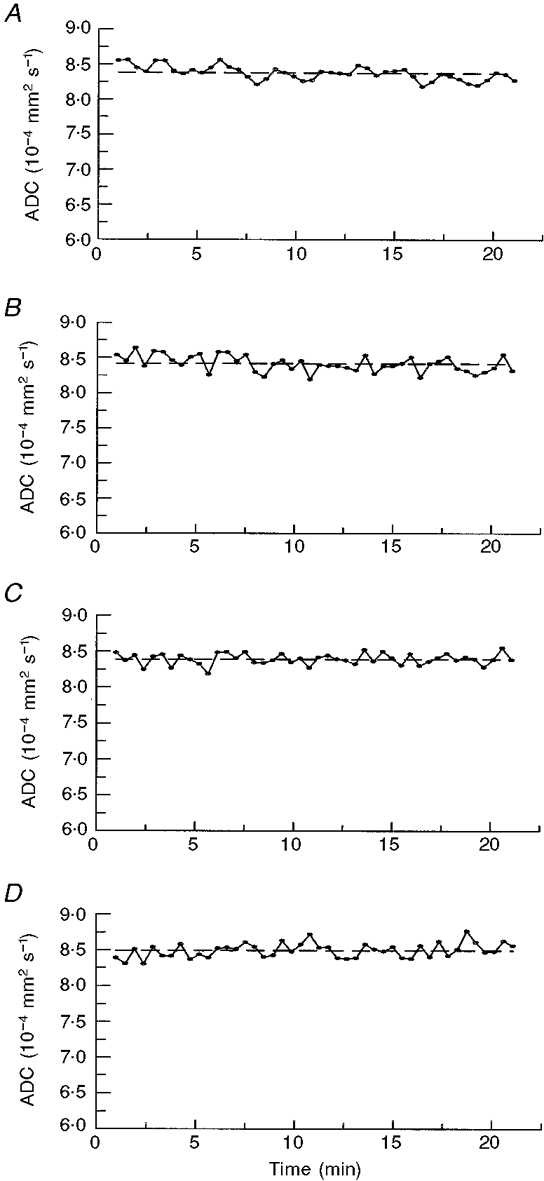
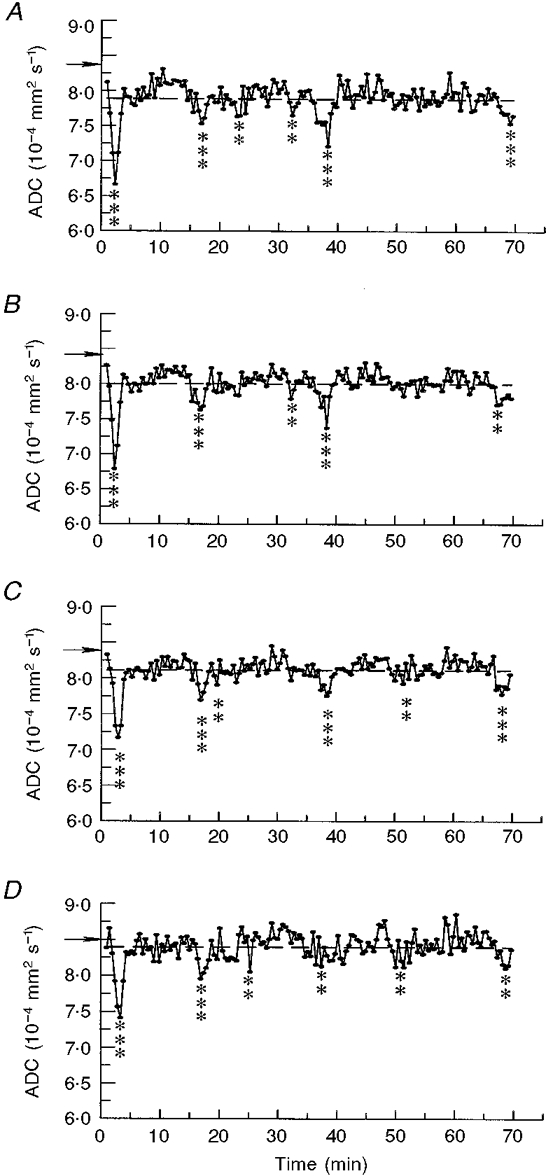
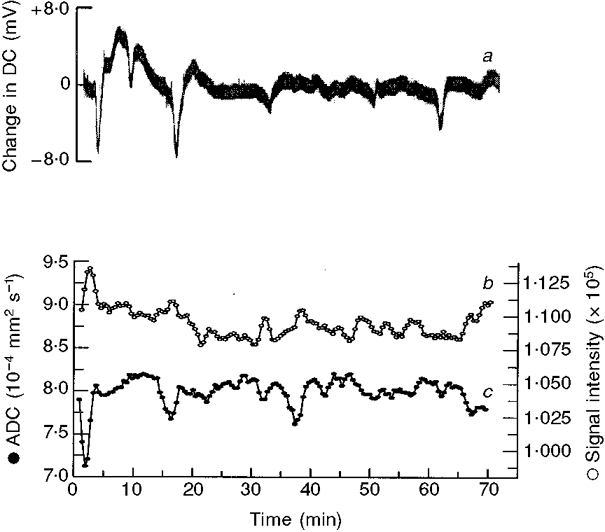
1.Time-lapse diffusion-weighted magnetic resonance imaging (DWI) was used to detect and characterize complex waves of cortical spreading depression (CSD) evoked with KCL placed upon the suprasylvian gyrus of anaesthetized cats. 2. The time-lapse representations successfully demonstrated primary CSD waves that propagated with elliptical wavefronts selectively over the ipsilateral cerebral hemispheres with a velocity of 3.8 +/- 0.70 mm min(-1) (mean +/- S.E.M. of 5 experiments). 3. In contrast, the succeeding secondary waves often remained within the originating gyrus, were slower (velocity 2.0 +/- 0.18 mm min(-1), more fragmented and varied in number. 4. Computed traces of the apparent diffusion coefficients (ADCs) showed negative deflections followed by monotonic decays (amplitudes: primary wave, -19.9 +/- 2.8%; subsequent waves, -13.6 +/- 1.9% duration at half-maximal decay, 150-200 s) when determined from regions of interest (ROIs) through which both primary and succeeding CSD waves propagated. 5. The passage of both the primary and the succeeding waves often correlated with transient DC potential deflections recorded from the suprasylvian gyrus. 6. The detailed waveforms of the ADC and the T2*-weighted (blood oxygenation level-dependent: BOLD) traces showed a clear reciprocal correlation. These imaging features that reflect disturbances in cellular water balance agree closely with BOLD measurements that followed the propagation velocities of the first and subsequent CSD events. They also provide a close physiological correlate for clinical observations of cortical blood flow disturbances associated with human migraine.


Figures

Figure 1
Figure 1. 3-D and transverse images of the feline brain in vivo
A shows a dorsal view of a volume-rendered reconstruction of the feline brain, in conjunction with a transverse image (B) showing the marginal (M), suprasylvian (S) and ectosylvian (E) gyri. The dashed box in B indicates the selection of the horizontal imaging slice (3 mm slice thickness) used for the DWEP and DWEPBOLD experiments described in the text. C reconstructs a dorsal view of the feline skull to indicate the surgical positions of the craniotomy and the electrode bore hole. Dotted lines indicate the relative positions of the three gyri.
Figure 2
Figure 2. CSD propagation across the surface of the cat brain in vivo
a (top, left), control, horizontal, gradient-echo anatomical image depicting the suprasylvian and marginal gyri. Remaining images (b-x): coloured overlays, shown at 10 s intervals starting about 50 s after KCl application, represent elliptical regions of reduced diffusion travelling away from the KCl application site with velocity 3.2 ± 0.1 mm min−1 (mean ±s.e.m. of 5 measurements). Over the first 11 frames (b-l) the wave travels both rostrally and caudally along the suprasylvian gyrus; when it reaches the caudal junction of the two gyri (frames 12-18; m-s) it appears to pass into the marginal gyrus (frames 19-23; t-x); likewise, rostrally, the wave passes first (frames 17-23; r-x) into the ectosylvian gyrus where it dissipates (frames 21-23; v-x) and then into the marginal gyrus (frames 19-23; t-x). Waves were never detected in the contralateral hemisphere. Abbreviations: A, anterior; P, posterior; R, right; L, left; overlays were obtained by subtracting a baseline image from the high-b images obtained in the DWEP sequence and transforming the signal difference into a percentage change (blue 5 %, red 30 %). Scale bar, 15 mm.
Figure 3
Figure 3. Regions of interest (ROI) selected for the analysis of the cerebral apparent diffusion coefficient (ADC) and blood oxygenation level-dependent (BOLD) signal changes
The coloured overlays in frames A-D indicate the ROIs selected for the analysis of ADC and BOLD signal changes before KCl application and during the passage of CSD across the suprasylvian and marginal gyri of the cat brain. Overlays were created by subtracting a baseline image from a stack of high-b images obtained using the DWEPBOLD sequence (post-application of KCl) and marking those areas where a 5 % or greater change occurred. Overlays (A-D) represent time points at 0.5, 1.0, 1.4 and 5.1 min, respectively.
Figure 4
Figure 4. Changes in the ADC with time during a control period before KCl application
A-D, average ADC values over time were calculated for an ≈20 min pre-KCl application control period using the ROIs identified in Fig. 3. The average ADC value for the control period is indicated by the horizontal dashed line. Mean ADC values (±s.d.) for the 4 ROIs (Fig. 3A-D) are 8.38 × 10⁻⁴± 1.23 × 10⁻⁵, 8.42 × 10⁻⁴± 1.13 × 10⁻⁵, 8.39 × 10⁻⁴± 7.86 × 10⁻⁶ and 8.49 × 10⁻⁴± 1.22 × 10⁻⁵ mm2 s−1, respectively; the s.d. accounts, respectively, for 1.5, 1.3, 0.9 and 1.4 % of the ADC values in the unstimulated brain.
Figure 5
Figure 5. Changes in the ADC with time after KCl application
A-D, average ADC values were calculated from the 4 ROIs shown in Fig. 3A-D. Asterisks indicate ADC values significantly decreased from the mean of all time points (indicated by the horizontal dashed line) (**≥ 2 s.d.s, ***≥ 3 s.d.s); ADC decreases coincided with negative DC potential deflections indicating CSD passage; horizontal arrows indicate reference ADC values from the same areas before KCl application.
Figure 6
Figure 6. Correlations between DC potential, ADC and BOLD changes
Changes in the DC potential (a) recorded at the brain surface following application of KCl; variation in the apparent diffusion coefficient (ADC; c) and the BOLD signal measuring haemoglobin oxygenation (b), within a single ROI. Comparison of the ADC and BOLD signals demonstrates an inverse correlation and good temporal superposition. ADC and BOLD traces (c and b) were subject to a 3-point running-mean smoothing procedure to improve definition and show that BOLD activation (increased signal intensity) occurs slightly later than ADC decreases.

References

    1. Back T, Kohno K, Hossmann KA. Cortical negative DC deflections following middle cerebral artery occlusion and KCl-induced spreading depression: effect on blood flow, tissue oxygenation, and electroencephalogram. Journal of Cerebral Blood Flow and Metabolism. 1994;14:12–19. - PubMed
    1. Ballanyi K, Grafe P, Ten Bruggencate G. Ion activities and potassium uptake mechanisms of glial cells in guinea-pig olfactory cortex slices. The Journal of Physiology. 1987;382:159–174. - PMC - PubMed
    1. Bures J, Buresova O, Krivanek J. The meaning and significance of Leao's spreading depression. Anais da Academia Brasileira de Ciencias. 1984;56:385–400. - PubMed
    1. Chopp M. Editorial comment: spreading depression. Cephalagia. 1996;16:77. - PubMed
    1. Cutrer FM, Sorenson AG, Weisskoff RM, Ostergaard L, Sanchez Del Rio M, Lee EJ, Rosen EJ, Moskowitz MA. Perfusion-weighted imaging defects during spontaneous migrainous aura. Annals of Neurology. 1988;43:25–31. - PubMed

Publication types

MeSH terms

LinkOut - more resources