. 1999 Dec;114(6):759-70.
doi: 10.1085/jgp.114.6.759.

Activation of Ca(2+)-dependent K(+) channels contributes to rhythmic firing of action potentials in mouse pancreatic beta cells

Affiliations

Activation of Ca(2+)-dependent K(+) channels contributes to rhythmic firing of action potentials in mouse pancreatic beta cells

S O Göpel et al. J Gen Physiol. 1999 Dec.

Abstract

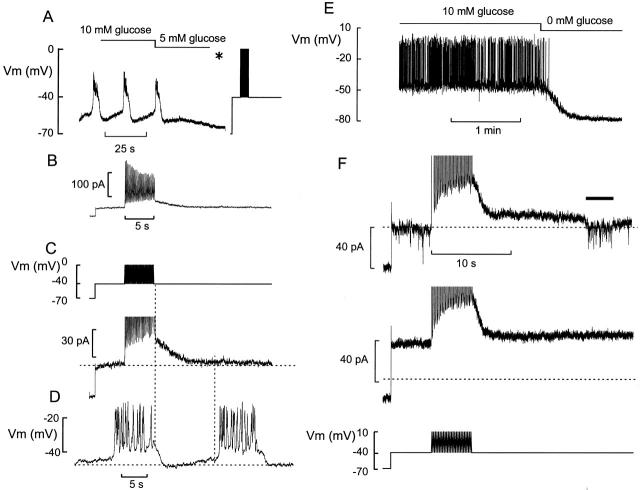
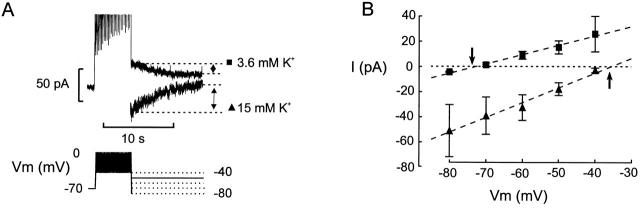
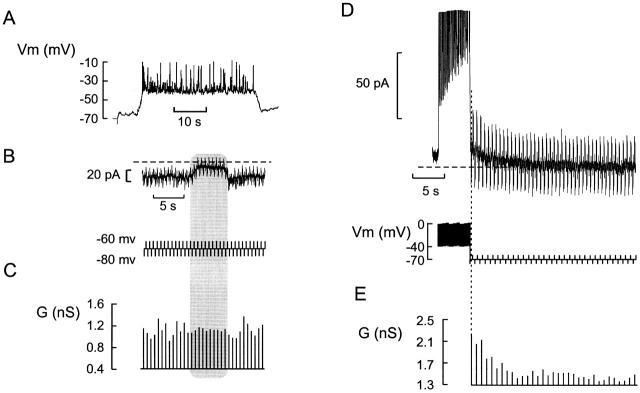
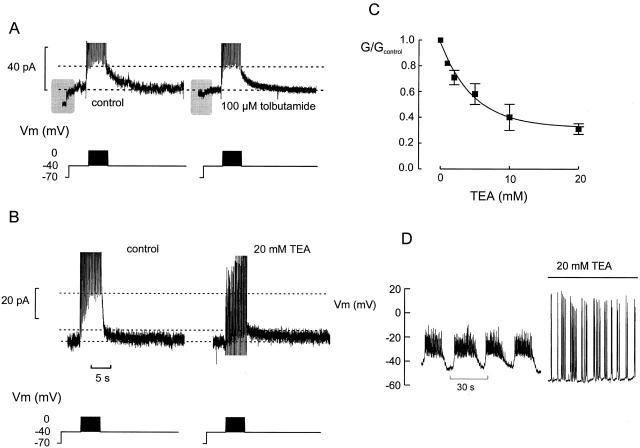
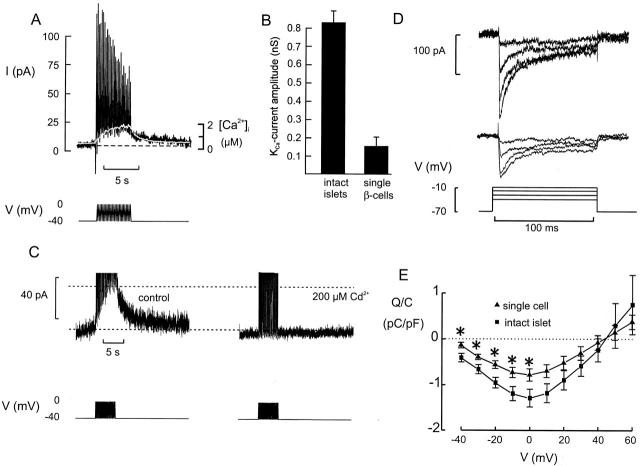
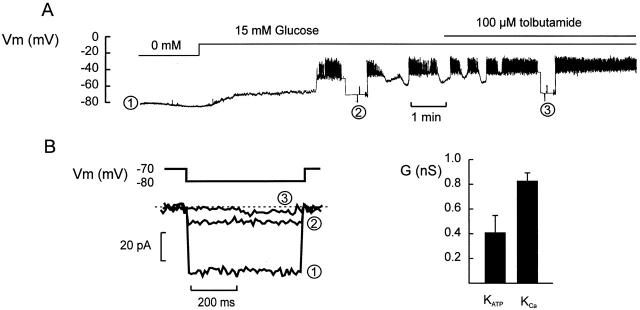
We have applied the perforated patch whole-cell technique to beta cells within intact pancreatic islets to identify the current underlying the glucose-induced rhythmic firing of action potentials. Trains of depolarizations (to simulate glucose-induced electrical activity) resulted in the gradual (time constant: 2.3 s) development of a small (<0.8 nS) K(+) conductance. The current was dependent on Ca(2+) influx but unaffected by apamin and charybdotoxin, two blockers of Ca(2+)-activated K(+) channels, and was insensitive to tolbutamide (a blocker of ATP-regulated K(+) channels) but partially (>60%) blocked by high (10-20 mM) concentrations of tetraethylammonium. Upon cessation of electrical stimulation, the current deactivated exponentially with a time constant of 6.5 s. This is similar to the interval between two successive bursts of action potentials. We propose that this Ca(2+)-activated K(+) current plays an important role in the generation of oscillatory electrical activity in the beta cell.


Figures

Figure 1
Figure 1
Train of action potentials elicits an outward current in β cells. (A) Membrane potential oscillations in a β cell exposed to 10 mM glucose. The glucose concentration was lowered to 5 mM as indicated above the voltage trace. *The amplifier was switched from the current-clamp into the voltage-clamp mode, the membrane potential held at −70 mV, and the command voltage varied as indicated. (B) The membrane currents elicited by the pulse train (C, top). Note time-dependent decline of outward current. (C, bottom) Change of holding current displayed on an expanded vertical scale. Note gradual development of a holding current. Same experiment as in B. (D) Membrane potential recording from the same cell as in C before lowering the glucose concentration. In C and D, the vertical line marks the temporal relationship between cessation of stimulation and the onset of rapid repolarization (left) and the onset of rapid depolarization during the subsequent burst (right). The horizontal lines indicate (from top to bottom) the steady state holding current at −40 mV, the plateau potential from which the cell repolarizes upon termination of the burst, and the most negative membrane potential attained between two bursts. (E) Membrane potential recording from an isolated (dispersed) β cell maintained in tissue culture. The glucose concentration was changed from 10 to 0 mM as indicated above the voltage trace. (F) Currents elicited by the train of depolarizations (bottom) in the presence of 10 (top) and 5 (middle) mM glucose. The inward current (indicated by the horizontal line above the current trace) is due to a burst of action potentials generated in a neighboring β cell. Note that step current elicited when stepping from −70 to −40 mV is larger at 5 than at 10 mM glucose, reflecting greater activity of the KATP channels.
Figure 2
Figure 2
Kslow current is K+ selective. (A, bottom) After the train of depolarizations, the membrane potential was held for 10 s at voltages between −40 and −80 mV as indicated schematically by the pulse protocol. (A, top) Membrane currents recorded at −50 mV after the train when the extracellular medium contained 3.6 or 15 mM K+ as indicated. Note that the currents go in opposite directions. (B) The peak tail currents recorded at membrane potentials between −80 and −40 mV before and after elevation of extracellular K+ from 3.6 mM (▪) to 15 mM (▴). The amplitude of the current was measured as illustrated in B. The arrows indicate the reversal potentials recorded at low and high extracellular K+.
Figure 3
Figure 3
Cell coupling does not account for Kslow current. (A) Membrane potential recording from a β cell in an intact islet. (B) Voltage-clamp recording at a holding potential of −70 mV. Changes of the cell conductance (G) were determined from the current responses (top) elicited by application of ±10-mV voltage pulses (200-ms duration, 2 Hz frequency; bottom). (C) Cell conductance calculated from the ±10-mV voltage steps in B. Note that the cell conductance is stable and amounts to ≈1 nS. In B and C, the shaded area indicated the silent interval between two successive bursts. (D) Current responses (top) elicited by a train of depolarizations followed by a series of ±10-mV voltage pulses applied from a holding potential of −70 mV to monitor the cell conductance (bottom). (E) Cell conductance (G) calculated from the ±10-mV voltage pulses. Note that the conductance is greatest (2.1 nS) immediately after the train, but subsequently declines to the steady state value (1.3 nS). The same cell was used in A–E.
Figure 4
Figure 4
Pharmacological characterization of Kslow. (A) Failure of tolbutamide (100 μM) to affect current amplitude. Note that the current response observed when stepping from −70 to −40 mV is reduced by tolbutamide reflecting closure of KATP channels (shaded areas). The horizontal lines indicate the peak amplitude and steady state current, respectively. (B) Effects of TEA (20 mM). The horizontal dotted lines indicate (from top to bottom) the peak current amplitude, under control conditions and in the presence of TEA, and the steady state current, respectively. (C) Concentration dependence of inhibitory action of TEA. The Kslow conductance (G) is expressed as the fractional current using the current amplitude in TEA-free solution as unity (Gcontrol). Note that inhibition is half-maximal at 5 mM and that 30% of the current is resistant to TEA. (D) Electrical activity evoked by 15 mM glucose in the same cell before and after addition of TEA.
Figure 5
Figure 5
Association between [Ca2+]i and Kslow current activation. (A) Membrane current (top) elicited by a train of depolarizations (bottom) and the associated changes of the cytoplasmic [Ca2+]i in an isolated cell (white trace superimposed on current trace). The horizontal line indicate steady state current and [Ca2+]i. (B) The current amplitude measured at the end of the train in isolated cells and in β cells within intact islets. *P < 0.001. (C) Kslow current (top) elicited by the train of depolarizations (bottom) under control conditions and in the presence of 200 μM Cd2+. (D) Voltage-gated Ca2+ currents recorded during 100-ms depolarizations to 0 mV from a holding potential of −70 mV in β cells in intact islets (top) and in dispersed β cells (middle). (E) Charge entry normalized to cell capacitance (Q/C)–voltage (V) relationships of the Ca2+ current recorded in isolated β cells (▴) and in β cells within intact islets (▪). Mean values ± SEM of 8 (▪) and 15 (▴) experiments. *P < 0.05.
Figure 6
Figure 6
Parallel recordings of glucose-induced changes of the membrane potential and membrane conductance in a β cell within an intact islet. (A) Membrane potential recorded in the absence of glucose, after elevation of glucose to 15 mM, and in the simultaneous presence of 15 mM glucose and 100 μM tolbutamide. At the times indicated (1–3), the amplifier was switched from the current-clamp into the voltage-clamp mode and the membrane conductance was monitored by application of ±10-mV voltage pulses (duration: 500 ms; frequency: 0.5 Hz). (B) Membrane currents measured during the voltage steps to −80 mV. The current responses shown in A–C were taken as indicated in A. (C) Net change of whole-cell KATP produced by 0.1 mM tolbutamide added in the presence of 10 or 15 mM glucose and the amplitude of the Kslow current elicited by a train of depolarizations.

Similar articles

Cited by

References

    1. Ämmälä C., Bokvist K., Larsson O., Berggren P.O., Rorsman P. Demonstration of a novel apamin-insensitive calcium-activated K+ channel in mouse pancreatic B cells Pflügers Arch. 422 1993. 443 448b - PubMed
    1. Ämmälä C., Eliasson L., Bokvist K., Larsson O., Ashcroft F.M., Rorsman P. Exocytosis elicited by action potentials and voltage-clamp calcium currents in individual mouse pancreatic B-cells J. Physiol. 472 1993. 665 688a - PMC - PubMed
    1. Ämmälä C., Larsson O., Berggren P.O., Bokvist K., Juntti-Berggren L., Kindmark H., Rorsman P. Inositol triphosphate–dependent periodic activation of a Ca2+-activated K+ conductance in glucose-stimulated pancreatic β-cells. Nature. 1991;353:849–852. - PubMed
    1. Andreu E., Soria B., Sanchez-Andres J.V. Oscillation of gap junction electrical coupling in the mouse pancreatic islets of Langerhans. J. Physiol. 1997;498:753–761. - PMC - PubMed
    1. Ashcroft F.M., Rorsman P. Electrophysiology of the pancreatic β-cell. Prog. Biophys. Res. Commun. 1989;54:87–143. - PubMed

Publication types

MeSH terms

Substances