. 1999 Nov 29;147(5):959-68.
doi: 10.1083/jcb.147.5.959.

The TOM core complex: the general protein import pore of the outer membrane of mitochondria

Affiliations

The TOM core complex: the general protein import pore of the outer membrane of mitochondria

U Ahting et al. J Cell Biol. .

Abstract

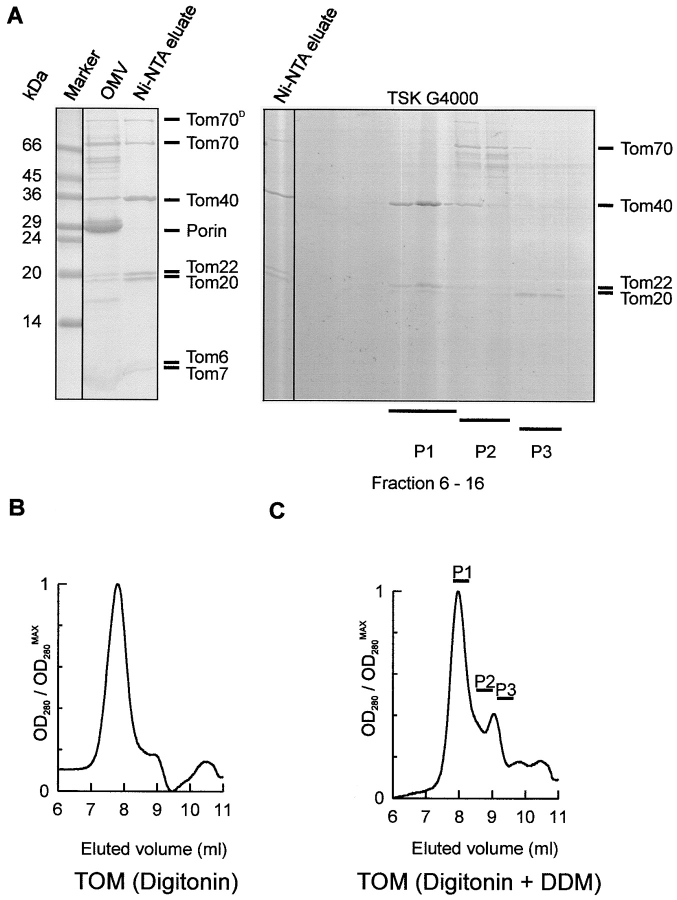
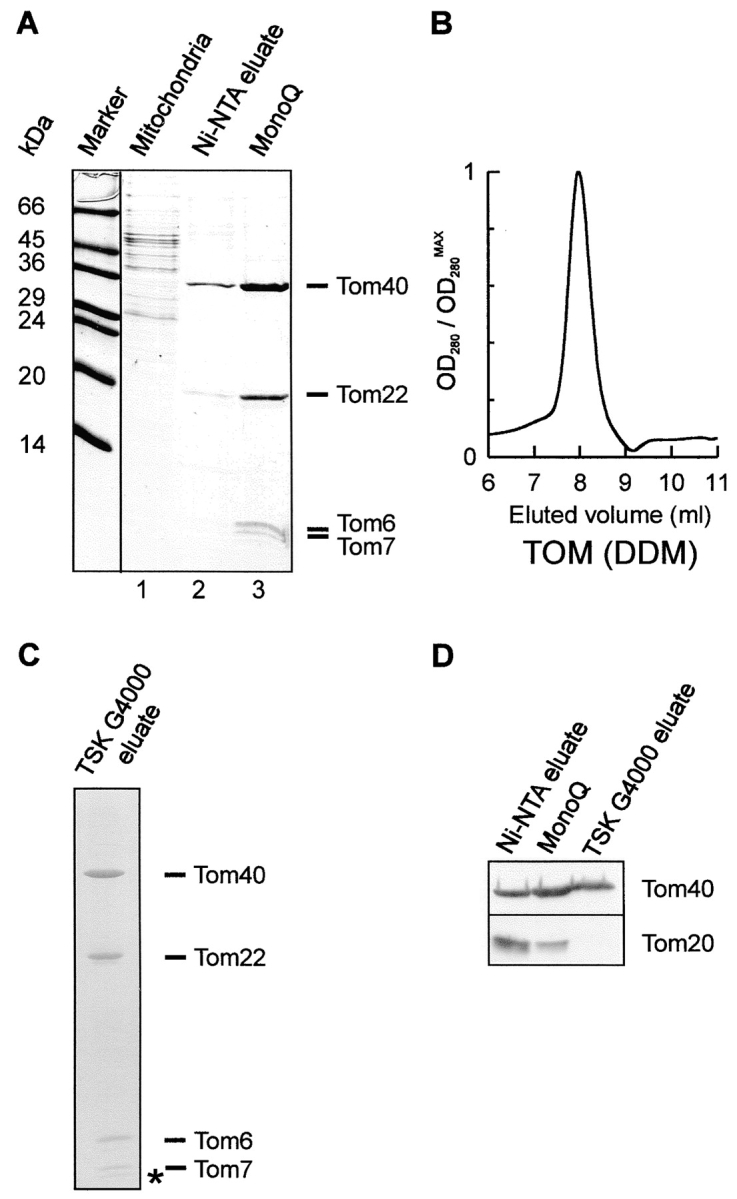
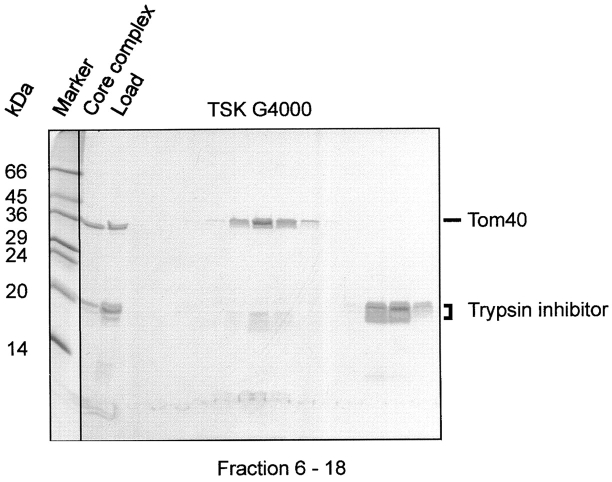
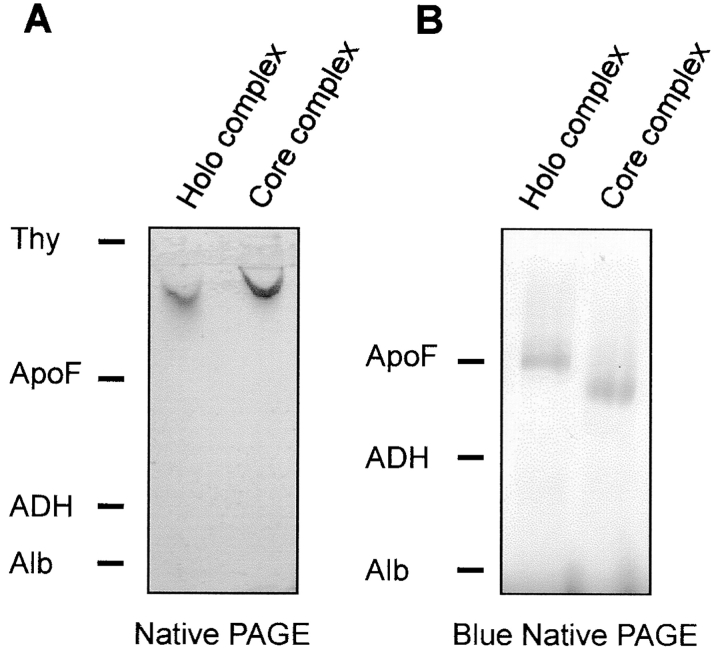
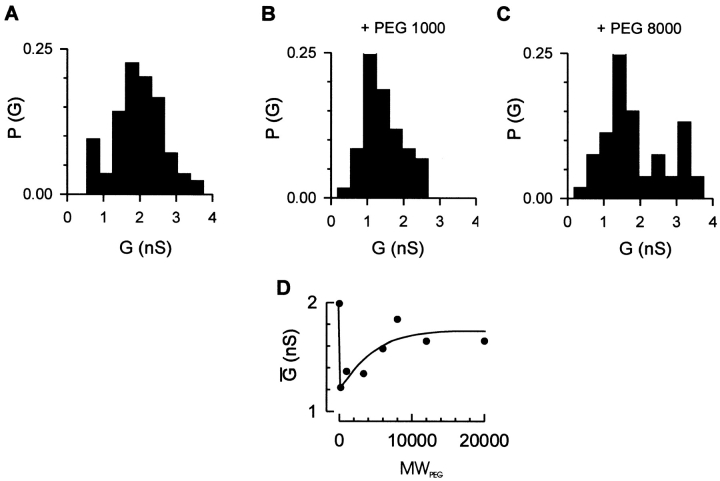
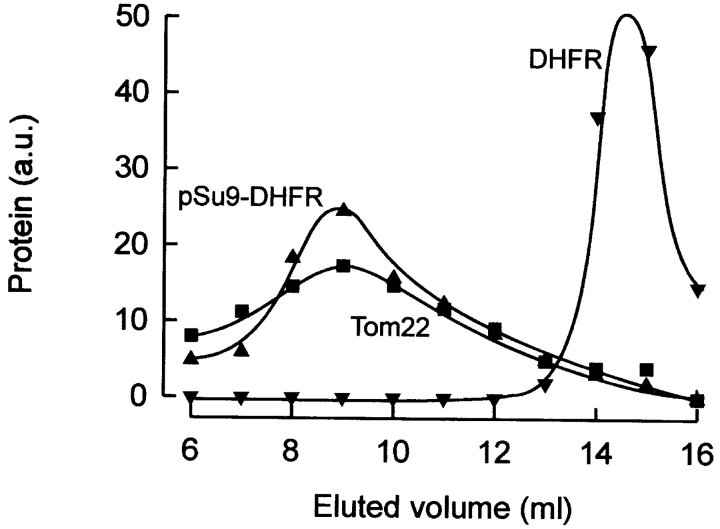
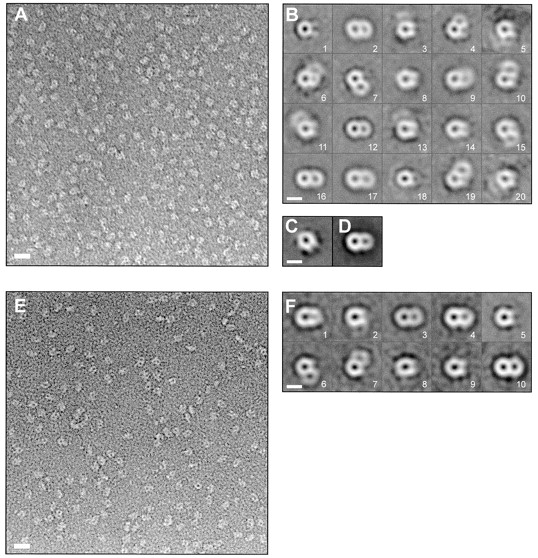
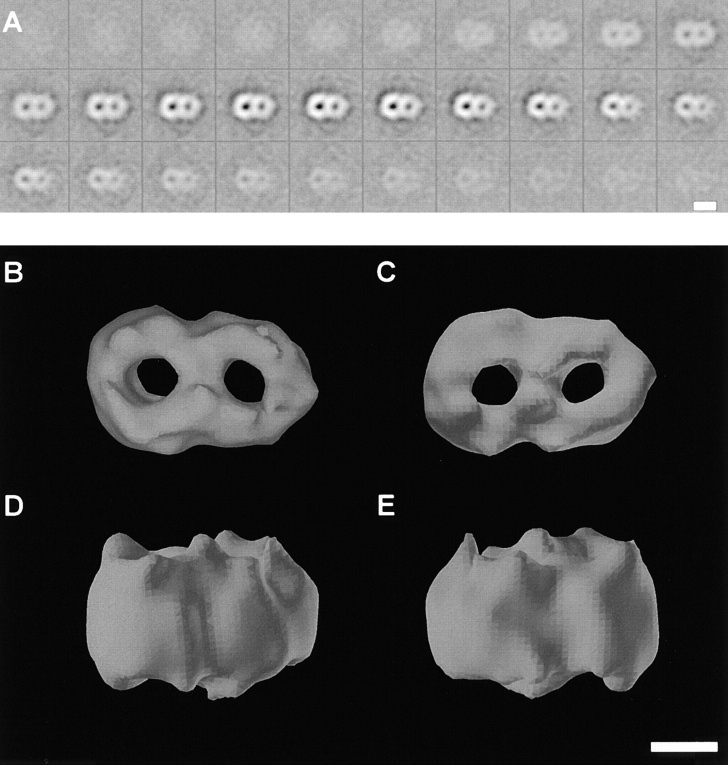
Translocation of nuclear-encoded preproteins across the outer membrane of mitochondria is mediated by the multicomponent transmembrane TOM complex. We have isolated the TOM core complex of Neurospora crassa by removing the receptors Tom70 and Tom20 from the isolated TOM holo complex by treatment with the detergent dodecyl maltoside. It consists of Tom40, Tom22, and the small Tom components, Tom6 and Tom7. This core complex was also purified directly from mitochondria after solubilization with dodecyl maltoside. The TOM core complex has the characteristics of the general insertion pore; it contains high-conductance channels and binds preprotein in a targeting sequence-dependent manner. It forms a double ring structure that, in contrast to the holo complex, lacks the third density seen in the latter particles. Three-dimensional reconstruction by electron tomography exhibits two open pores traversing the complex with a diameter of approximately 2.1 nm and a height of approximately 7 nm. Tom40 is the key structural element of the TOM core complex.


Figures

Figure 1
Figure 1
Dissociation of the purified TOM holo complex by detergent treatment into a TOM subcomplex and the import receptors Tom70 and Tom20. A, Left, SDS-PAGE of TOM holo complex. TOM holo complex was isolated from mitochondrial outer membrane vesicles of a Neurospora strain that carried a Tom22 with a hexahistidinyl tag. Isolated outer membrane vesicles were solubilized in digitonin and subjected to Ni-NTA chromatography. The lanes marked with OMV and Ni-NTA eluate represent solubilized mitochondrial outer membrane proteins, and TOM complex purified by Ni-NTA chromatography, respectively. Tom70D denotes the dimeric form of Tom70. The gel was stained with Coomassie brilliant blue. Right, Coomassie-stained SDS polyacrylamide gel of fractions from the gel filtration shown in C. B, Size-exclusion chromatography of TOM holo complex on a TSK G4000 PWXL column. The peak fraction corresponds to ∼490 kD and contained all the TOM complex proteins. C, Gel chromatography of purified Tom holo complex as in B, after incubation with 0.33% DDM. Elution was followed by monitoring absorption at 280 nm. P1, P2, and P3 represent fractions analyzed by gel electrophoresis. The peak fraction corresponds to ∼410 kD.
Figure 2
Figure 2
Purification of the TOM core complex. A, Isolation of the TOM core complex from mitochondria. Mitochondria from a Neurospora strain containing a Tom22 with a 6×His tag were solubilized in DDM and bound to Ni-NTA. Bound complex was eluted with imidazole. Fractions containing Tom40 were pooled and further purified by anion-exchange chromatography on a MonoQ column. Fractions were analyzed by SDS-PAGE and proteins were stained with Coomassie brilliant blue. Lane 1, Total mitochondrial protein solubilized in DDM; lane 2, eluant from Ni-NTA; lane 3, peak fraction of MonoQ chromatography. B, Size-exclusion chromatography on a TSK G4000 PWXL column of purified TOM core complex. The elution profile was revealed by monitoring absorption at 280 nm. The peak fraction corresponds to ∼410 kD. C, The peak fraction of the TSK sizing column analyzed by high Tris/urea SDS-PAGE and Coomassie staining. The asterisk denotes the band that possibly represents Tom5. D, Analysis of peak column fractions by SDS-PAGE and immunoblotting using antibodies against Tom40 and Tom20. Tom20 was completely removed from the core complex after passage over a Ni-NTA affinity, MonoQ, and TSK G4000 sizing column.
Figure 3
Figure 3
Limited proteolysis of purified TOM core complex. Purified TOM core complex was treated with 100 μg ml−1 trypsin. After addition of trypsin inhibitor, the complex was subjected to size-exclusion chromatography and SDS-PAGE. No intact Tom22 protein was detected after trypsin treatment. Proteins were stained with Coomassie brilliant blue.
Figure 4
Figure 4
Native gel electrophoresis of the TOM complexes. A, Native PAGE (Phast) of purified TOM holo complex and isolated core complex. B, Blue native gel electrophoresis of TOM holo complex and core complex. Gels were stained with Coomassie. Marker proteins: Thy, thyroglobulin (669 kD); ApoF, apoferritin (443 kD); ADH, alcohol dehydrogenase (155 kD); Alb, albumin (66 kD).
Figure 5
Figure 5
Channel conductance of the TOM core complex in the presence of differently sized nonelectrolyte polymers. Purified TOM core complex (2 μg ml−1 final concentration) was added to both sides of a black lipid bilayer formed of diphytanoyl phosphatidyl choline/n-decane. Single channel conductances were measured at a membrane potential of ΔV = +20 mV. Histograms of channel conductances in polymer-free solution (A), in the presence of PEG1000 (B), and in the presence of PEG8000 (C). P(G) is the probability that a given conductance increment G is observed. D, Dependence of PEG-induced channel conductance change on the polymer weight. The electrolytes contained 1 M KCl, 5 mM Hepes, pH 7.0; the PEG concentrations were 20% (wt/vol), respectively. The data represent the mean conductances of n = 84, 56, 59, 22, 97, 53, 54, and 31 measurements in the absence and the presence of PEG 200, PEG 1000, PEG 3,350, PEG 6000, PEG 8,000, PEG 12,000, and PEG 20,000, respectively. Note that addition of PEG to a polymer-free solution decreases the single channel conductance due to the reduced bulk electrolyte conductance.
Figure 6
Figure 6
Preprotein binding to TOM core complex. Recombinant pSu9-DHFR (100 μg) was incubated with purified mitochondrial outer membrane vesicles (200 μg). They were incubated with DDM and subjected to gel filtration on TSK G-4000 PWXL. TOM complex and pSu9-DHFR in the eluate was analyzed by SDS-PAGE and immunoblotting with antibodies recognizing Tom22 and DHFR. As a control, the same protocol was performed with DHFR instead of pSu9-DHFR.
Figure 7
Figure 7
EM and projection map of the TOM core complex. A, Survey view of negatively stained TOM core complex. The image was filtered to the first zero of the electron microscope contrast transfer function. Bar, 11 nm. B, Classification analysis of 1,598 TOM core complex particles. Using MSA, the data set was split into 20 classes. Classes 1–20, represent the averages of 77, 175, 36, 59, 32, 39, 50, 102, 121, 40, 59, 163, 26, 59, 79, 159, 211, 50, 46, and 15 particle images, respectively. Bar, 7 nm. C and D, Group averages of the core complex that showed one and two pores, respectively, were merged, yielding two main groups that were subjected to further alignment, classification, and averaging. The maps shown in C and D were calculated from 306 and 866 particles, respectively. Bar, 7 nm. E, Survey view of trypsin-treated core complex. Bar, 11 nm. F, Classification analysis of 777 trypsin-treated TOM core complex particles. The data set was split into 20 classes, as in B. Classes 1–10 represent the averages of 51, 59, 131, 93, 120, 88, 34, 40, 35 and 102 particle images, respectively. Class averages of <10 particle images are not shown. Bar, 7 nm.
Figure 8
Figure 8
3D map of the TOM core complex obtained by electron tomography. Negatively stained TOM core complex particles were reconstructed individually, before the data set was subjected to 3D alignment, classification, and averaging. A, Gray level representation of horizontal slices through the average volume at a distance of 0.344 nm. Bar, 7 nm. B, Top view. C, Bottom view. D and E, Two different side views. The threshold for the isosurface representation was set to 64% of the molecular mass of 410 kD to achieve noise free representation. Bar, 3.5 nm.

References

    1. Alconada A., Kubrich M., Moczko M., Hönlinger A., Pfanner N. The mitochondrial receptor complexthe small subunit Mom8b/Isp6 supports association of receptors with the general insertion pore and transfer of preproteins. Mol. Cell. Biol. 1995;15:6196–6205. - PMC - PubMed
    1. Bains G., Lithgow T. The Tom channel in the outer membranealive and kicking. BioEssays. 1999;21:1–4. - PubMed
    1. Benz R., Janko K., Boos W., Läuger P. Formation of large, ion-permeable membrane channels by the matrix protein (porin) of Escherichia coli . Biochim. Biophys. Acta. 1978;511:305–319. - PubMed
    1. Brix J., Dietmeier K., Pfanner N. Differential recognition of preproteins by the purified cytosolic domains of the mitochondrial import receptors Tom20, Tom22, and Tom70. J. Biol. Chem. 1997;272:20730–20735. - PubMed
    1. Cao W., Douglas M.G. Biogenesis of ISP6, a small carboxyl-terminal anchored protein of the receptor complex of the mitochondrial outer membrane. J. Biol. Chem. 1995;270:5674–5679. - PubMed

Publication types

MeSH terms