. 1999 Nov 15;13(22):3003-14.
doi: 10.1101/gad.13.22.3003.

Nuclear matrix attachment regions antagonize methylation-dependent repression of long-range enhancer-promoter interactions

Affiliations

Nuclear matrix attachment regions antagonize methylation-dependent repression of long-range enhancer-promoter interactions

W C Forrester et al. Genes Dev. .

Abstract

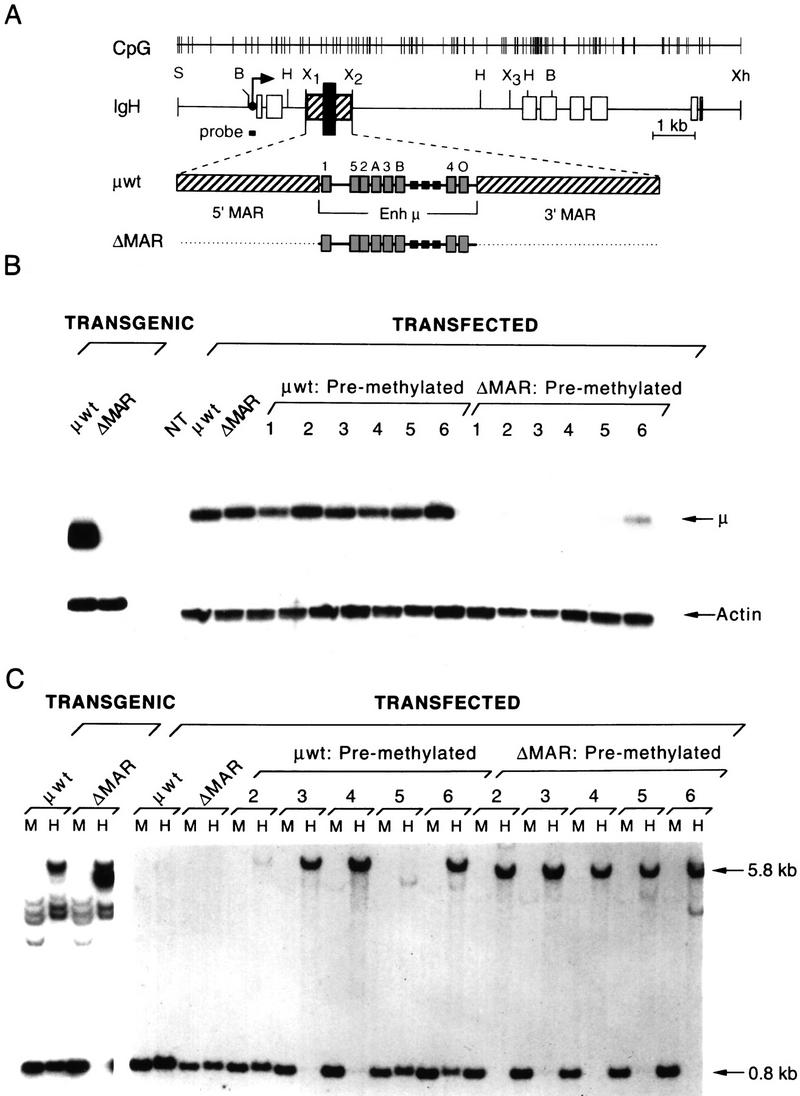
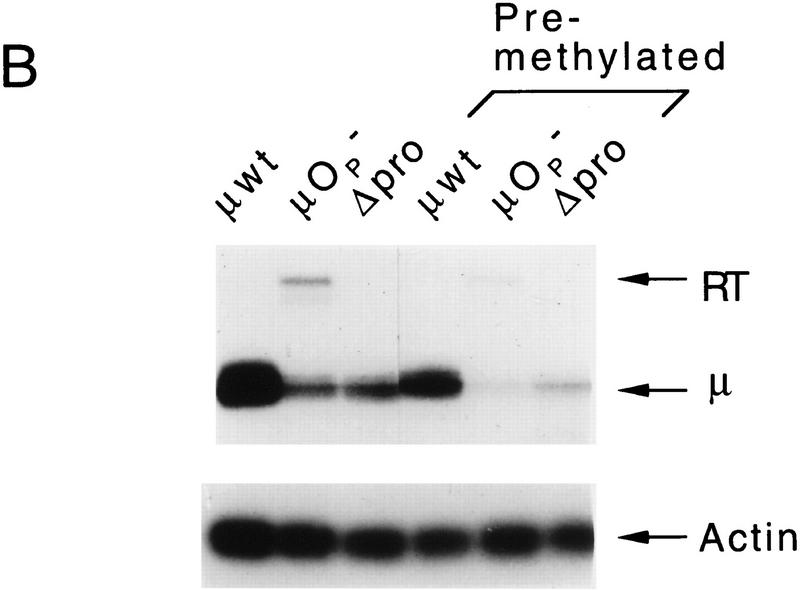
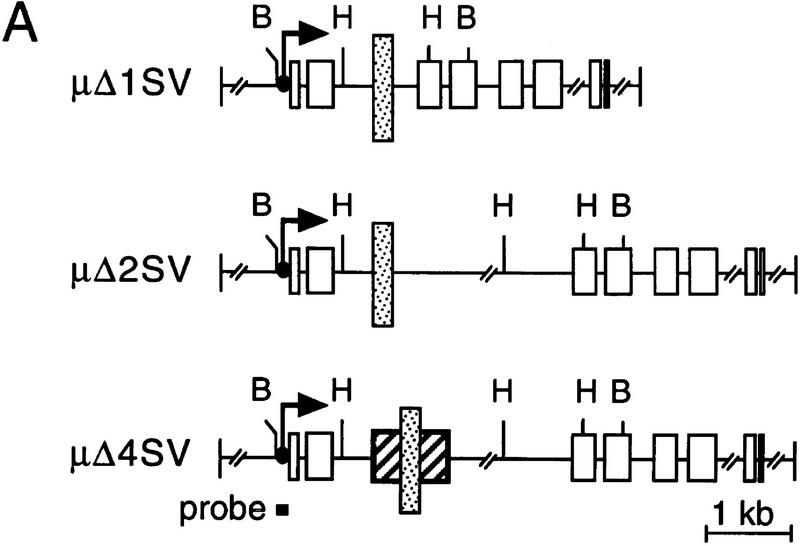
The immunoglobulin intragenic mu enhancer region acts as a locus control region that mediates transcriptional activation over large distances in germ line transformation assays. In transgenic mice, but not in transfected tissue culture cells, the activation of a variable region (V(H)) promoter by the mu enhancer is dependent on flanking nuclear matrix attachment regions (MARs). Here, we examine the effects of DNA methylation, which occurs in early mouse development, on the function of the mu enhancer and the MARs. We find that methylation of rearranged mu genes in vitro, before transfection, represses the ability of the mu enhancer to activate the V(H) promoter over the distance of 1.2 kb. However, methylation does not affect enhancer-mediated promoter activation over a distance of 150 bp. In methylated DNA templates, the mu enhancer alone induces only local chromatin remodeling, whereas in combination with MARs, the mu enhancer generates an extended domain of histone acetylation. These observations provide evidence that DNA methylation impairs the distance independence of enhancer function and thereby imposes a requirement for additional regulatory elements, such as MARs, which facilitate long-range chromatin remodeling.


Figures

Figure 1
Figure 1
Analysis of the expression and methylation status of rearranged wild-type and ΔMAR μ genes in transgenic mice and stably transfected B cells. (A) Structure of the rearranged μ gene. Above the map of the μ gene, the positions of all CpG dinucleotides are indicated as vertical lines. The intragenic locus control region (LCR), enlarged below, contains the enhancer (Enh μ; black bar), flanked by matrix attachment regions (MARs; hatched bars). The exons are shown as open boxes, and the transcription start site of the VH promoter is indicated by an arrow. Transcription factor-binding sites are indicated as gray boxes with numbers 1–5 corresponding to binding sites for proteins of the E2A family, the A and B sites are recognized by Ets family proteins and PU.1, respectively, and the O site interacts with Oct proteins. Small black boxes represent SV40 enhancer core sequences (Ernst and Smale 1995). Relevant restriction sites: (S) Sal; (B) Bam; (H) HpaII/Msp; (X) Xba sites 1–3; and (Xh) Xho. (B) S1 nuclease protection assay detecting specific μ transcripts in transgenic and transfected M12 cells. μ wild-type and ΔMAR genes were stably transfected in an unmethylated or in vitro premethylated form. The positions of the specific μ transcripts and the endogenous β-actin transcripts are indicated. Numbers represent individual cell clones. (NT) nontransfected cell line. For the S1 nuclease protection assays, 10 and 20 μg of total cytoplasmic RNA were used to detect actin and μ-specific transcripts, respectively. (C) Analysis of the methylation pattern of the transgenic or transfected μ genes. Genomic DNA from the corresponding cells was digested to completion with BamHI and with either Msp (M) or HpaII (H), and blots were hybridized with a radiolabled probe that abuts the 5′ Bam site as shown in A.
Figure 2
Figure 2
Analysis of the chromatin structure of transfected ΔMAR genes by DNase I digestion. Nuclei from M12 cells stably transfected with an unmethylated or methylated ΔMAR gene were digested with increasing amounts of DNase I. Genomic DNA was digested with ScaI–BglII and hybridized with a 0.67-kb EcoRI–HindIII DNA probe. (A) DNase I hypersensitivity at the μ enhancer is indicated by arrow labeled EμT for the transfected and EμE for the endogenous μ locus. (B) General DNase I sensitivity of the transfected ΔMAR gene (IgHT) in comparison to transcriptionally active (IgHE and mb-1) and transcriptionally inactive (MyoD and the pseudogene ϑmb-1) endogenous gene loci. The sizes of the DNA fragments, in kilobases, are shown at right.
Figure 2
Figure 2
Analysis of the chromatin structure of transfected ΔMAR genes by DNase I digestion. Nuclei from M12 cells stably transfected with an unmethylated or methylated ΔMAR gene were digested with increasing amounts of DNase I. Genomic DNA was digested with ScaI–BglII and hybridized with a 0.67-kb EcoRI–HindIII DNA probe. (A) DNase I hypersensitivity at the μ enhancer is indicated by arrow labeled EμT for the transfected and EμE for the endogenous μ locus. (B) General DNase I sensitivity of the transfected ΔMAR gene (IgHT) in comparison to transcriptionally active (IgHE and mb-1) and transcriptionally inactive (MyoD and the pseudogene ϑmb-1) endogenous gene loci. The sizes of the DNA fragments, in kilobases, are shown at right.
Figure 3
Figure 3
Analysis of the expression and methylation status of the 5′Enh gene. (A) Structure of the 5′Enh gene in which the 220-bp enhancer (Enh) fragment lacking both MARs was inserted at a BamHI site 154 bp upstream of the VH transcription initiation site. (B) Analysis of the transcriptional state of unmethylated and premethylated 5′Enh genes in individual stably transfected M12 clones by S1 nuclease protection. The positions of VH-initiated transcripts (μ) and transcripts initiating upstream of the normal start sites (RT) are indicated. (C) Analysis of the methylation status is as described previously (Fig. 1C).
Figure 3
Figure 3
Analysis of the expression and methylation status of the 5′Enh gene. (A) Structure of the 5′Enh gene in which the 220-bp enhancer (Enh) fragment lacking both MARs was inserted at a BamHI site 154 bp upstream of the VH transcription initiation site. (B) Analysis of the transcriptional state of unmethylated and premethylated 5′Enh genes in individual stably transfected M12 clones by S1 nuclease protection. The positions of VH-initiated transcripts (μ) and transcripts initiating upstream of the normal start sites (RT) are indicated. (C) Analysis of the methylation status is as described previously (Fig. 1C).
Figure 4
Figure 4
Analysis of the expression and methylation status of μ genes containing a single MAR. (A) Structure of genes lacking either the 3′MAR or the 5′MAR. The positions of BamHI and HpaII (H) sites are indicated. In these constructs, a HpaII site has been introduced at the 3′ end of the enhancer. (B) S1 nuclease protection assay of total cytoplasmic RNA isolated from stably transfected pools of S194 cells. (C) Analysis of the methylation status by digestion with BamHI and either MspI or HpaII. The size of the BamHI–HpaII fragment generated by cleavage at the enhancer-proximal HpaII site is 1.4 kb for the ΔMAR and Δ5′MAR, and it is 1.7 kb for the Δ3′MAR gene construct. The probe, shown in A, also hybridizes with an endogenous S194 DNA fragment indicated by an open arrow.
Figure 4
Figure 4
Analysis of the expression and methylation status of μ genes containing a single MAR. (A) Structure of genes lacking either the 3′MAR or the 5′MAR. The positions of BamHI and HpaII (H) sites are indicated. In these constructs, a HpaII site has been introduced at the 3′ end of the enhancer. (B) S1 nuclease protection assay of total cytoplasmic RNA isolated from stably transfected pools of S194 cells. (C) Analysis of the methylation status by digestion with BamHI and either MspI or HpaII. The size of the BamHI–HpaII fragment generated by cleavage at the enhancer-proximal HpaII site is 1.4 kb for the ΔMAR and Δ5′MAR, and it is 1.7 kb for the Δ3′MAR gene construct. The probe, shown in A, also hybridizes with an endogenous S194 DNA fragment indicated by an open arrow.
Figure 5
Figure 5
The VH promoter is not necessary for μ LCR function. (A) Structure of genes containing point mutations in the VH promoter octamer site (μOp−) or a deletion of all sequences 5′ to the transcription initiation site (Δpro). (B) RNA anaysis by S1 nuclease protection. In μOp−, some transcripts, initiated at upstream start sites, read through the normal cap site (RT). In the Δpro gene, transcripts initiated at the VH start site or in the 5′ flanking mouse DNA will produce the same protected S1 fragment. (C) Analysis of the methylation status of transfected (Transf.) genes. The μOp− gene generates restriction fragments similar to those of the wild-type gene. In contrast, the digestion pattern of the Δpro gene is more complex because this analysis surveys genomic sequences at the junction of each chromosomal integration site. Endogenous cross-hybridizing restriction fragments (Endog.) are indicated.
Figure 5
Figure 5
The VH promoter is not necessary for μ LCR function. (A) Structure of genes containing point mutations in the VH promoter octamer site (μOp−) or a deletion of all sequences 5′ to the transcription initiation site (Δpro). (B) RNA anaysis by S1 nuclease protection. In μOp−, some transcripts, initiated at upstream start sites, read through the normal cap site (RT). In the Δpro gene, transcripts initiated at the VH start site or in the 5′ flanking mouse DNA will produce the same protected S1 fragment. (C) Analysis of the methylation status of transfected (Transf.) genes. The μOp− gene generates restriction fragments similar to those of the wild-type gene. In contrast, the digestion pattern of the Δpro gene is more complex because this analysis surveys genomic sequences at the junction of each chromosomal integration site. Endogenous cross-hybridizing restriction fragments (Endog.) are indicated.
Figure 6
Figure 6
Specificity of enhancer–MAR interaction. (A) Structure of μ genes containing the SV40 enhancer (stippled box, see Materials and methods). In μΔ1SV, the SV40 enhancer is inserted between Xba sites 1 and 3, in μΔ2SV the SV40 enhancer was inserted between Xba sites 1 and 2. In μΔ4SV, the μ enhancer was replaced with SV40 enhancer without removing the flanking MARs. (B) RNA analysis by nuclease S1 nuclease protection assay. (C) Analysis of the methylation state of the transfected genes as described in Fig. 1C.
Figure 6
Figure 6
Specificity of enhancer–MAR interaction. (A) Structure of μ genes containing the SV40 enhancer (stippled box, see Materials and methods). In μΔ1SV, the SV40 enhancer is inserted between Xba sites 1 and 3, in μΔ2SV the SV40 enhancer was inserted between Xba sites 1 and 2. In μΔ4SV, the μ enhancer was replaced with SV40 enhancer without removing the flanking MARs. (B) RNA analysis by nuclease S1 nuclease protection assay. (C) Analysis of the methylation state of the transfected genes as described in Fig. 1C.
Figure 7
Figure 7
Analysis of histone acetylation in premethylated wild-type and ΔMAR μ genes. Formaldehyde-fixed chromatin extracts from M12 cells, transfected with the premethylated μ wild-type gene (clone 5) or the ΔMAR gene (clone 5), were immunoprecipitated using specific antiserum raised against acetylated histone H3, acetylated histone H4, and preimmune serum as a control. Bound chromatin was recovered and used as a template for PCR amplification. A series of fourfold dilutions of the immunoprecipitated DNA, starting with 10 ng, was used for the amplification and detection of VDJ exon sequences (300-bp product) and mb-1 promoter sequences (350-bp product) as internal control. Ten nanograms of total DNA “input” from each of the cell lines was used to assess the relative enrichment of specific sequences in the immunoprecipitations. Specific amplification products were analyzed by electrophoresis through a 3% agarose gel.

Similar articles

Cited by

References

    1. Adams JM, Harris AW, Pinkert CA, Corcoran LM, Alexander WS, Cory S, Palmiter RD, Brinster RL. The c-myc oncogene driven by immunoglobulin enhancers induces lymphoid malignancy in transgenic mice. Nature. 1985;318:533–538. - PubMed
    1. Bagga R, Emerson BM. An HMG I/Y-containing repressor complex and supercoiled DNA topology are critical for long-range enhancer-dependent transcription in vitro. Genes & Dev. 1997;11:629–639. - PubMed
    1. Belyaev ND, Keohane AM, Turner BM. Histone H4 acetylation and replication timing in Chinese hamster chromosomes. Exp Cell Res. 1996;225:277–285. - PubMed
    1. Bhattacharya SK, Ramchandani S, Cervoni N, Szyf M. A mammalian protein with specific demethylase activity for mCpG DNA. Nature. 1999;397:579–583. - PubMed
    1. Blackwood EM, Kadonaga JT. Going the distance: A current view of enhancer action. Science. 1998;281:61–63. - PubMed

Publication types

MeSH terms