

Permeability and single channel conductance of human homomeric rho1 GABAC receptors
- PMID: 10581305
- PMCID: PMC2269674
- DOI: 10.1111/j.1469-7793.1999.00327.x
Permeability and single channel conductance of human homomeric rho1 GABAC receptors
Abstract
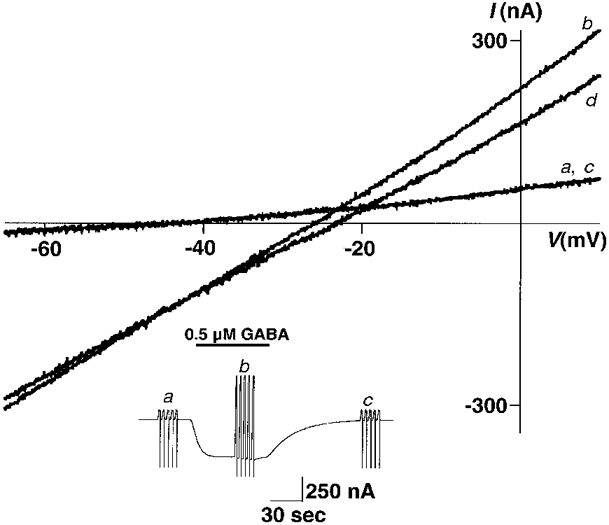
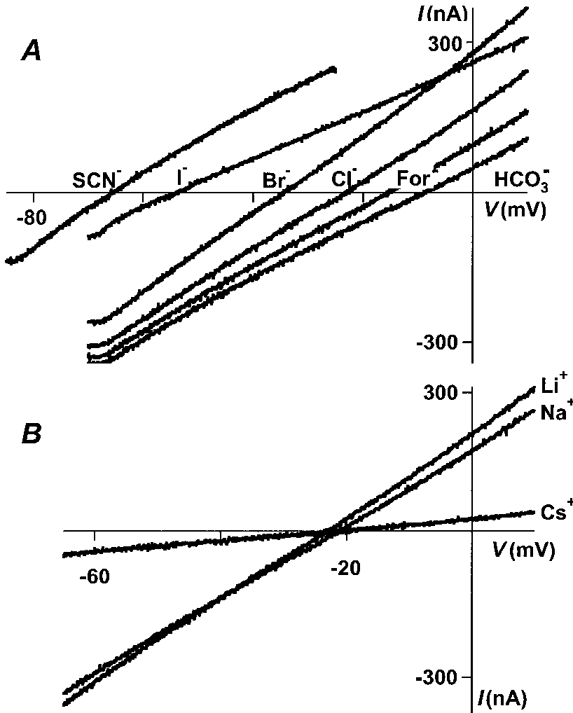
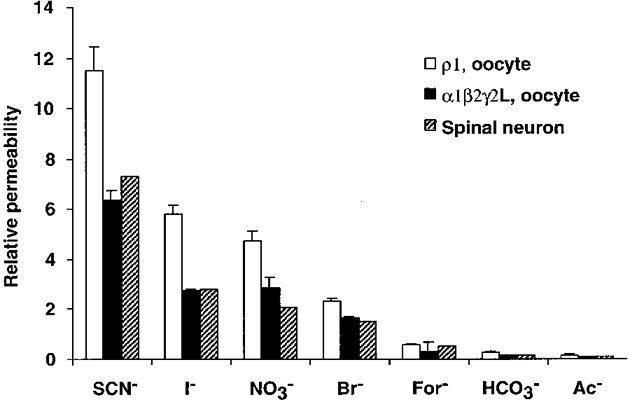
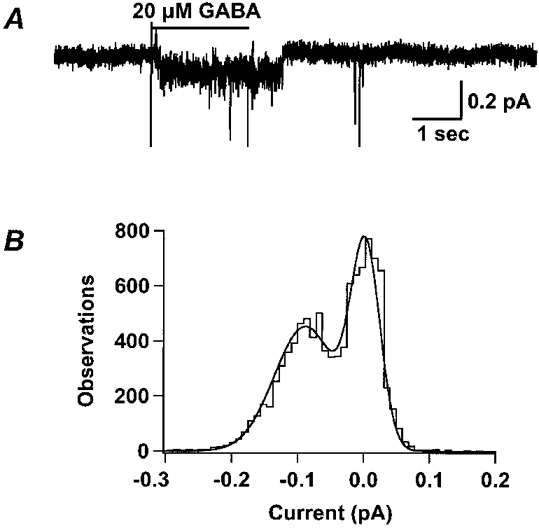
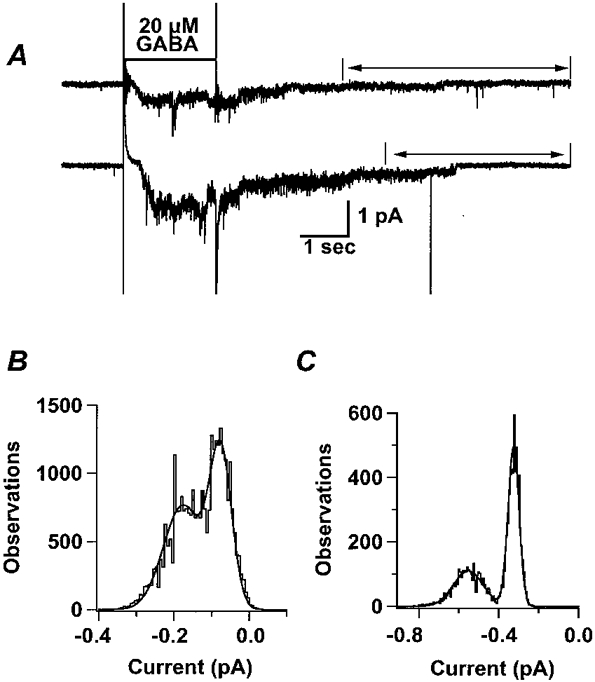
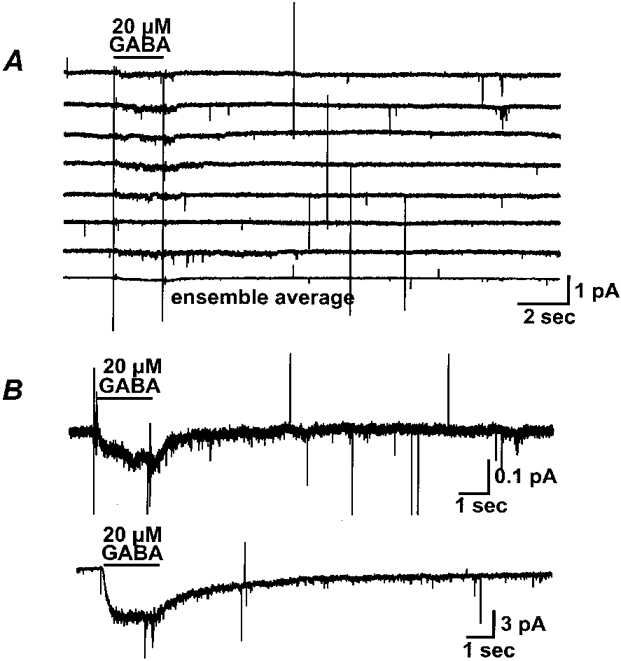
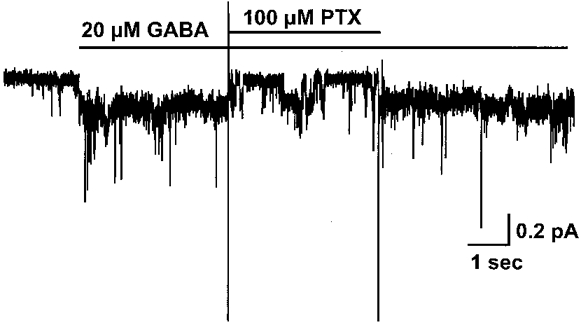
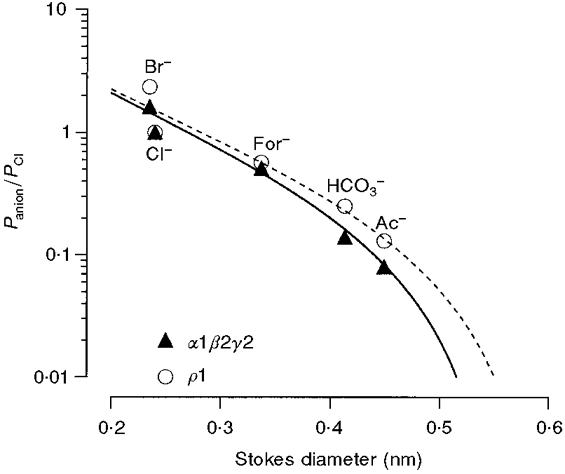
1. Homomeric human rho1 GABAC receptors were expressed in Xenopus oocytes and in human embryonic kidney cells (HEK293) in order to examine their conductance and permeability. 2. Reversal potentials of currents elicited by gamma-aminobutyric acid (GABA) were measured in extracellular solutions of various ionic composition to determine relative permeability of homomeric rho1 receptors. The rank order of anionic permeability was: SCN- > I- > NO3- > Br- > Cl- > formate (For-) > HCO3- > acetate (Ac-) approximately proprionate (Prop-) approximately isethionate (Ise-) approximately F- approximately PO4-. 3. In the oocyte expression system, relative permeabilities to SCN-, I-, NO3-, Br- and HCO3- were higher for rho1 GABAC receptors than alpha1beta2gamma2L GABAA receptors. 4. Expression of rho1 GABAC receptors in Xenopus oocytes and in HEK293 cells gave similar relative permeabilities for selected anions, suggesting that the expression system does not significantly alter permeation properties. 5. The pore diameter of the homomeric rho1 GABAC receptor expressed in oocytes was estimated to be 0.61 nm, which is somewhat larger than the 0.56 nm pore diameter estimated for alpha1beta2gamma2L GABAA receptors. 6. Homomeric rho1 GABA receptors expressed in oocytes had a single channel chord conductance of 0.65 +/- 0.04 pS (mean +/- s.e.m.) when the internal chloride concentration ([Cl-]i) was 20 mM. With a [Cl-]i of 100 mM, the single channel chord conductance was 1.59 +/- 0.24 pS. 7. The mean open time directly measured from 43 GABA-induced channel openings in six patches was 3. 2 +/- 0.8 s. The mean open time in the presence of 100 microM picrotoxin was 0.07 +/- 0.01 s (77 openings from 3 patches). 8. The differences observed in ionic permeabilities, pore size, single channel conductance and mean open time suggest that the rho1 homomeric receptor may not be the native retinal GABAC receptor reported previously.
Figures
Similar articles
-
Evidence for coassembly of mutant GABAC rho1 with GABAA gamma2S, glycine alpha1 and glycine alpha2 receptor subunits in vitro.Eur J Neurosci. 2000 Sep;12(9):3137-45. doi: 10.1046/j.1460-9568.2000.00198.x. Eur J Neurosci. 2000. PMID: 10998097
-
Suramin is a novel competitive antagonist selective to α1β2γ2 GABAA over ρ1 GABAC receptors.Neuropharmacology. 2018 Oct;141:148-157. doi: 10.1016/j.neuropharm.2018.08.036. Epub 2018 Aug 30. Neuropharmacology. 2018. PMID: 30172846
-
Modulation of recombinant GABA receptor/channel subunits by domain-specific antibodies in Xenopus oocytes.J Membr Biol. 2001 Oct 1;183(3):205-13. doi: 10.1007/s00232-001-0068-3. J Membr Biol. 2001. PMID: 11696862
-
Mechanism of anion permeation through channels gated by glycine and gamma-aminobutyric acid in mouse cultured spinal neurones.J Physiol. 1987 Apr;385:243-86. doi: 10.1113/jphysiol.1987.sp016493. J Physiol. 1987. PMID: 2443667 Free PMC article. Review.
-
[GABAC receptors: structure and functions].Eksp Klin Farmakol. 2011;74(1):45-9. Eksp Klin Farmakol. 2011. PMID: 21476276 Review. Russian.
Cited by
-
Studies on the mechanisms of action of picrotoxin, quercetin and pregnanolone at the GABA rho 1 receptor.Br J Pharmacol. 2004 Feb;141(4):717-27. doi: 10.1038/sj.bjp.0705657. Epub 2004 Jan 19. Br J Pharmacol. 2004. PMID: 14732759 Free PMC article.
-
Mutations at the GABA receptor selectivity filter: a possible role for effective charges.J Physiol. 2003 Apr 15;548(Pt 2):527-40. doi: 10.1113/jphysiol.2002.032045. Epub 2003 Mar 7. J Physiol. 2003. PMID: 12626678 Free PMC article.
-
Cation-selective mutations in the M2 domain of the inhibitory glycine receptor channel reveal determinants of ion-charge selectivity.J Gen Physiol. 2002 May;119(5):393-410. doi: 10.1085/jgp.20028552. J Gen Physiol. 2002. PMID: 11981020 Free PMC article.
-
An Update on GABAρ Receptors.Curr Neuropharmacol. 2010 Dec;8(4):422-33. doi: 10.2174/157015910793358141. Curr Neuropharmacol. 2010. PMID: 21629448 Free PMC article.
-
A single amino acid in the second transmembrane domain of GABA rho receptors regulates channel conductance.Neurosci Lett. 2007 May 17;418(2):205-9. doi: 10.1016/j.neulet.2007.03.020. Epub 2007 Mar 14. Neurosci Lett. 2007. PMID: 17398006 Free PMC article.
References
-
- Albrecht BE, Breitenbach U, Stuhmer T, Harvey RJ, Darlison MG. In situ hybridization and reverse transcription-polymerase chain reaction studies on the expression of the GABAC receptor ρ1- and ρ2-subunit genes in avian and rat brain. European Journal of Neuroscience. 1997;9:2414–2422. - PubMed
-
- Amin J, Weiss DS. Homomeric ρ1 GABA channels: activation properties and domains. Receptors and Channels. 1994;2:227–236. - PubMed
-
- Collins KD, Washabaugh MW. The Hofmeister effect and the behaviour of water at interfaces. Quarterly Review of Biophysics. 1985;18:323–422. - PubMed
-
- Cutting GR, Lu L, O'Hara BF, Kasch LM, Montrose-Rafizadeh C, Donovan DM, Schimada S, Antonarakis SE, Guggino WB, Uhl GR, Kazazian HH. Cloning of the γ-aminobutyric acid (GABA) ρ1 cDNA: A GABA receptor subunit highly expressed in the retina. Proceedings of the National Academy of Sciences of the USA. 1991;88:2673–2677. - PMC - PubMed
Publication types
MeSH terms
Substances
Grants and funding
LinkOut - more resources
Full Text Sources