

A study of deep-sea natural microbial populations and barophilic pure cultures using a high-pressure chemostat
- PMID: 10583982
- PMCID: PMC91722
- DOI: 10.1128/AEM.65.12.5314-5321.1999
A study of deep-sea natural microbial populations and barophilic pure cultures using a high-pressure chemostat
Abstract
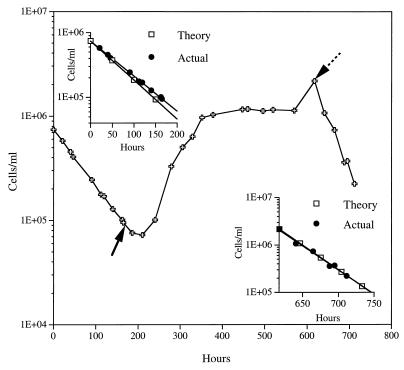
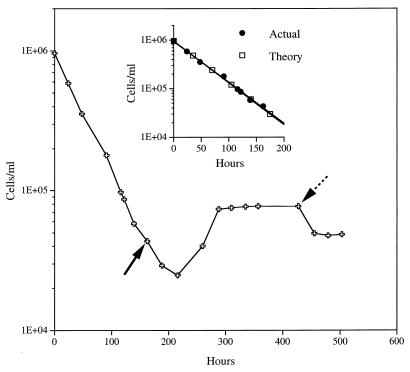
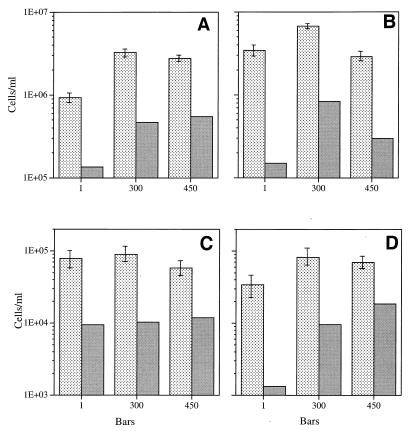
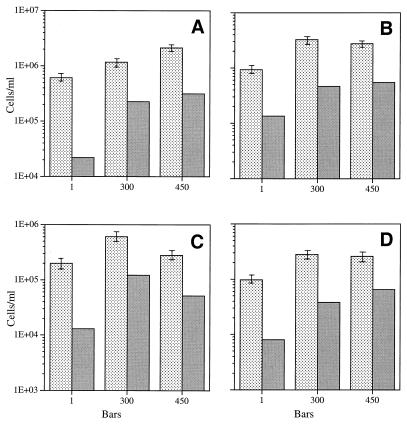
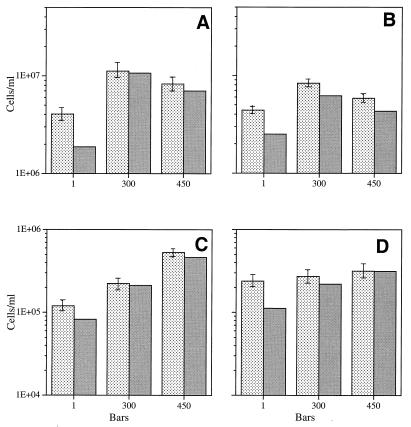
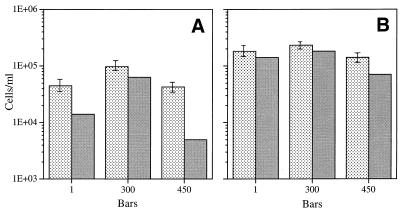
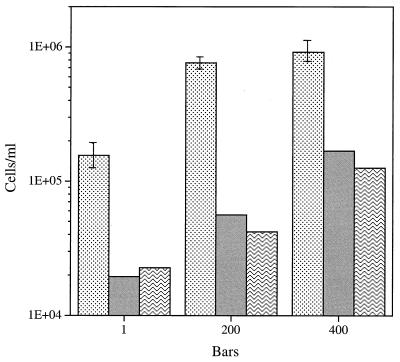
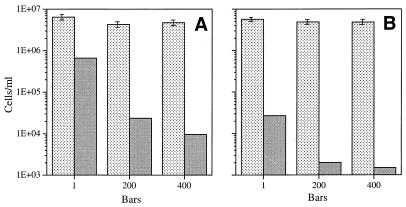
Continuous cultures in which a high-pressure chemostat was used were employed to study the growth responses of (i) deep-sea microbial populations with the naturally occurring carbon available in seawater and with limiting concentrations of supplemental organic substrates and (ii) pure cultures of copiotrophic barophilic and barotolerant deep-sea isolates in the presence of limiting carbon concentrations at various pressures, dilution rates, and temperatures. We found that the growth rates of natural populations could not be measured or were extremely low (e.g., a doubling time of 629 h), as determined from the difference between the dilution rate and the washout rate. A low concentration of supplemental carbon (0.33 mg/liter) resulted in positive growth responses in the natural population, which resulted in an increase in the number of cells and eventually a steady population of cells. We found that the growth responses to imposed growth pressure by barophilic and barotolerant pure-culture isolates that were previously isolated and characterized under high-nutrient-concentration conditions were maintained under the low-nutrient-concentration limiting conditions (0.33 to 3.33 mg of C per liter) characteristic of the deep-sea environment. Our results indicate that deep-sea microbes can respond to small changes in substrate availability. Also, barophilic microbes that are copiotrophic as determined by their isolation in the presence of high carbon concentrations and their preference for high carbon concentrations are versatile and are able to compete and grow as barophiles in the low-carbon-concentration oligotrophic deep-sea environment in which they normally exist.
Figures
Similar articles
-
A pressurized chemostat for the study of marine barophilic and oligotrophic bacteria.Appl Environ Microbiol. 1996 May;62(5):1593-6. doi: 10.1128/aem.62.5.1593-1596.1996. Appl Environ Microbiol. 1996. PMID: 16535311 Free PMC article.
-
Photobacterium profundum sp. nov., a new, moderately barophilic bacterial species isolated from a deep-sea sediment.Extremophiles. 1998 Jan;2(1):1-7. doi: 10.1007/s007920050036. Extremophiles. 1998. PMID: 9676237
-
Distribution of the pressure-regulated operons in deep-sea bacteria.FEMS Microbiol Lett. 1998 Feb 15;159(2):159-66. doi: 10.1111/j.1574-6968.1998.tb12855.x. FEMS Microbiol Lett. 1998. PMID: 9503608
-
Barophiles: deep-sea microorganisms adapted to an extreme environment.Curr Opin Microbiol. 1998 Jun;1(3):291-5. doi: 10.1016/s1369-5274(98)80032-5. Curr Opin Microbiol. 1998. PMID: 10066496 Review.
-
The molecular biology of barophilic bacteria.Extremophiles. 1997 Aug;1(3):111-6. doi: 10.1007/s007920050023. Extremophiles. 1997. PMID: 9680316 Review.
Cited by
-
Gut Microbial Divergence Between Three Hadal Amphipod Species from the Isolated Hadal Trenches.Microb Ecol. 2022 Aug;84(2):627-637. doi: 10.1007/s00248-021-01851-3. Epub 2021 Sep 20. Microb Ecol. 2022. PMID: 34545412
-
Resource quality affects carbon cycling in deep-sea sediments.ISME J. 2012 Sep;6(9):1740-8. doi: 10.1038/ismej.2012.14. Epub 2012 Mar 1. ISME J. 2012. PMID: 22378534 Free PMC article.
-
Exploring the impact of flow dynamics on corrosive biofilms under simulated deep-sea high-pressure conditions using bio-electrochemostasis.Front Microbiol. 2025 Feb 28;16:1540664. doi: 10.3389/fmicb.2025.1540664. eCollection 2025. Front Microbiol. 2025. PMID: 40092032 Free PMC article.
-
The deep-sea bacterium Photobacterium profundum SS9 utilizes separate flagellar systems for swimming and swarming under high-pressure conditions.Appl Environ Microbiol. 2008 Oct;74(20):6298-305. doi: 10.1128/AEM.01316-08. Epub 2008 Aug 22. Appl Environ Microbiol. 2008. PMID: 18723648 Free PMC article.
-
Metagenomic Insights Into the Structure and Function of Intestinal Microbiota of the Hadal Amphipods.Front Microbiol. 2021 Jun 7;12:668989. doi: 10.3389/fmicb.2021.668989. eCollection 2021. Front Microbiol. 2021. PMID: 34163447 Free PMC article.
References
-
- Akagi Y, Taga N, Simidu U. Isolation and distribution of oligotrophic marine bacteria. Can J Microbiol. 1977;23:981–987. - PubMed
-
- Barber R T. Dissolved organic carbon from deep waters resists microbial oxidation. Nature. 1968;220:274–275. - PubMed
-
- Bedford R H. Marine bacteria of the northern Pacific Ocean: the temperature range of growth. Contrib Can Biol Fish. 1933;7:431–438.
-
- Blochl E, Rachel R, Burggraf S, Hafenbradl D, Jannasch H W, Stetter K O. Pyrolobus fumarii, gen. and sp. nov., represents a novel group of archaea, extending the upper temperature limit for life to 113°C. Extremophiles. 1997;1:14–21. - PubMed
Publication types
MeSH terms
LinkOut - more resources
Full Text Sources
