. 1999 Dec;65(12):5554-63.
doi: 10.1128/AEM.65.12.5554-5563.1999.

Visualization and enumeration of marine planktonic archaea and bacteria by using polyribonucleotide probes and fluorescent in situ hybridization

Affiliations

Visualization and enumeration of marine planktonic archaea and bacteria by using polyribonucleotide probes and fluorescent in situ hybridization

E F DeLong et al. Appl Environ Microbiol. 1999 Dec.

Abstract

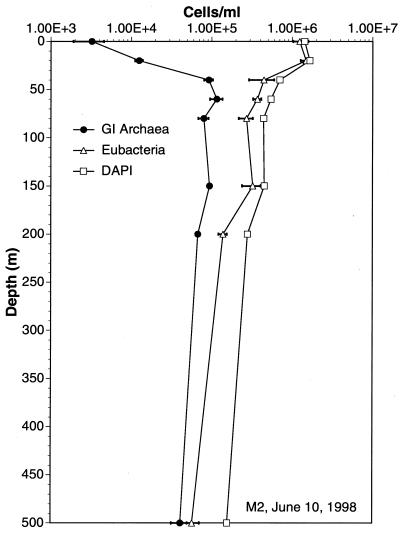
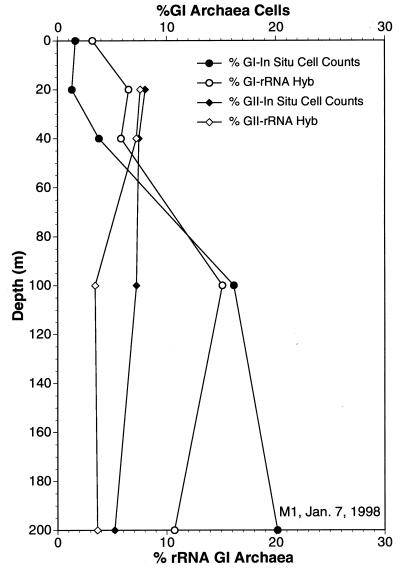
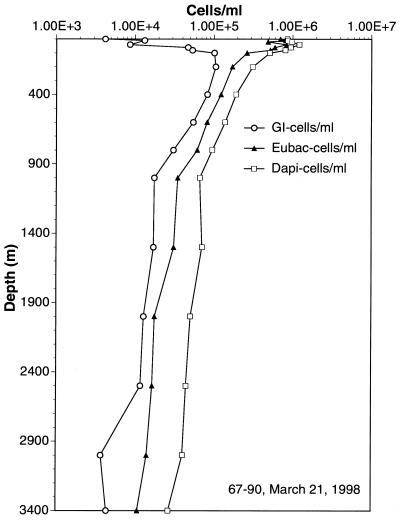
Fluorescent in situ hybridization (FISH) using rRNA-specific oligonucleotide probes has emerged as a popular technique for identifying individual microbial cells. In natural samples, however, the signal derived from fluor-labeled oligonucleotide probes often is undetectable above background fluorescence in many cells. To circumvent this difficulty, we applied fluorochrome-labeled polyribonucleotide probes to identify and enumerate marine planktonic archaea and bacteria. The approach greatly enhanced the sensitivity and applicability of FISH with seawater samples, allowing confident identification and enumeration of planktonic cells to ocean depths of 3,400 m. Quantitative whole-cell hybridization experiments using these probes accounted for 90 to 100% of the total 4',6-diamidino-2-phenylindole (DAPI)-stained cells in most samples. As predicted in a previous study (R. Massana, A. E. Murray, C. M. Preston, and E. F. DeLong, Appl. Environ. Microbiol. 63:50-56, 1997), group I and II marine archaea predominate in different zones in the water column, with maximal cell densities of 10(5)/ml. The high cell densities of archaea, extending from surface waters to abyssal depths, suggest that they represent a large and significant fraction of the total picoplankton biomass in coastal ocean waters. The data also show that the vast majority of planktonic prokaryotes contain significant numbers of ribosomes, rendering them easily detectable with polyribonucleotide probes. These results imply that the majority of planktonic cells visualized by DAPI do not represent lysed cells or "ghosts," as was suggested in a previous report.


Figures

FIG. 1
FIG. 1
Phylogenetic position of the planktonic euryarchaeal 23S rRNA gene contained on clone G2lsu-1A10. The number at each bifurcation represents the percentage of 1,000 bootstrap resamplings that yielded the branching pattern appearing to the right of the value. The scale bar represents the estimated number of fixed mutations per nucleotide position.
FIG. 2
FIG. 2
Surface seawater sample from Monterey Bay hybridized with a fluorescein-labeled 23S group II archaeal probe and a CY-3-labeled 16S group II archaeal probe (Table 2). Images of the same field were captured by using the fluorescein filter set (A), the CY-3 filter set (B), and the DAPI filter set (C). Bars, 5 μm.
FIG. 3
FIG. 3
Similarity plots comparing rRNA sequences of templates used to generate probes to homologous regions in other bacteria or archaea. Each data point represents the unrestricted sequence similarity value along a 100-nucleotide stretch. Nonoverlapping similarity values were calculated in 100-nucleotide sequence segments along the length of the 16S and 23S genes. (A) Group I archaea (C. symbiosum) rRNA compared to homologous regions of other bacteria and archaea. (B) Group II 16S (SB95-72) and 23S (G2lsu-1A10) rRNAs compared to homologous regions of other bacteria and archaea. The respective accession numbers of the small-subunit (SSU) and large-subunit (LSU) rRNA sequences used are as follows: 4B7, U39635 and AF198456; 101G10, AF083071 and AF083071; Escherichia coli, U00006 and U00006; Sulfolobus solfataricus, X03235 and U32322; Archaeoglobus fulgidus, X05567 and M64487; T. acidophilum, M38637 and M32298.
FIG. 4
FIG. 4
Epifluorescence micrographs of picoplankton visualized with polynucleotide probes and FISH on polycarbonate filters. (A and B) Seawater sample, collected from a 200-m depth at a nearshore station in Monterey Bay, hybridized with the CY-3-labeled group I probe and viewed by using the CY-3 (A) or the DAPI (B) filter set. (C and D) Surface seawater sample, from a nearshore station in Monterey Bay, hybridized with the fluorescein-labeled 23S rRNA group II probe and viewed with the fluorescein (C) or the DAPI (D) filter set. (E to G) A 100-m sample, from an offshore station in Monterey Bay, dually hybridized with the fluorescein-labeled 23S group II probe and the CY-3-labeled group I probe. The sample was viewed with the fluorescein (E), DAPI (F), and CY-3 (G) filter sets. (H) Seawater sampled at an 80-m depth at 177 miles offshore of Moss Landing, Calif. The sample was dually hybridized with the fluorescein-labeled bacterial probe and the CY-3-labeled group I probe. Images were captured independently by using the fluorescein or CY-3 filter set, and the separate images were overlaid in Adobe PhotoShop. Scale bars, 5 μm.
FIG. 5
FIG. 5
Group I archaea and bacterial cell concentrations at various depths, determined by polyribonucleotide probe hybridization and FISH and performed in triplicate. Error bars represent standard errors, and where not visible, they are smaller than the symbols. Methods are described in the text.
FIG. 6
FIG. 6
Cell densities of group I and II archaea determined by polyribonucleotide probe hybridization (Hyb) and FISH, compared to the percentage of rRNA from each group in the same sample estimated by quantitative oligonucleotide probe hybridization. Methods are described in the text.
FIG. 7
FIG. 7
Densities of group I archaea and bacterial cells at various depths, determined by polyribonucleotide probe hybridization and FISH. The sampling site was 177 miles offshore of Moss Landing, Calif. Methods are described in the text. Eubac, eubacterial.

References

    1. Alfreider A, Pernthaler J, Amann R, Sattler B, Gloeckner F O, Wille A, Psenner R. Community analysis of the bacterial assemblages in the winter cover and pelagic layers of a high mountain lake by in situ hybridization. Appl Environ Microbiol. 1996;62:2138–2144. - PMC - PubMed
    1. Amann R, Springer N, Ludwig W, Gortz H D, Schleifer K H. Identification in situ and phylogeny of uncultured bacterial endosymbionts. Nature. 1991;351:161–164. - PubMed
    1. Amann R I, Binder B J, Olson R J, Chisholm S W, Devereux R, Stahl D A. Combination of 16S rRNA-targeted oligonucleotide probes with flow cytometry for analyzing mixed microbial populations. Appl Environ Microbiol. 1990;56:1919–1925. - PMC - PubMed
    1. Amann R I, Ludwig W, Schleifer K H. Phylogenetic identification and in situ detection of individual microbial cells without cultivation. Microbiol Rev. 1995;59:143–169. - PMC - PubMed
    1. Amann R I, Zarda B, Stahl D A, Schleifer K H. Identification of individual prokaryotic cells by using enzyme-labeled, rRNA-targeted oligonucleotide probes. Appl Environ Microbiol. 1992;58:3007–3011. - PMC - PubMed

Publication types

MeSH terms

Associated data

LinkOut - more resources