Review
. 1999 Dec;63(4):862-922, table of contents.
doi: 10.1128/MMBR.63.4.862-922.1999.

Adding the third dimension to virus life cycles: three-dimensional reconstruction of icosahedral viruses from cryo-electron micrographs

Affiliations
Review

Adding the third dimension to virus life cycles: three-dimensional reconstruction of icosahedral viruses from cryo-electron micrographs

T S Baker et al. Microbiol Mol Biol Rev. 1999 Dec.

Erratum in

  • Microbiol Mol Biol Rev 2000 Mar;64(1):237

Abstract

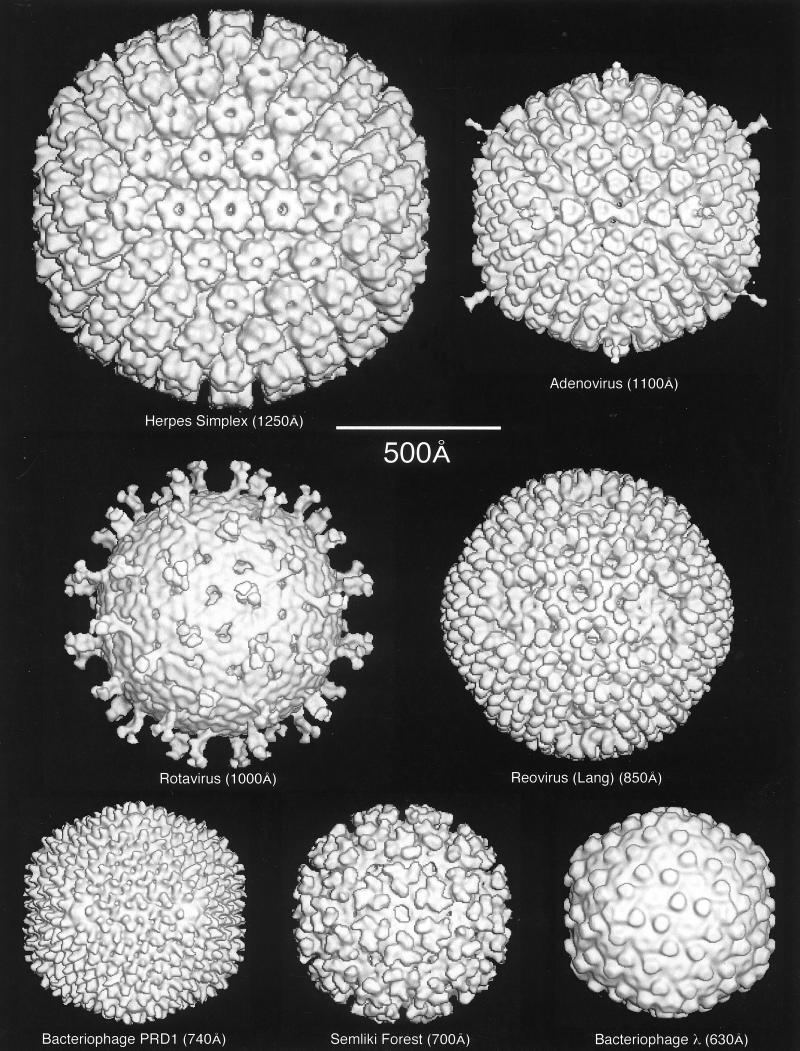
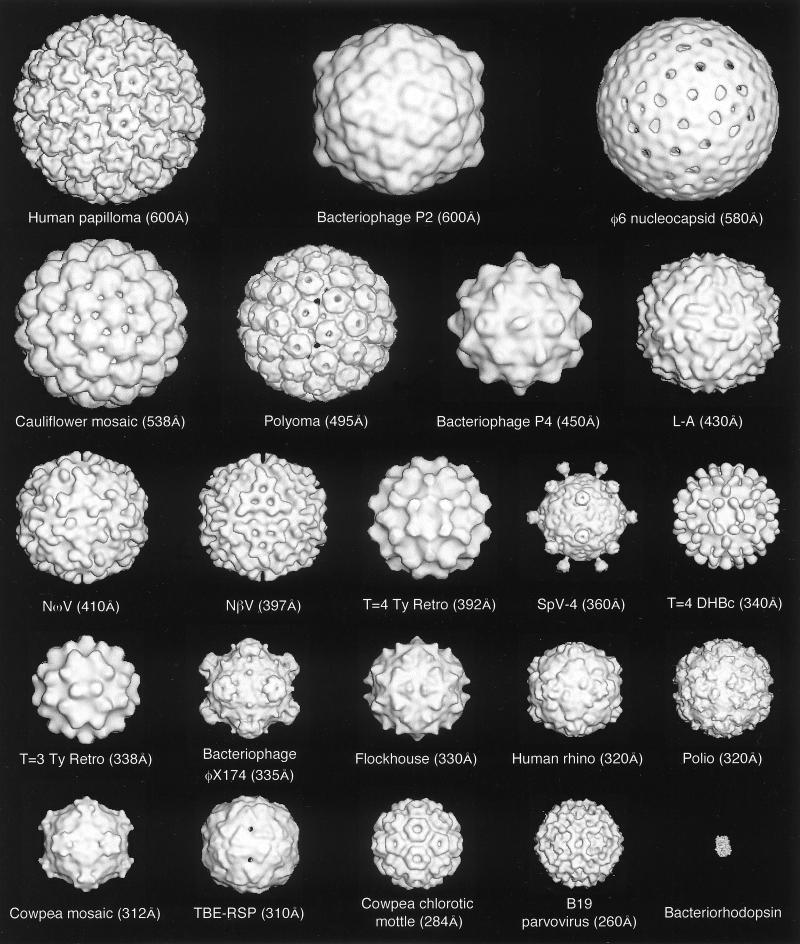
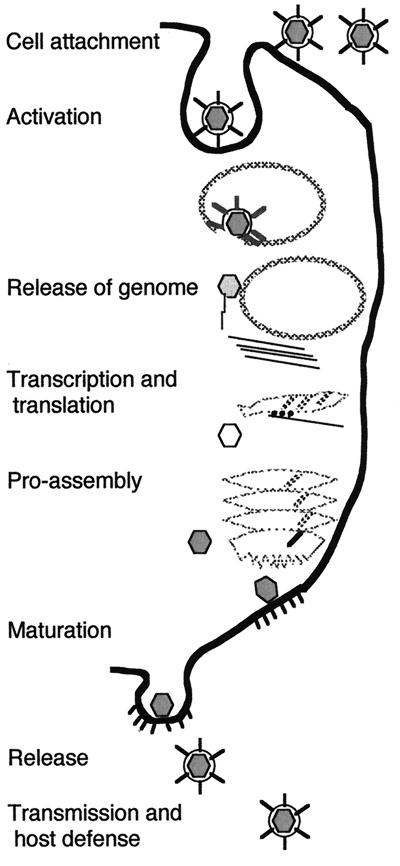
Viruses are cellular parasites. The linkage between viral and host functions makes the study of a viral life cycle an important key to cellular functions. A deeper understanding of many aspects of viral life cycles has emerged from coordinated molecular and structural studies carried out with a wide range of viral pathogens. Structural studies of viruses by means of cryo-electron microscopy and three-dimensional image reconstruction methods have grown explosively in the last decade. Here we review the use of cryo-electron microscopy for the determination of the structures of a number of icosahedral viruses. These studies span more than 20 virus families. Representative examples illustrate the use of moderate- to low-resolution (7- to 35-A) structural analyses to illuminate functional aspects of viral life cycles including host recognition, viral attachment, entry, genome release, viral transcription, translation, proassembly, maturation, release, and transmission, as well as mechanisms of host defense. The success of cryo-electron microscopy in combination with three-dimensional image reconstruction for icosahedral viruses provides a firm foundation for future explorations of more-complex viral pathogens, including the vast number that are nonspherical or nonsymmetrical.


Figures

FIG. 1
FIG. 1
Gallery of representative icosahedral viruses studied by us using cryo-EM and 3D image reconstruction methods. The monomer of bacteriorhodopsin, a 26-kDa membrane protein which contains seven α helices oriented perpendicular to the membrane plane, is shown for comparison at the lower right of the right-hand page (extracellular surface faces upward). All shaded-surface virus structures are viewed along a twofold axis of symmetry. Table 1 presents more-detailed information about these and other 3D reconstructions of icosahedral viruses. TBE, tick-borne encephalitis recombinant subviral particle; Nωv, Nudaurelia capensis ω virus; Nβv, Nudaurelia capensis β virus; Ty Retro, yeast retrotransposon Ty1 VLP; SpV4, Spiroplasma virus type 4; DHBc, duck hepatitis B capsid; B19, human parvovirus B19.
FIG. 1
FIG. 1
Gallery of representative icosahedral viruses studied by us using cryo-EM and 3D image reconstruction methods. The monomer of bacteriorhodopsin, a 26-kDa membrane protein which contains seven α helices oriented perpendicular to the membrane plane, is shown for comparison at the lower right of the right-hand page (extracellular surface faces upward). All shaded-surface virus structures are viewed along a twofold axis of symmetry. Table 1 presents more-detailed information about these and other 3D reconstructions of icosahedral viruses. TBE, tick-borne encephalitis recombinant subviral particle; Nωv, Nudaurelia capensis ω virus; Nβv, Nudaurelia capensis β virus; Ty Retro, yeast retrotransposon Ty1 VLP; SpV4, Spiroplasma virus type 4; DHBc, duck hepatitis B capsid; B19, human parvovirus B19.
FIG. 2
FIG. 2
An icosahedron (left) and dodecahedron (right) with symmetry axes and the asymmetric unit used by microscopists. The numbers (2, 3, and 5) indicate the positions of some of the symmetry axes. The white triangle defines the asymmetric unit which is bounded by the lines joining adjacent fivefold and threefold positions.
FIG. 3
FIG. 3
Geometric principles of constructing icosahedral lattices of defined T (triangulation) number. (A) An array of hexamers, represented as a flat sheet of hexagons, is the basis for generating icosahedra (178). A closed icosahedral shell that conforms to the principles of quasi-equivalent symmetry contains 60T subunits organized as hexamer and pentamer units (53). Hexamers are initially considered planar (hexagons in the flat sheet), and pentamers are considered convex and introduce curvature in the sheet of hexamers when they are inserted in place of specific hexamers. A closed shell is generated by inserting 12 pentamers at appropriate positions in the hexamer net as specified by (h,k) lattice points that mark the centers of the original hexagons in the sheet. The model of a particular quasi-equivalent lattice is constructed as follows. Generate one face of an icosahedron by defining an equilateral triangle in the net. The first side of the triangle is a line connecting the origin point of the net (h,k = 0,0) to any (h,k) point. This process will lead to a lattice of T number given by the relation T=h2 + hk + k2. The remaining two sides of the triangle are formed by connecting the (h,k) point to the appropriate points needed to form an equilateral triangle, as illustrated for the nonenantiomeric T=3 (B) and T=4 (C) lattices and the enantiomeric T=7l,d (D) and T=13l,d (E) lattices. A planar sheet of 20 such triangles is formed, and the sheet is then folded up to form a closed icosahedron as depicted for T=3 and T=4 lattices (B and C). In this way, each of the hexamers at the (h,k) lattice points that define the corners of the triangles are replaced by pentamers and each triangular face contains 3T subunits. (F) Examples of viruses with different T-lattice symmetries. Not all viruses conform to the simple rules of quasi-symmetry as stated above. For example, all T=7 papovaviruses such as polyomavirus have capsids built of 360 subunits arranged as 72 pentameric capsomers (29, 252, 293). A further useful relation is that the number of capsomers is given by 10T+2. Adapted from reference with the permission of the author and the publisher.
FIG. 4
FIG. 4
The environments of subunits in three different triangulation numbers shown by an arrangement of the heads of the members of one of our groups. Only a single environment is required in the T=1 arrangement, while three and four environments are present in T=3 and T=4, respectively. Notice that a larger head (subunit) is necessary to fill the same-sized asymmetric unit for the lower triangulation numbers. The positions of the icosahedral twofold (2), fivefold (5), and threefold (3) and the quasi-sixfold (6) axes are indicated.
FIG. 5
FIG. 5
The steps in a typical preparation of a specimen for cryo-EM are shown. A holey carbon film (A) is prepared by the evaporation of carbon onto a grid bearing a holey plastic film and the removal of the plastic by exposure of the grid to the fumes of ethyl acetate. This film contains holes with diameters between 1 and 5 μm. The specimen is applied to the film at concentrations between 50 μg/ml and 5 mg/ml (B). The grid may then be floated on a drop of water or low-ionic-strength buffer to remove excess salt. The grid is then placed in a pair of forceps which are locked into a guillotine-like device (C) and blotted with filter paper to produce a very thin aqueous film (1,000 to 2,000 Å) across the holes of the grid (D). Immediately after blotting (and before the aqueous film has had time to dry), the plunger is released to allow the forceps to drop into a bath of ethane slush held in a container of liquid nitrogen. The efficient cooling afforded by the ethane slush causes vitrification of the sample. It is then either stored under liquid nitrogen or placed in a liquid-nitrogen-cooled specimen holder for viewing in the microscope.
FIG. 6
FIG. 6
Low-magnification views of vitrified samples of icosahedral viruses, including Nudaurelia capensis β virus (upper left and upper right), SV40 (lower left), and a mixture of polyomavirus and bromegrass mosaic virus (lower right). The grid square with the N. capensis β virus specimen (upper left) is a particularly poor candidate for cryo-EM, but it nicely exhibits a complete spectrum of ice thicknesses, from much too thick at the top (black region) to completely absent at the bottom (holes with no specimen). Only a few holes in the carbon film at the border of the very thick ice have a suitable thickness and distribution of virus particles. The strongly mottled appearance of the N. capensis β virus sample (top right) is caused by ice contamination that quickly builds up on specimens if a blade-type anticontaminator is not used during microscopy. The SV40 sample is a nearly perfect monodispersed distribution of particles in a uniform layer of ice. The bare circular region presumably resulted when surface tension effects in the thinning water layer excluded the ∼500-Å-diameter particles just before vitrification occurred. The mixed polyomavirus and bromegrass mosaic virus sample shows a graded change in specimen thickness, from a thin region near the center of the hole where the small (∼300-Å-diameter) bromegrass mosaic virus particles congregate in a single layer to progressively thicker regions marked by a ring of 500-Å-diameter polyomaviruses surrounded by more polyomaviruses and multiple layers of bromegrass mosaic virus. All magnification bars represent 5,000 Å.
FIG. 7
FIG. 7
Radiation damage in vitrified SV40 samples. Fine structural details are progressively lost in the SV40 particles as the electron dose increases from 10 to 40 e/Å2 (left series). The most prominent damage first appears as bubbling that occurs in the ice over the carbon support film (right series). Bubbling also occurs within particles suspended over the holes of the support film but usually only after doses of about 50 e/Å2 or more (data not shown).
FIG. 8
FIG. 8
The CTF for a Philips CM200 FEG at 200 kV is plotted as a function of resolution in angstroms for an underfocus of 2 μm and an underfocus of 1,000 Å and a magnification of ×36,000. The decrease in the amplitude of the function with increased resolution reflects the measured attenuation due to the lack of coherence in the source, specimen movement, and other optical effects. The value of −0.1 at the origin is the amplitude contrast portion of the function.
FIG. 9
FIG. 9
The effect of defocus is shown for cryo-EM of SFV. The top four images show a defocus series taken on a Philips 400 microscope with a tungsten filament at 80 kV for illumination and underfocus values of 1.5, 3, 6, and 12 μm. Notice that the overall contrast is lower in the closer-to-focus image; however, the very fine details, such as the membrane, are recorded. The further-from-focus images do not show these details but do show better contrast for the large features of the specimen such as the spikes and the outline of the particle. This reflects the fact that there is high attenuation of the transfer function with a tungsten filament and hence only the information in the first peak of the CTF is transmitted efficiently. The bottom two panels show cryo-electron micrographs of the same sample taken on a Philips CM200 FEG under the same defocus conditions for which the CTF is plotted in Fig. 8. Both images show fine details because the illumination from a field emission source is more coherent than the tungsten filament and hence a larger range in resolution is transmitted. Images at different defocus must still be combined because information is lost at the transfer function nodes and attenuated near them. Identical particles in each of the focal series are indicated (arrows).
FIG. 10
FIG. 10
Schematic diagram of the 3D image reconstruction process from digitization of the micrograph to the dissemination of the structural results. Though some steps such as the boxing out of individual particle images lend themselves to automation (e.g., see references and 306), many steps including the determination of particle origins and orientations must be repeated and involve some trial-and-error decision making (e.g., to determine which data should or should not be included). The scheme depicted here, which uses both cross-common lines (133) and model-based (9) approaches to determine and refine particle origin and orientation parameters, is but one of many suitable schemes.
FIG. 11
FIG. 11
Definition of particle view orientation angles. By convention (189), θ, φ, and ω angles define the orientation in which each icosahedral particle is viewed. The standard setting of the icosahedron places three mutually perpendicular twofold axes of the icosahedron coincident with the x, y, and z axes of a Cartesian coordinate system. The direction of the view vector (thick arrow) is given by θ and φ (the view direction 80°,−15° is illustrated in this diagram), where θ is the angle of the vector projected onto the xz plane measured positive from the z axis, and φ is the angle of the vector projected onto the xy plane measured positive from the x axis. The rotational orientation of the icosahedron about the vector is given by the angle ω. Because the symmetry of an icosahedron makes it 60-fold redundant, any view vector can be referenced to a single asymmetric unit (shaded region), which is a spherical triangle bounded by neighboring fivefold axes (θ = 90.0°, φ = ±31.72°) and an adjacent threefold axis (θ = 69.09°, φ = 0.0°).
FIG. 12
FIG. 12
Change in projected structure with change in view orientation. (Upper panel) Images of a 3D reconstruction of BPV (19), projected on a regular grid at 3° intervals of θ and φ (ω always = 0°) within a half of the icosahedral asymmetric unit (represented by dots in the right half of the inset). This gallery demonstrates how small changes in viewing angle can produce dramatic differences in the projected views of a 600-Å-diameter particle. The magnitude of these differences is correlated with the change in view direction and with the size of the particle. Hence, a 3° change in view direction leads to more-pronounced differences in projection images for a larger particle (>600 Å) or less-pronounced differences for smaller particles (<600 Å). (Lower panel [corresponds to boxed region of inset]). Demonstration that projected views at θ,φ and θ,−φ are enantiomers related by a vertical line of mirror symmetry. Note that when φ = 0°, the particle itself is mirror symmetric about a central vertical line (true for all images in leftmost column of upper panel). All equatorial views give rise to mirror-symmetric images. An icosahedron has 15 equators, each of which encircles the icosahedron along a direction that follows adjacent symmetry axes. For example, the equator in the xy plane (θ always = 90°; φ varies between −180° and +180°) crosses, in order, the following symmetry axes: two-, five-, three-, two-, three-, five-, two-, five-, three-, two-, three-, and fivefold. Any view corresponding to a combination of θ and φ which lies on this equator will be a mirror-symmetric image with the mirror line parallel to the equator. For example, the bottom row of projected images in the upper panel (which represent some of the views along the xy equator) all exhibit horizontal lines of mirror symmetry. Projection views along strict symmetry axes are additionally unique because they exhibit n mirror lines, where n (= 2, 3, or 5) is the symmetry of the axis in view.
FIG. 13
FIG. 13
Measures of the resolution of a reconstruction of SFV with 80 particle images. The plot shows both the phase error (left scale) and the FSC (right scale) against the spatial frequency in inverse nanometers. The resolution of the reconstruction is approximately 27 Å as shown by the position at which the FSC crosses 0.5 and the phase error becomes greater than 45°. Notice that the two measures of resolution yield almost identical results.
FIG. 14
FIG. 14
Atomic modeling of a 3D reconstruction of a virus-Fab complex shown in stereo. (Top) Reconstructed map of HRV14 (in white) complexed with Fab fragments from neutralizing MAb 17-IA (pink). (Middle and bottom) Orthogonal views of the atomic model of Fab 17-IA (light chain in grey; heavy chain in dark yellow) and the atomic model of HRV14 (VP1 to VP4 in blue, green, red, and cyan, respectively) fitted into the cryo-EM density envelope (wire mesh). The “hand-in-glove” fit of the atomic models into the cryo-EM envelope demonstrates that, at least in this example, the interacting surfaces can be defined to within a few angstroms (58, 285). See Fig. 55 for comparison.
FIG. 15
FIG. 15
The common tasks faced by all viruses as exemplified by the replication of SFV, an enveloped virus, in a mammalian cell. The virus first binds to a cell surface receptor (Cell attachment). Entry ensues by receptor-mediated endocytosis, and the capsid-bearing genome is released into the cytoplasm via membrane fusion mediated by the low pH of the endosome (Release of genome). The capsid and envelope proteins are synthesized, and the spike is assembled in the secretory pathway as a heterodimer comprising the precursor of E2 (p62) and the fusion sequence-bearing protein E1. The capsid incorporates the genomic RNA in the cytoplasm (Pro-assembly). The envelope protein complex is processed in the late secretory pathway to yield the fusion active complex of E1, E2, and E3 (Maturation). The mature spike assembles into small patches on the plasma membrane which are complementary to the arrangement of capsid proteins, and the budding particle forms and is released from the cell (Release). Propagation of the infection involves evading the host immune system and, in some cases, replication in a second host, such as a mosquito for the arbovirus SFV (Transmission and host defense).
FIG. 16
FIG. 16
Schematic diagram (left) and cryoreconstruction (right in radially depth-cued representation) of HRV14. The outer capsids of the more than 100 serotypes of HRV (family Picornaviridae) all contain 60 copies each of three viral proteins, VP1, VP2, and VP3. Four classes of neutralizing antibodies have been genetically mapped to viral epitopes on these surface proteins (274). NIm-IA and NIm-IB map to VP1, and NIm-II and NIm-III map to VP2 and VP3, respectively. The canyon, a prominent surface depression that completely surrounds each of the 12 fivefold vertices of the HRV capsid, was first recognized in the crystal structure analysis of HRV14 and hypothesized to be an important site of cellular recognition (258).
FIG. 17
FIG. 17
Cryoreconstruction study of native HRV16 (left) and an HRV16-D1D2 complex (right). (Top) Small fields of view showing vitrified samples of native HRV16 and HRV16 complexed with the D1D2 fragment of the cellular receptor ICAM-1. (Bottom) Isosurface representations of the HRV16 and HRV16-D1D2 reconstructions. The two-domain D1D2 structure binds radially to the HRV16 surface at the canyons that surround the star-shaped VP1 pentamers as predicted elsewhere (258).
FIG. 18
FIG. 18
Cryoreconstruction of simian rotavirus (352). The prominent, dimeric VP4 spikes (yellow) project ∼110 Å radially outward from the viral surface in a manner that may facilitate binding to cellular receptors. VP7 (blue), the major outer capsid protein and an antigenic determinant, forms a smooth outer shell with 132 channels, through which the second major capsid protein, VP6 (pink), and the core proteins, VP1 to VP3 (red; individual proteins could not be distinguished in this reconstruction), are accessible. Twelve (type I) channels occur at the fivefold axes, 60 (type II) are partially occluded by the VP4 subunits, and 60 (type III) have the rather prominent crescent-shaped openings. Figure courtesy of M. A. Yeager.
FIG. 19
FIG. 19
A cutaway representation of the 22-Å-resolution reconstruction of SFV (132) revealing the organization of this enveloped virus. The outer surface (blue) of this T=4 virus is studded with 80 trimeric spikes, each comprising three copies of the transmembrane glycoproteins E1 and E2 and the extrinsic membrane protein E3. The spikes are connected above the surface of the membrane by a protein skirt which is penetrated by holes at the two- and fivefold positions. The two leaflets of the lipid bilayer are seen below the skirt. The capsid protein (gold) forms a T=4 array of hexamers and pentamers which surrounds the RNA. The capsid is complementary to the spikes and connected to them by transmembrane regions which are shown in red.
FIG. 20
FIG. 20
An exploded view of the SFV structure (132) around a single spike showing the modular nature of the virion structure. The projecting regions of the spikes are shown in blue. The skirt of protein which connects the spikes is shown in yellow. The cavity at the center of the spike is indicated by an arrow. The outer and inner leaflets of the bilayer and the transmembrane regions which span them are shown in red. The portion of the capsid which interacts with these transmembrane regions is shown in green. Adapted from reference with the permission of the publisher.
FIG. 21
FIG. 21
The conformational change which occurs within the first 50 ms of exposure to low pH is shown for a single SFV spike. Initially, the fusion sequence-bearing E1 protein which forms the edge of the spike alternates with the receptor binding E2 protein which forms the vertices around the cavity in the center. The triggering of the conformational change by low pH leads to the movement of the E2 domains away from the center and the formation of an E1 homotrimer in the center of the spike. The transmembrane regions and the skirt appear undisturbed at this stage of the conformational change. Adapted from reference with the permission of the publisher.
FIG. 22
FIG. 22
Images of SFV contacting a target vesicle in the process of fusion. A defocus pair of images (nominally −1,000 Å and −4 μm) allows the visualization of the leaflets of the target vesicle as well as the nature of the contact on the side of the virion. The contact appears to be formed by several spikes acting in concert which would then cooperate in the forming of a fusion pore.
FIG. 23
FIG. 23
A surface representation of a cryoreconstruction of Ad2 shows the T=25 arrangement of the trimeric hexon protein (inset). Two proteins form the fivefold vertex. Five copies of polypeptide III form the penton base, and three copies of polypeptide IV form the trimeric fiber. The fiber has an ∼45° bend one-third of the way along its length, and hence only the proximal third is seen since the rest lacks full icosahedral symmetry. Reproduced from reference with the permission of the publisher.
FIG. 24
FIG. 24
The change in the adenovirus penton base upon the removal of the fiber is shown by a comparison of cryoreconstructions of the dodecahedral structure formed by expressed Ad3 pentons. The structure of the dodecamer with the fiber attached is shown in blue for comparison with the fiberless structure shown in red. The top row shows a surface view (left) and sections through the surface for the two structures viewed from the side. The center of the virion would be toward the bottom of the page. The bottom row shows a surface view from the outside of the structure (left) and sections through the protrusions at the edge of the base and through the widest portion of the base. Reproduced from reference with the permission of the author and the publisher.
FIG. 25
FIG. 25
The position and proposed structure of the RGD epitope on the surface of Ad2. The position of the epitope was established by Fab labeling. The structure was modeled from the sequence and shown to match the density seen at the appropriate position. Adapted from reference with the permission of the author and the publisher.
FIG. 26
FIG. 26
Schematic diagram (left) and cryoreconstruction (right) of the ssRNA insect virus FHV (family Nodaviridae). The capsid of FHV consists of 180 copies of a single subunit arranged with T=3 icosahedral symmetry. Each icosahedral asymmetric unit consists of three quasi-equivalent subunits, labeled A, B, and C. A and B are related by a quasi-twofold axis (open ellipse). The positions of a peptide arm and a portion of the RNA genome that adopts a highly ordered, double-stranded loop are also indicated in the diagram. The isosurface rendering of the image reconstruction shows prominent peaks on the viral surface at local threefold positions (open triangle in diagram). Positions of four icosahedral symmetry axes (2, 5, and 3) are marked on the reconstruction. Adapted from reference with the permission of the author and the publisher.
FIG. 27
FIG. 27
Positions of γ helices in FHV. (Top) Cutaway view of FHV with density derived from cryo-EM in blue and density derived from a difference map (cryoreconstruction minus X-ray structure of capsid only) in red. The cylinders represent the three types of γ helices, with γA in blue, γB in orange, and γC in green. Asterisks mark the helices shown in the middle panel. (Middle) Close-up view of two pairs of γ helices that are in close association with the bulk RNA (red mesh) and ordered RNA (space-filling model). (Bottom) Side view of region near the icosahedral fivefold axis (vertical white line) showing the bundle of γA helices and A subunits (one in a green-, yellow-, and red-ribbon representation and the others in thin-yellow-line Cα backbone traces) fit into the EM envelope (blue mesh). The ellipsoidal difference density (red contours) is situated on the fivefold axis in a position consistent with unmodeled density from the X-ray map (white contours). Adapted from reference with the permission of the author and the publisher.
FIG. 28
FIG. 28
Hypothetical entry pathway for FHV. (Top) Fivefold view of FHV cryoreconstruction. The pink circle marks the fivefold axis, and the two sets of blue, red, and green dots identify the exposed loops of the A, B, and C capsid subunits, respectively, at two of the five quasi-threefold positions on the viral surface adjacent to the marked fivefold axis. The arrow shows the view direction (perpendicular to fivefold axis) in the middle and bottom panels. (Middle) Initial interaction of six methionine residues (not depicted) at the tips of the loops in the A (blue), B (red), and C (green) capsid subunits with a bilayer membrane (grey balls). The bundle of γA peptides (pink) and the RNA genome are poised just inside the viral surface at the fivefold axis. (Bottom) Capsid subunits rotate toward the membrane, allowing the γA peptides to be inserted into the membrane and form a channel for release of the viral genome into the host cell. Middle and bottom panels courtesy of T. J. Smith.
FIG. 29
FIG. 29
Structures of native and swollen forms of CCMV determined by X-ray crystallography and cryoreconstruction (290). (Top left pair) Stereo view along twofold direction of the native CCMV protein shell rendered as a Cα tracing with the A, B, and C subunits colored blue, red, and green, respectively. The yellow cage depicts the edges of a truncated icosahedron. (Top right) Truncated icosahedral model of CCMV in the same view orientation and color coding as the stereo Cα model. Yellow symbols mark the locations of the strict two-, three-, and fivefold icosahedral symmetry axes, and white symbols mark the positions of quasi-two- and threefold axes. The central triangle of chemically identical A, B, and C subunits defines the asymmetric unit of the icosahedral structure. The subunits are colored differently to reflect the fact that they occupy slightly different geometric (and chemical) environments. Polygons with subscripts are related to A, B, and C by icosahedral symmetry (e.g., C and C2 are related by a strict twofold rotation and A and A5 are related by a strict fivefold rotation). The A, B, and C subunits of the asymmetric unit are related by a quasi- or local threefold axis (white triangle; vertices of yellow cage in stereo view to left). The three orange dots mark the putative calcium binding positions in one asymmetric unit of CCMV (290). (Middle row) CCMV capsid at pH 4.5. At the left is a magnified, stereo view of the native, 3.2-Å-resolution CCMV X-ray Cα model fit into the 23-Å-resolution cryoreconstruction envelope (blue mesh). The yellow, truncated icosahedral cage is the same as that depicted in the top row. Calcium ions (180/capsid) are bound between capsomers by residues associated with the helices (white cylinders) which appear as three pairs positioned around each quasi-threefold axis. An isosurface view of the cryoreconstruction is shown at the right (same size as models in the top row). (Bottom row) Same views as in middle row but for the swollen CCMV capsid at pH 7.5 in the absence of metal ions. The atomic models of the native capsid subunits were translated and rotated as rigid bodies to fit the 28-Å-resolution cryoreconstruction in the stereo view. Adapted from reference with the permission of the author and the publisher.
FIG. 30
FIG. 30
Transcribing rotavirus DLP. (Left) Cryoreconstruction at a 25-Å resolution of the actively transcribing rotavirus DLP, viewed along a threefold axis and rendered with radial depth cueing (color bar gives corresponding radii for various colors). The pink “bowling pins” represent discernible portions of newly transcribed mRNA molecules as they exit the channels along the virus fivefold axes, each of which is bounded by five trimers of VP6 (blue). The two middle images compare close-up views of transcribing (left) and nontranscribing (right; at ∼28-Å resolution) DLPs. The rightmost image, in which one of the five VP6 trimers that surround the type I channel has been removed for clarity, depicts a hypothetical path (grey tube) that the mRNA transcript may take as it passes through the VP2 (green) and VP6 (blue) layers of the inner capsid. Adapted from reference with the permission of the author and the publisher.
FIG. 31
FIG. 31
Model of transcription in L-A virus (55). Approximately two copies of the RNA-dependent RNA polymerase (Pol; shown with an arbitrary shape) are present in each virion. Each Pol, which is covalently attached to one of the 120 Gag subunits that comprise the icosahedral capsid of L-A virus, presumably lies at the inner surface of the capsid close to the dsRNA substrate. In this diagram of the hypothetical transcription pathway, as the genome is processed by Pol, the ssRNA transcripts are extruded through small openings in the capsid. Adapted from reference with the permission of the author and the publisher.
FIG. 32
FIG. 32
The structural transitions in the bacteriophage λ capsid during maturation. The capsid has T=7l icosahedral symmetry and is formed of hexamers of protein gpE. The prohead reconstruction shows the capsid prior to the packaging of DNA and the accompanying expansion. Notice that the gpE hexamers are skewed in this form of the capsid. Genome packaging in the wt virion leads to a much smoother surface in which the individual hexamers have expanded. Expansion is also accompanied by the addition of protein gpD, which helps to stabilize the capsid structure. gpD is bound at the local threefold positions of the T=7 lattice as shown by the comparison of the wt reconstruction with that of a mutant (D) which lacks gpD. Adapted from reference with the permission of the author and the publisher.
FIG. 33
FIG. 33
Procapsid maturation in bacteriophage HK97 (81). Shown are isosurface views along the twofold direction of cryoreconstructions of the T=7 HK97 precursor (left) and mature (right) capsids. HK97 capsid proteins (42 kDa) aggregate into pentamers and hexamers and form a prohead, but without scaffold proteins as often occurs in other viruses. A viral protease is incorporated into the prohead upon completion of assembly, and when activated, it cleaves the 11-kDa amino-terminal domain from the inner surface of the capsid protein. This reaction triggers transformation of the prohead into the expanded, mature capsid, in which adjacent subunits become covalently cross-linked. The hexamers undergo a dramatic change from their asymmetric, sheared state to a more symmetrical structure in the mature capsid. Adapted from reference with the permission of the author and the publisher.
FIG. 34
FIG. 34
Procapsid maturation in HSV-1 (311, 312). Shown are isosurface views along a twofold direction of cryoreconstructions of the T=16 HSV-1 precursor procapsid at 28-Å resolution (left), mature capsid at 25-Å resolution (right), close-up views of each capsid along a fivefold axis (insets). The color images are overlaid on the unprocessed cryo-EM images of the corresponding vitrified specimens. Comparison of the two structures reveals the substantial changes that occur in the hexons (hexameric capsomers), which are distorted and nonsymmetric in the procapsid but become symmetric in the mature capsid. HSV-1 capsids contain three major proteins: VP5 (150 kDa; 960 copies), VP19c (50 kDa; ∼320 copies), and VP23 (34 kDa; ∼640 copies). The 320 “triplexes” (arrows in insets), which occupy local threefold axes of symmetry, consist of two copies each of VP23 and one copy of VP19c. The horns of density at the tips of the hexons, but not pentons, in the mature capsids are monomers of VP26 (12 kDa), an additional viral protein that is dispensable for capsid assembly but which binds to the capsid if present. Adapted from reference with the permission of the author and the publisher.
FIG. 35
FIG. 35
The position of the scaffolding protein in the procapsid of the bacteriophage P22 scaffolding mutant is shown in outer surface and cut-open views of the reconstruction. (A) Outer surface of the structure; the density attributed to the internal scaffolding protein is colored white whereas that of the coat protein is colored yellow. One copy of each of the seven quasi-equivalent coat proteins is highlighted in a different color. (B) Cut-open view shows the distribution of the scaffolding protein (white) which extends to a radius of 206 Å within the outer layer (yellow). Adapted from reference with the permission of the author and the publisher.
FIG. 36
FIG. 36
The role of the capsid-size-determining protein in the bacteriophage P2-P4 system is shown by a series of surface views of reconstructions. Bacteriophage P2 forms a T=7 particle of 600 Å in diameter (A) which packages its 33-kb genome efficiently. Bacteriophage P4 uses the proteins of P2 to form a 450-Å T=4 shell (B) which can package its smaller 11-kb genome but excludes the larger P2 one. The change in capsid size is controlled by the P4 gpSid protein. Reconstruction of a recombinant particle which resembles the 390-Å P4 procapsid (C) and the procapsid bearing a full complement of gpSid (D) shows that the size determination protein forms a 400-Å dodecahedral shell on the outside of the procapsid. Expansion after packaging brings the mature P4 to its final 450-Å diameter. Adapted from references and with the permission of the author and the publishers.
FIG. 37
FIG. 37
The structure of the membrane-containing bacteriophage PRD1 is shown by three surface representations of PRD1 particles. The wt phage and a mutant phage which does not package the genomic DNA show that the T=25-like exterior is not changed by the packaging. The structures within the interior membrane of the virus increase in order after packaging. The structure of the P3 protein shell shows the organization of the major capsid protein and the removal of the fivefold vertex structures. The similarity to adenovirus (Fig. 23) is striking; both are T=25-like arrangements in which trimeric proteins fill hexavalent sites and have a separate protein complex that forms the vertex at the fivefold position and which also includes a trimeric protein. Adapted from reference with the permission of the publisher.
FIG. 38
FIG. 38
Comparison of the structure of the wt mature SFV with that of the SFVmSQL mutant shows the effect of cleavage of the spike protein precursor (p62) on the spike structure. The spike coalesces from an open structure with separated E1E2 heterodimers to a closed structure containing a cavity at its center. The modular nature of the structure is reflected in the observation that the capsid, transmembrane regions, and spike skirts are unchanged by the cleavage. Adapted from reference with the permission of the author and the publisher.
FIG. 39
FIG. 39
Schematic diagrams of the compositions and structures of orthoreovirus virions, ISVPs, and cores. The structures of virions and ISVPs appear very similar for all serotypes studied, but the λ2 spike of the serotype 1 Lang (T1L) core adopts a more open conformation than the cores of other serotypes, such as T3D (reovirus serotype 3, Dearing). The virion has a triple-layered structure, depicted as three concentric circles at the lower left. Outer and inner capsids, each comprised of multiple copies of four different proteins, encapsidate a central core that contains the segmented dsRNA genome. Adapted from reference with the permission of the author and the publisher.
FIG. 40
FIG. 40
Cryo-EM of orthoreovirus T1L virions, ISVPs, and cores. Magnified views of three representative particles of each type are shown below. Bars represent 1,000 Å (low-magnification views) and 500 Å (higher-magnification views).
FIG. 41
FIG. 41
Isosurface views in the twofold orientation of the cryoreconstructions of the orthoreovirus T1L virion, ISVP, and core. These reconstructions were computed from images like those depicted in Fig. 40. The T1L virion is characterized by 600 finger-like projections (ς3 protein) and 12 depressions with flower-shaped features (λ2 protein) at the fivefold vertices and a knob of density (ascribed to the ς1 protein) on the fivefold axis. The T1L ISVP has similar flower-like features centered on the icosahedral vertex positions and 200 trimeric structures (μ1 protein) distributed over the capsid surface. The ς1 protein adopts a more extended conformation in the ISVP, though this is not apparent at the high contour level at which the isosurfaces are rendered (see Fig. 4 of reference 108). The λ2 spikes (open, turret-like structures) are the most prominent feature of the T1L core. The composition of the knob-like features on the surface of the core is still undetermined (possibly a combination of λ1 and ς2 proteins), but the components of the viral RNA polymerase (λ3 and μ2 proteins) have been located inside the core shell and hence are not visible in this view (107).
FIG. 42
FIG. 42
Organization and structure of rotavirus. A schematic diagram (left) and 3D reconstruction (right) illustrate the multilayered rotavirus structure and the disposition of its major components. The dsRNA genome and viral RNA polymerase (VP1 and VP3) are encapsidated by a core shell composed of VP2. This core is surrounded by two concentric shells of protein which include 260 trimeric-shaped columns of density (VP6) on the inside and 260 trimers of VP7 on the outside. VP7 forms a relatively smooth outer surface with 132 channels through which VP6 and VP2 are accessible (shown more clearly in Fig. 18). Sixty dimeric spikes (VP4), which contain the receptor recognition domain, project ∼110 Å radially outward from the viral surface and ∼90 Å beneath the surface and are in close contact with both VP7 and VP6 (352). Adapted from references and with the permission of the authors and the publishers.
FIG. 43
FIG. 43
Cryo-electron micrograph of a rotavirus sample containing both double-layered and triple-layered particles. The larger TLPs have a characteristic smooth circular profile whereas the smaller DLPs have a bristly outer profile. Magnified views of two TLPs (left) and two DLPs (right) are shown in the insets at the bottom.
FIG. 44
FIG. 44
Organization of rotavirus DLPs as visualized in radial-depth-cued surface representations, viewed along a threefold direction. (Top) DLP cryoreconstruction at a nominal resolution of 19 Å, depicted to show an exterior view of the entire particle (left), the internal organization in a cutaway view (middle), and the dodecahedral shell of ordered RNA (right), which represents ∼25% of the total genome. The disposition of VP6 (blue) and VP2 (green) layers and the VP1-plus-VP3 RNA polymerase complex (red) and the ordered RNA (greyish green and yellow in the middle and yellow on the right) are denoted by arrows. (Bottom three rows) Radial cutaway views compare the internal features of the DLP (left column) and recombinant baculovirus-expressed VLPs composed of VP2 and VP6 (VLP-2/6 [middle column]) and of VP1, VP2, VP3, and VP6 (VLP-1/2/3/6 [right column]). The radial cutaways from cryoreconstructions computed to 23-Å resolution include only densities from radii of 160 out to 260 Å (top row), 235 Å (middle row), and 225 Å (bottom row). Features between radii 260 and 350 Å are invariant in these structures. RNA density (yellow) appears in the DLP at a radius of ∼230 Å where corresponding regions of the VLPs are empty. The VP2 protrudes inward at the fivefold vertices from the main core shell to a radius of ∼220 Å. A flower-shaped density, attributed to VP1 and VP3, attaches to the tips of VP2 at the fivefold axes in VLP-1/2/3/6, and similar density occurs in the DLP. Adapted from reference with the permission of the author and the publisher.
FIG. 45
FIG. 45
Comparison of the structures of BTV and BRDV reveals the common features of orbivirus structures. The views of the outer surface along the twofold axis show that these two viruses have a similar organization but quite different elaborations of the structure. The structure of the triskelion on the threefold axis (VP2 in BTV and VP4 in BRDV) shows this clearly. The core structure of BRDV is shown in a surface view masked at 250 Å to show the VP2 layer. The crystal structure of the BTV core (144) shows that this layer is composed of 60 pairs of nonequivalent copies of the major core structural protein which is described as a “T=2” structure. The T=13l arrangement of the VP7 trimers is shown in a surface representation of the structure masked at a radius of 290 Å. Adapted from reference with the permission of the author and the publisher.
FIG. 46
FIG. 46
The arrangement of proteins in BTV is shown in a series of schematic diagrams. (A) Placement of the individual structural proteins in the multilayered virion. (B) Arrangement of the proteins in the core in which the T=13 VP7 layer sits atop the “T=2” VP2 shell which surrounds the 10 segments of dsRNA. (C) The outer surface of VP2 sits atop the VP5 layer which mediates its interaction with the VP7 layers. Adapted from reference with the permission of the authors and the publisher.
FIG. 47
FIG. 47
Comparison of aquareovirus (top) to orthoreovirus T1L ISVP (bottom). Shown are isosurface views of aquareovirus (in color and in perspective) and T1L ISVP (black and white) in threefold (left) and fivefold (right) view orientations. The threefold view of aquareovirus shows the incomplete T=13l surface lattice (white overlay) and the axes of icosahedral symmetry labeled. The distribution and orientations of the 200 trimeric morphological units are essentially identical in the two particles. The flower-like structures on the fivefold vertices are distinct (e.g., in aquareovirus there is an axial channel). Differences in the relative sizes of features in the two structures are mainly attributed to aquareovirus being viewed in perspective whereas T1L ISVP is not. Aquareovirus images are adapted from reference with the permission of the author and the publisher.
FIG. 48
FIG. 48
Reconstructions of two fungal viruses, L-A (left) and P4 (right), as viewed along an axis of twofold symmetry. The two viruses exhibit very similar features with 120 morphological units packed on a T=1 lattice (63). The capsids consist of 12 pentons, each of which has 10 elongated and curved subunits arranged in two sets of five. An inner ring of five subunits is encircled by an outer ring of five subunits that are offset like fish scales from the inner ring. Despite occupying nonequivalent packing environments, the inner and outer ring subunits are similar in appearance. The known capsid stoichiometry indicates that each subunit is a monomer of the Gag protein (55, 63). The images are rendered at an isosurface threshold too low to reveal the small channels that penetrate the capsid wall and are presumed to be exit portals through which nascent mRNA transcripts can pass (see Fig. 31).
FIG. 49
FIG. 49
Stages of the bacteriophage φ6 life cycle. The virus enters the bacterium by attaching to a pilus (A) and crossing the outer membrane (B), digesting the proteoglycan layer with a viral lysozyme, and then crossing the inner membrane (C) to deposit the nucleocapsid in the cytoplasm (D). Plus RNA strands are synthesized and lead to the production of proteins P1, P2, P4, and P7 (E), which assemble to form the prohead (F). The prohead packages a single copy of each of the three plus strands, which leads to expansion and minus-strand synthesis (G). Later events in the transcription cycle lead to the production of protein P8, which attaches to the expanded prohead to form the nucleocapsid (H). This is followed by envelopment (I) and lysis (J).
FIG. 50
FIG. 50
The internal structures of bacteriophage φ6 are shown in surface views of the exterior and cut-open reconstructions of the polymerase complex (proteins P1, P2, P4, and P7) in its unexpanded (A) and expanded (B) forms as well as the nucleocapsid (C). The expansion of the polymerase complex allows the attachment of protein P8 (white in panel C) to form the T=13 shell of the nucleocapsid. The major structural protein of the polymerase complex (P1) forms a T=2-like shell similar to that of BTV. The remaining proteins contribute to the turret structure which extends from the vertex of the polymerase complex and projects through the holes of the T=13 shell of the nucleocapsid. Recent work (97) shows that this structure does not have the fivefold symmetry imposed by the icosahedral reconstruction and hence is blurred in the average shown. Adapted from reference with the permission of the publisher.
FIG. 51
FIG. 51
Cryoreconstructions of the T=4 HepBc computed to 7.4-Å (42) and 9-Å (80) resolution (left and right, respectively). Both reconstructions revealed details of the tertiary structure of the capsid protein. In particular, dimer clustering of two core protein subunits produces the prominent surface spikes, which consist of four long α helices arranged in a radial bundle. A series of subsequent labeling studies have further defined details of the HepBc structure at similar resolutions (41, 78, 79, 364). Adapted from references and with the permission of the authors and the publisher.
FIG. 52
FIG. 52
The positions of the proteins of adenovirus are shown by difference imaging with an atomic model based on the high-resolution structure of the adenovirus hexon protein (blue in panels A and B). An external view of the virion along the twofold axis (A) shows the position of the trimers of polypeptide IX which link the group of nine hexons in a single facet and polypeptide IIIa which links adjacent facets. The penton base I is represented in yellow with the fiber being shown in green. The view from the interior of the virion shows polypeptide IIIa, which passes through the layer of hexons, and of polypeptide VI hexamers near the penton base. These positions are shown schematically in panel C, where the triangular top and hexagonal base of hexon and the pentagonal penton base are shown in white. The polypeptide IX trimers are shown as black triangles. The polypeptide VI hexamers are shown as black circles, and the hexon layer spanning polypeptide IIIa is shown as filled black bars. The fit between the hexon density seen in the high-resolution structure and that in the reconstruction is shown for the region surrounding the penton base in panel D. Adapted from reference with the permission of the publisher.
FIG. 53
FIG. 53
Cryo-electron micrograph of a densely packed monolayer of bacteriophage T7 heads recorded at 2.5-μm defocus (56). The particles exhibit characteristic fingerprint patterns with 25-Å spacings associated with closely packed strands of dsDNA. The pattern motifs vary according to the viewing direction, with concentric rings revealed in axial views and punctate arrays revealed in side views. In the particular double mutant sample shown here, the T7 heads adopt a preferred axial orientation. Modeling analysis of these and other images established that the T7 chromosome is spooled around an axis in approximately six coaxial shells in quasi-crystalline packing (56). Adapted from reference with the permission of the author and the publisher.
FIG. 54
FIG. 54
Ordered duplex RNA in FHV as viewed from the side toward the C-C intersubunit contact (see Fig. 26). (Top) Thin (∼20-Å) cross-sectional view of FHV cryo reconstruction (blue mesh) superimposed on the FHV X-ray Cα backbone model (yellow), the contoured difference density map (red mesh; cryo-EM density map minus X-ray capsid structure only), and the locally ordered RNA (space-filling representation). The vertical white line is a twofold axis. The other lines mark the locations of two adjacent fivefold axes. (Bottom) Same view as above with ribbon representations of two complete B (red) and C (green) capsid subunits in close association with the dsRNA (space-filling model) and the peptide arm. Adapted from reference with the permission of the author and the publisher.
FIG. 55
FIG. 55
Complexes between HRV14 and NIm-IA neutralizing MAbs (58). (Top) Isosurface representations, all viewed along a twofold axis of symmetry, of cryoreconstructions of HRV14 complexed with a neutralizing MAb (MAb 17-IA in red) and with Fab fragments from strongly neutralizing MAbs 17-IA (blue) and 12-IA (purple) and weakly neutralizing MAb 1-IA (green). (Bottom) Pseudoatomic fitting of different Fab models into the cryo-EM density envelopes of the HRV-Fab complexes (wire mesh) illustrates in side views the close interactions that each Fab makes with the HRV structure. Fab 17 and Fab 12 bind in essentially identical, tangential orientations to the viral surface, which favors bidentate binding over icosahedral twofold axes. Fab 1 binds in a more radial orientation that makes bidentate binding unlikely. All three Fabs contact a significant portion of the viral canyon and directly overlap much of the ICAM-1 receptor binding site.

Similar articles

Cited by

References

    1. Adrian M, Dubochet J, Lepault J, McDowall A W. Cryo-electron microscopy of viruses. Nature (London) 1984;308:32–36. - PubMed
    1. Agarwal M, Arthur M, Arbeit R D, Goldstein R. Regulation of icosahedral virion capsid size by the in vitro activity of a cloned gene product. Proc Natl Acad Sci USA. 1990;87:2428–2432. - PMC - PubMed
    1. Aldroubi U, Trus B L, Unser M, Booy F P, Steven A C. Magnification mismatches between micrographs: corrective procedures and implications for structural analysis. Ultramicroscopy. 1992;46:175–188. - PubMed
    1. Anderer F A, Schlumberger H D, Koch M A, Frank H, Eggers H J. Structure of simian virus 40. II. Symmetry and components of the virus particle. Virology. 1967;32:511–523. - PubMed
    1. Anthony R P, Brown D T. Protein-protein interactions in an alphavirus membrane. J Virol. 1991;65:1187–1194. - PMC - PubMed

Publication types

MeSH terms

LinkOut - more resources