Review
. 1999 Dec;63(4):923-67, table of contents.
doi: 10.1128/MMBR.63.4.923-967.1999.

Stress genes and proteins in the archaea

Affiliations
Review

Stress genes and proteins in the archaea

A J Macario et al. Microbiol Mol Biol Rev. 1999 Dec.

Abstract

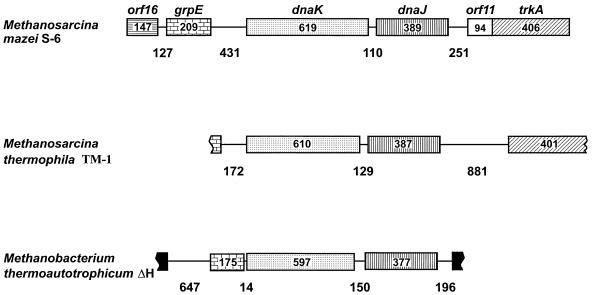
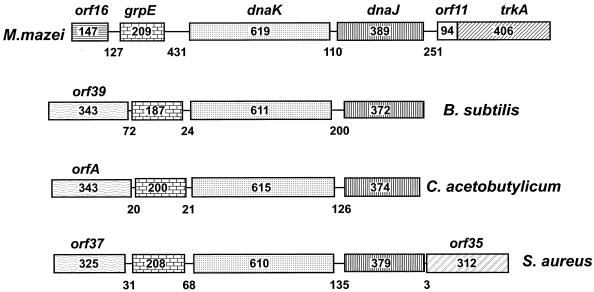
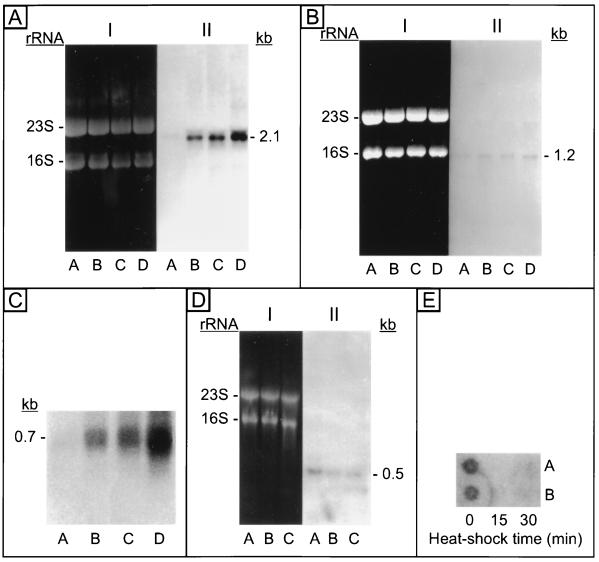
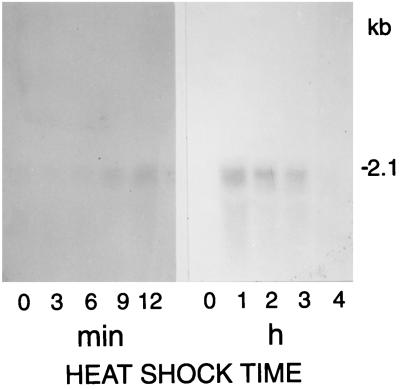
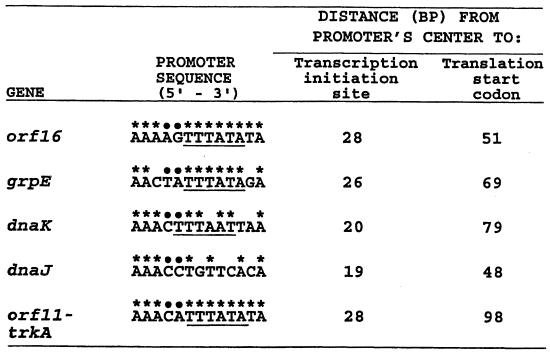
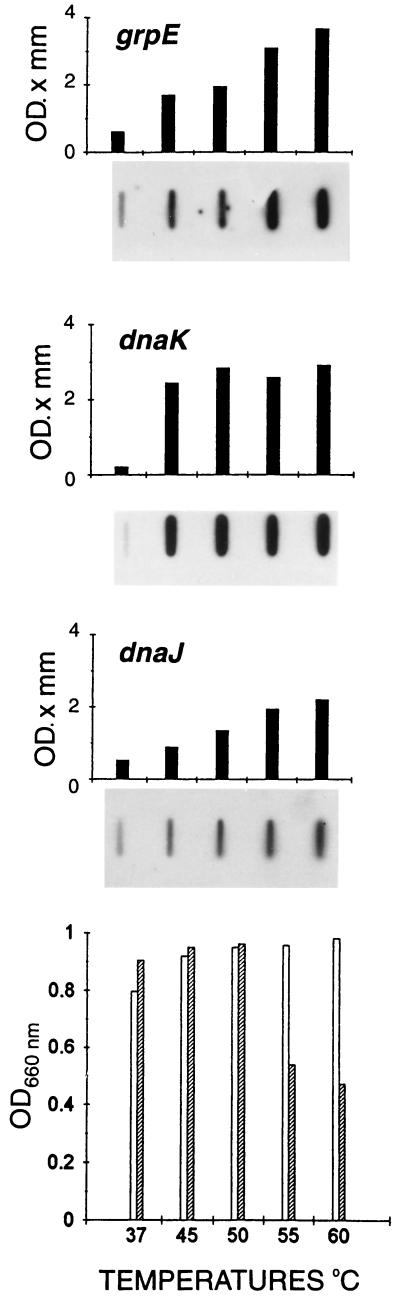
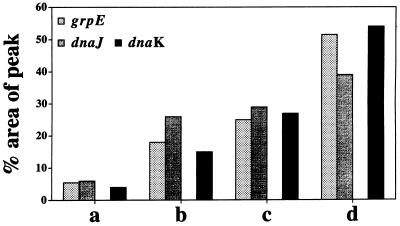
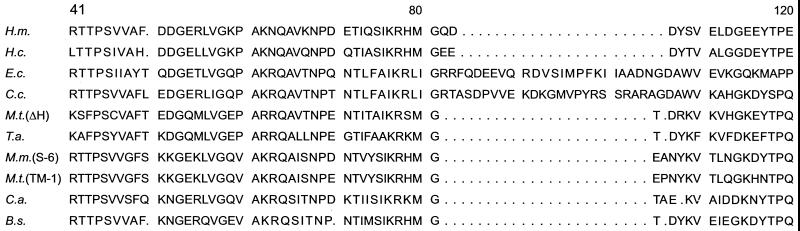
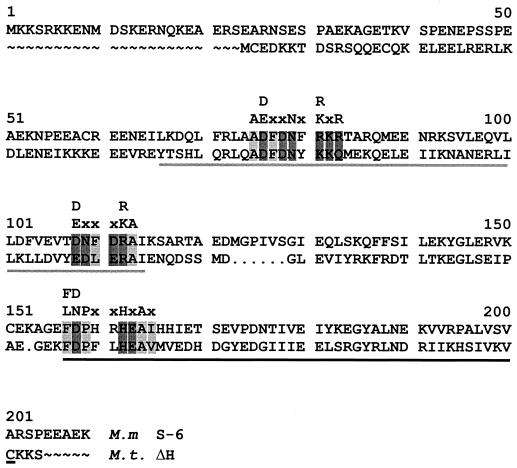
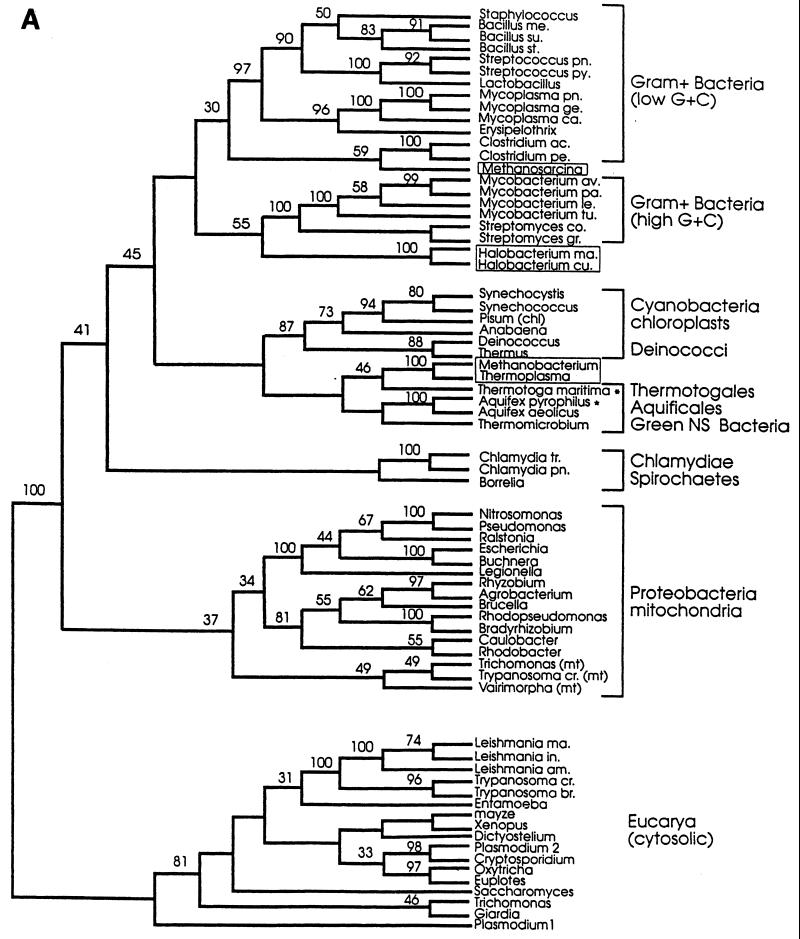
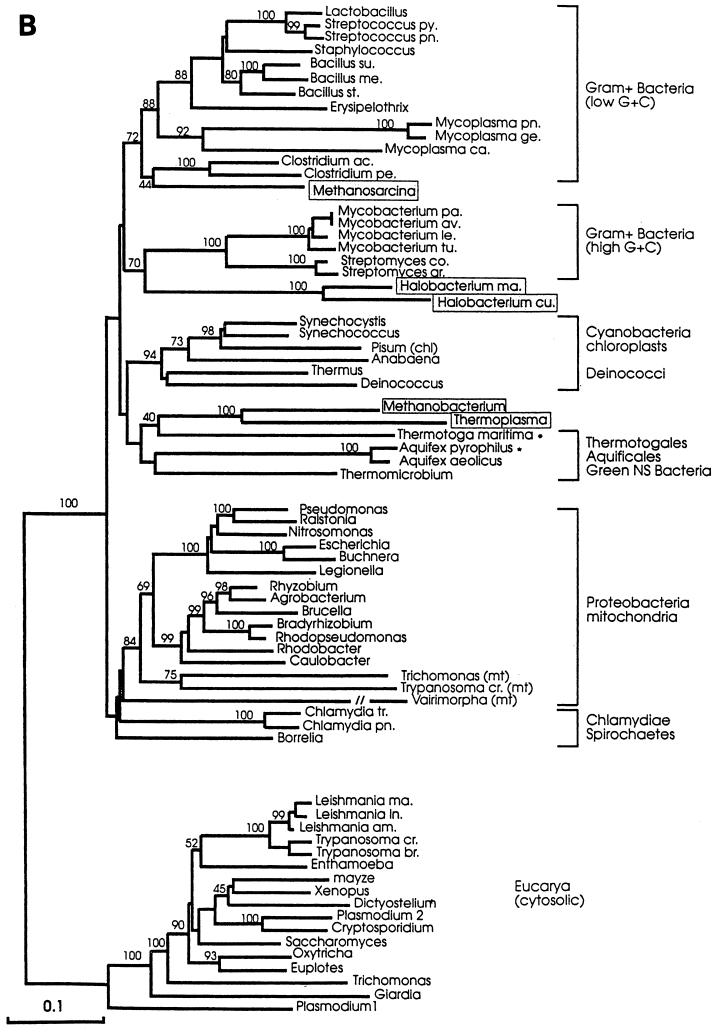
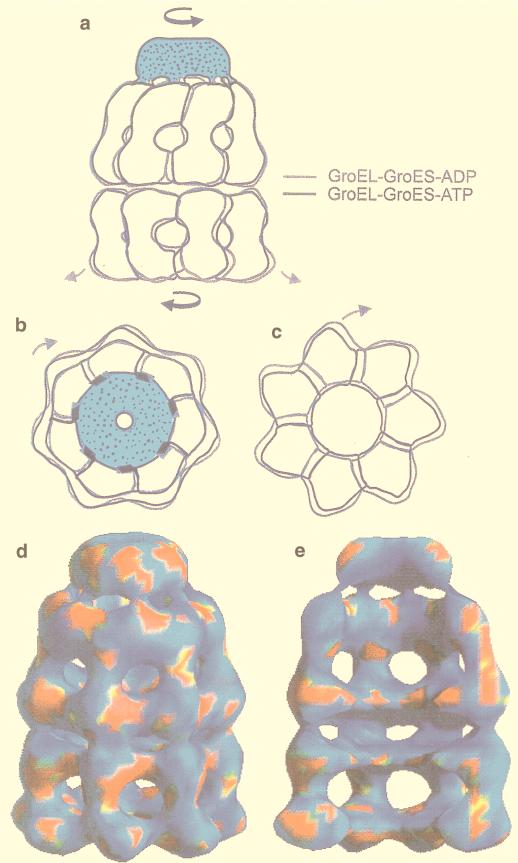
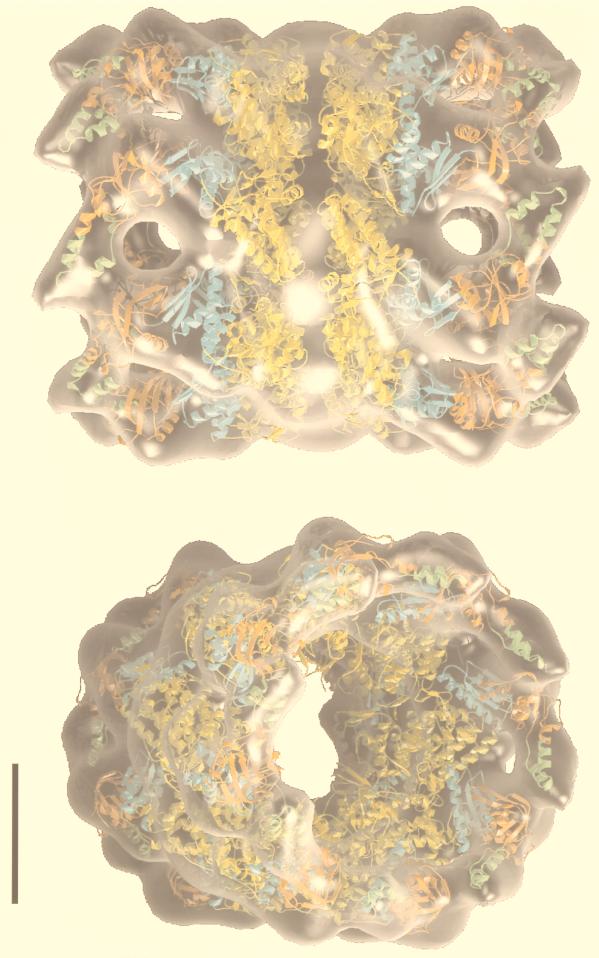
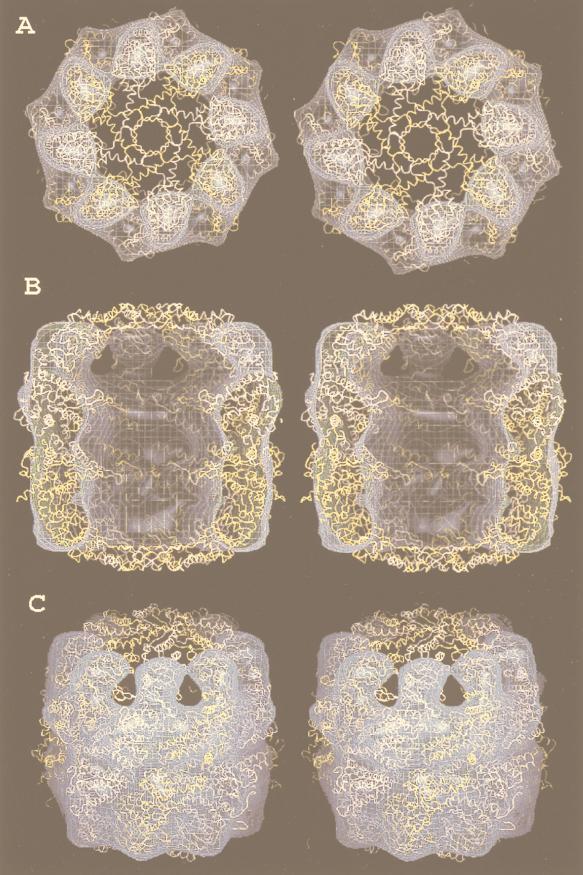
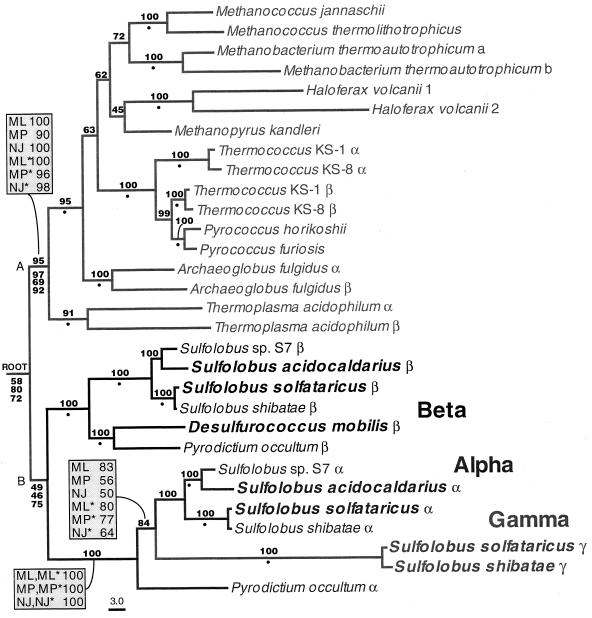
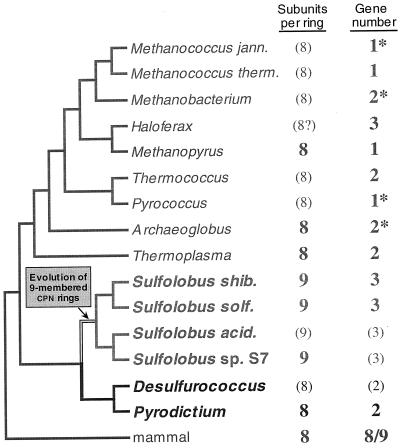
The field covered in this review is new; the first sequence of a gene encoding the molecular chaperone Hsp70 and the first description of a chaperonin in the archaea were reported in 1991. These findings boosted research in other areas beyond the archaea that were directly relevant to bacteria and eukaryotes, for example, stress gene regulation, the structure-function relationship of the chaperonin complex, protein-based molecular phylogeny of organisms and eukaryotic-cell organelles, molecular biology and biochemistry of life in extreme environments, and stress tolerance at the cellular and molecular levels. In the last 8 years, archaeal stress genes and proteins belonging to the families Hsp70, Hsp60 (chaperonins), Hsp40(DnaJ), and small heat-shock proteins (sHsp) have been studied. The hsp70(dnaK), hsp40(dnaJ), and grpE genes (the chaperone machine) have been sequenced in seven, four, and two species, respectively, but their expression has been examined in detail only in the mesophilic methanogen Methanosarcina mazei S-6. The proteins possess markers typical of bacterial homologs but none of the signatures distinctive of eukaryotes. In contrast, gene expression and transcription initiation signals and factors are of the eucaryal type, which suggests a hybrid archaeal-bacterial complexion for the Hsp70 system. Another remarkable feature is that several archaeal species in different phylogenetic branches do not have the gene hsp70(dnaK), an evolutionary puzzle that raises the important question of what replaces the product of this gene, Hsp70(DnaK), in protein biogenesis and refolding and for stress resistance. Although archaea are prokaryotes like bacteria, their Hsp60 (chaperonin) family is of type (group) II, similar to that of the eukaryotic cytosol; however, unlike the latter, which has several different members, the archaeal chaperonin system usually includes only two (in some species one and in others possibly three) related subunits of approximately 60 kDa. These form, in various combinations depending on the species, a large structure or chaperonin complex sometimes called the thermosome. This multimolecular assembly is similar to the bacterial chaperonin complex GroEL/S, but it is made of only the large, double-ring oligomers each with eight (or nine) subunits instead of seven as in the bacterial complex. Like Hsp70(DnaK), the archaeal chaperonin subunits are remarkable for their evolution, but for a different reason. Ubiquitous among archaea, the chaperonins show a pattern of recurrent gene duplication-hetero-oligomeric chaperonin complexes appear to have evolved several times independently. The stress response and stress tolerance in the archaea involve chaperones, chaperonins, other heat shock (stress) proteins including sHsp, thermoprotectants, the proteasome, as yet incompletely understood thermoresistant features of many molecules, and formation of multicellular structures. The latter structures include single- and mixed-species (bacterial-archaeal) types. Many questions remain unanswered, and the field offers extraordinary opportunities owing to the diversity, genetic makeup, and phylogenetic position of archaea and the variety of ecosystems they inhabit. Specific aspects that deserve investigation are elucidation of the mechanism of action of the chaperonin complex at different temperatures, identification of the partners and substitutes for the Hsp70 chaperone machine, analysis of protein folding and refolding in hyperthermophiles, and determination of the molecular mechanisms involved in stress gene regulation in archaeal species that thrive under widely different conditions (temperature, pH, osmolarity, and barometric pressure). These studies are now possible with uni- and multicellular archaeal models and are relevant to various areas of basic and applied research, including exploration and conquest of ecosystems inhospitable to humans and many mammals and plants.


Figures

FIG. 1
FIG. 1
The hsp70(dnaK) locus genes of the archaea for which sequences are available, including genes up- and downstream of hsp70(dnaK). The genes are represented by rectangular boxes from the 5′ to the 3′ end (left to right), with their names above their respective boxes in the locus on top [dnaK and dnaJ are used instead of hsp70(dnaK) and hsp40(dnaJ) for clarity]. The numbers within the boxes indicate the number of amino acids encoded. The lines joining the boxes represent the intergenic regions, with their lengths, in base pairs, shown underneath. The sequences of M. thermophila TM-1 grpE and trkA are still incomplete (what is available would encode 53 and 401 amino acids, respectively). Accession numbers and other details are provided in Tables 2, 5, and 10. Reprinted from references and with permission of the publishers.
FIG. 2
FIG. 2
The hsp70(dnaK) locus genes of the archaeon M. mazei S-6 and three gram-positive bacteria: B. subtilis (M84964), C. acetobutylicum (M74569), and S. aureus (D30690). Symbols are the same as those described in the legend to Fig. 1. Modified from reference with permission of the publisher.
FIG. 3
FIG. 3
(A to D) Northern blots with M. mazei S-6 total RNA (10 μg/lane) showing an increase in the levels of transcripts of hsp70(dnaK) (A), hsp40(dnaJ) (B), and grpE (C), and a decrease in the level of the transcript of orf16 (D) in response to heat shock. (E) Dot blot showing a decrease in the level of the transcript of orf11-trkA in response to heat shock. Hybridizations were done in all cases with radiolabelled probes specific for the respective genes. In panels A, B, and D, I is the gel stained with ethidium bromide showing the RNAs, 23S and 16S while II is the corresponding Northern blot. Lanes: A, total RNA from M. mazei S-6 cells maintained at the optimal growth temperature of 37°C, i.e., non-heat-shocked cells; B and C or B to D, total RNA from cells heat shocked at 45°C for increasing time periods, from 15 to 60 min. The sizes of the transcripts in panels A to D are indicated in kilobases. Transcripts were detected for all the genes in non-heat-shocked cells. Heat shock caused an increase in the levels of the transcripts of hsp70, hsp40, and grpE. The reverse occurred for orf16, and orf11-trkA. The latter two genes overlap and are cotranscribed, whereas the other genes are transcribed monocystronically. Reprinted from references , , , and , with permission of the publishers.
FIG. 4
FIG. 4
Response of the M. mazei S-6 hsp70(dnaK) gene to heat shocks of various durations. Northern blots of total RNA (10 μg/lane) extracted from M. mazei S-6 cells before heat shock (lane 0 in both panels) or after a heat shock at 45°C for the times indicated in the horizontal axis, in minutes (min) or hours (h). Hybridization was done with a probe for dnaK. The size of the hybridization bands in kilobases is indicated to the right. Reprinted from reference with permission of the publisher.
FIG. 5
FIG. 5
M. mazei S-6 promoters for the hsp70(dnaK) locus genes. Bases with asterisks are identical to those in the consensus sequence for promoters in methanogens, and bases with dots denote positions without base preference (25); underlined bases represent the archaeal box A (reference and references therein). The consensus sequence was derived from comparative analysis of promoters for many non-heat-shock genes (25). There is no information on promoters for archaeal grpE, hsp70(dnaK), or hsp40(dnaJ), except that shown here and in Tables 2, 5, and 10. Therefore, no consensus sequence is available for these archaeal heat shock genes. Note that while the promoters for the non-heat-shock genes orf16 and orf11-trkA match the consensus 100%, the grpE, hsp70(dnaK), and hsp40(dnaJ) promoters do not match it to the same extent. Reprinted from reference with permission of the publisher.
FIG. 6
FIG. 6
Response of the M mazei S-6 genes grpE, hsp70(dnaK), and hsp40(dnaJ) to heat shock at various temperatures demonstrated by slot-blotting with M. mazei S-6 RNA. The levels of mRNA for grpE, hsp70(dnaK), and hsp40(dnaJ) (top three panels) are represented by vertical bars expressed in the optical density (OD) × millimeter units given by the densitometer. The respective slot blots (10 μg of total RNA from S-6 cells per slot) are shown at the foot of the bars, while the heat shock temperatures are indicated in the horizontal axis at the bottom of the figure (°C). Hybridization was done with the respective labelled probes. The culture density is shown in the bottom panel. The OD660 was determined at time zero (open bars) and at 30 min (hatched bars) in cultures maintained at 37°C or heat shocked during this 30-min period at the temperatures indicated at the foot of the bars. Reprinted from reference with permission of the publisher.
FIG. 7
FIG. 7
Response of the M. mazei S-6 genes grpE, hsp40(dnaJ), and hsp70(dnaK) to the stressors cadmium (Cd2+) and heat. The bars represent levels of mRNA determined by slot blotting with probes for the grpE, hsp40(dnaJ), and hsp70(dnaK) genes. The total RNAs were from cells grown at 37°C (i.e., the optimal temperature for growth of M. mazei S-6) in medium without Cd2+ (a) and in medium with 5 or 27 mM CdCl2 (b and c, respectively) and from cells grown in medium without Cd2+ but heat shocked at 45°C for 30 min (d). Note that the levels of the mRNAs from the three genes increased after heat shock by comparison with the levels before heat shock (constitutive or basal levels; compare a and d). Likewise, the presence of Cd2+ in the medium also induced an increase in the levels of the three mRNAs. This effect was more marked with 27 mM than with 5 mM CdCl2 (compare a with b and c; and compare b with c). Reprinted from reference with permission of the publisher.
FIG. 8
FIG. 8
Amino acid sequences (single-letter symbols) of six archaeal Hsp70(DnaK) proteins and of four bacterial homologs, two from gram-negative bacteria (E. coli and C. crescentus) and two from gram-positive bacteria (C. acetobutylicum and B. subtilis) between positions 41 and 120, aligned with the program PileUp (Genetics Computer Group, University of Wisconsin, Madison, Wis.). The absence of 23 residues in the proteins from the archaea and gram-positive bacteria compared with those from gram-negative bacteria is shown by dots. Organisms and accession numbers are as follows: H.m., Haloarcula (Halobacterium) marismortui (Q01100); H.c., Halobacterium cutirubrum (P42372); E.c., Escherichia coli (P04475); C.c., Caulobacter crescentus (P20442); M.t. (ΔH), Methanobacterium thermoautotrophicum ΔH (O27351); T.a., Thermoplasma acidophilum (P50023); M.m., Methanosarcina mazei S-6 (P27094); M.t. (TM-1), Methanosarcina thermophila TM-1 (Y17862); C.a., Clostridium acetobutylicum (P30721); B.s., Bacillus subtilis (P13343). Modified from references and with permission of the publishers.
FIG. 9
FIG. 9
Amino acid sequences (single-letter symbols) of the archaeal GrpE proteins from M. mazei S-6 (M.m. S-6; P42367) and M. thermoautotrophicum ΔH (M.t. ΔH; O27350) aligned with the program PileUp. Regions I and II (294), in that order from the N terminus, are underlined. Motifs 1, 2, and 3 (45), also from the N to the C terminus, are shaded, with their respective consensus sequences on top (light and dark shades show hydrophobic and hydrophilic residues, respectively). The M. thermoautotrophicum ΔH molecule is shorter than the M. mazei S-6 protein, with amino acids missing at the beginning and the end (tildes) and inside (dots).
FIG. 10
FIG. 10
Maximum-parsimony (A) and evolutionary-distance (B) phylogenetic trees based on Hsp70(DnaK) sequences. Both trees show essentially the same clustering of the archaeal molecules with those from gram-positive bacteria and a group formed by the Aquifexales, Thermotogales, and green nonsulfur bacteria. Numbers represent bootstrap confidence levels calculated from 100 bootstraps (only those that were 30% or higher are shown). Asterisks indicate the newly described genes-proteins (see reference 99). Abbreviations: ac, acetobutylicum; am, amazonensis; av, avium; br, brucei; ca, capricolum; chl, chloroplasts; co, coelicolor; cr, cruzis; cu, cutirubrum; ge, genitalium; gr, griseus; in, infantum; le, leprae; ma, marismortui or major (Leishmania); me, megaterium; mt, mitochondria; NS, nonsulfur; pa, paratuberculosis; pe, perfringens; pn, pneumonia; py, pyogenes; st, stearothermophilus; su, subtilis; tr, trachomatis; and tu, tuberculosis. Reprinted from reference with permission of the American Society for Microbiology.
FIG. 10
FIG. 10
Maximum-parsimony (A) and evolutionary-distance (B) phylogenetic trees based on Hsp70(DnaK) sequences. Both trees show essentially the same clustering of the archaeal molecules with those from gram-positive bacteria and a group formed by the Aquifexales, Thermotogales, and green nonsulfur bacteria. Numbers represent bootstrap confidence levels calculated from 100 bootstraps (only those that were 30% or higher are shown). Asterisks indicate the newly described genes-proteins (see reference 99). Abbreviations: ac, acetobutylicum; am, amazonensis; av, avium; br, brucei; ca, capricolum; chl, chloroplasts; co, coelicolor; cr, cruzis; cu, cutirubrum; ge, genitalium; gr, griseus; in, infantum; le, leprae; ma, marismortui or major (Leishmania); me, megaterium; mt, mitochondria; NS, nonsulfur; pa, paratuberculosis; pe, perfringens; pn, pneumonia; py, pyogenes; st, stearothermophilus; su, subtilis; tr, trachomatis; and tu, tuberculosis. Reprinted from reference with permission of the American Society for Microbiology.
FIG. 11
FIG. 11
The bacterial chaperonin complex GroEL/S, and its allosteric changes upon interaction with nucleotide phosphate, which is a major player in chaperonin action. The barrel shape of the complex is apparent, with one base flat and the other convex due to GroES (dotted shading in panels a and b). Also apparent are the two stacked GroEL rings that form the barrel, the subunits of the rings, the domains of the subunits, and the windows between the intermediate domains. GroES looks like a lid, occluding one of the bases of the barrel. The figure also shows the morphologic changes that the complex undergoes when it passes from the ADP to the ATP-bound stages. The structural differences between GroEL-GroES complexes in ATP and ADP were determined by cryoelectron microscopy and computer-assisted image reconstruction. The upper part of the figure (a to c) illustrates domain movements between GroEL/S-ADP and GroEL/S-ATP complexes (gray and black outlines, respectively). The complexes are viewed from the side (a; GroES is dotted-shaded), from above (b; cis apical and equatorial domains surrounding the dotted-shaded GroES), and from below (c; transapical domains). The comparison showed small twists of the subunit domains, particularly in the apical domains of the lower ring. The lower part of the figure represents the GroEL/S-ATP complex as a whole viewed from the side (d) and the same complex cut open to expose the inner cavity (e). The complex is color coded to display the significance map of the differences between the ADP- and ATP-bound stages; i.e., the different colors show significance differences from t tests between the two structures. Regions with significant change (P ≪ 0.0005) are red, and regions with no significant change are blue. The comparison demonstrated that there were domain movements throughout the complex. The main regions of differences (red) observed in GroEL were the ends of the apical and equatorial domains and the hinge regions. There was a localized region of significance at the interring contact 2 (between the equatorial massess, on the outside surface of the structure). The pinwheel pattern of variation in GroES suggested that its subunits were being twisted by the change in the orientation of the apical domain of GroEL. Reprinted from reference with permission of the publisher.
FIG. 12
FIG. 12
An example of archaeal chaperonin complex. The cylindrical, barrel-like shape is apparent in the top panel, but in contrast to the bacterial GroEL/S complex (Fig. 11), both bases are flat (there is no GroES homolog here). The figure is a semitransparent surface representation of the electron-tomographic 3-D reconstruction of the α-only thermosome showing the complex in an open conformation with a composite atomic model fitted into it. The atomic model was derived from the crystal structures of the intermediate (blue) and equatorial (yellow) domains of the cis-ring of GroEL/S and the apical domain (orange and light green) of the thermosomal α subunit. The complex is viewed from the side (top) and at 60° with respect to the x-y plane (bottom). The black scale bar (bottom left) corresponds to 5 nm. Reprinted from reference with permission of the publisher.
FIG. 13
FIG. 13
The archaeal and eukaryotic chaperonin complexes resemble each other; both look like a barrel with flat bases. The structure of the archaeal complex (thermosome) from Thermoplasma acidophilum as determined by X-ray crystallography (yellow ribbon) is shown superposed on the 3-D reconstruction of CCT bound to ATP generated by cryoelectron microscopy and computer-assisted image processing (blue). The stereoview pairs (which produce single three-dimensional images when viewed with appropriate glasses) are as follows: (A) a base, or end, of the chaperonin complex seen along the longitudinal axis; i.e., the barrel-like chaperonin complex may be imagined to be standing upright on one of its bases and viewed from above to see the inner cylindrical cavity; (B) the complex split open in half; i.e., the barrel has been cut through the sagittal plane, and the half-cut structure is seen from a line of view perpendicular to the longitudinal axis of the barrel, into the inner cavity; and (C) the whole barrel seen from the side as if it were standing on one of its bases, slightly tilted against the longitudinal axis toward the observer to expose the other base. Note that the fitting is between an asymmetric (CCT-ATP) and a symmetric (thermosome) complex. The fitting in the CCT-ATP complex is excellent for the ATP ring but not as good in the apo-ring. The slight mismatch of the apo-rings is consistent with the fact that the apical domains in the apo-ring of CCT do not point toward the cavity but contact each other around the circumference of the ring whereas the apical domains of the thermosome protrude toward the central cavity. Reprinted from reference with permission of the publisher.
FIG. 14
FIG. 14
Phylogeny of archaeal chaperonins as illustrated by a maximum-likelihood tree constructed with the chaperonin amino acid sequences. The two major branches, euryarchaeota (top half; light lines) and crenarchaeota (bottom half; dark lines), are shown. Percent support values are given above each node. Inset boxes indicate support for nodes of particular interest—values were derived from various tree reconstruction methods: maximum-likelihood (ML), maximum-parsimony (MP), and neighboring-joining distance (NJ). The influence of site-by-site rate variation on the support for these nodes was also tested; support values from analyses in which fastest-evolving sites were removed are labeled with an asterisk. The position of the eukaryote outgroup root (ROOT) was determined from additional phylogenetic analyses. Support values for nodes A, B, and ROOT are given in the order ML, MP, and NJ from top to bottom. The names of the species from which new chaperonin genes (not listed in Table 15) were cloned and sequenced are shown in boldface. The scale bar indicates 3.0 substitutions per 100 amino acid sites. The data suggest that among euryarchaeota, linage-specific gene duplications occurred in M. thermoautotrophicum, H. volcanii, A. fulgidus, T. acidophilum, and the Pyrococcus/Thermococcus clade, and that among crenarchaeota, the α and β genes arose from a duplication pre-dating the separation of Sulfolobus and Pyrodictium but the α and γ paralogs of Sulfolobus resulted from a duplication subsequent to that separation. Reprinted from reference (in which sources of sequences, methods, and other details are given) with permission of the publisher.
FIG. 15
FIG. 15
A proposal for the evolution of chaperonin gene number and chaperonin complex symmetry. The cladogram on the left displays the archaeal relationships based on the phylogenetic analysis of the chaperonin amino acid sequences shown in Fig. 14. The number of known or predicted subunits per chaperonin ring and of known or predicted chaperonin genes in each archaeal species are listed in the two columns on the right. Subunits per ring: boldface values indicate known subunit stoichiometry from electron microscopic studies (see also Table 14); values within parentheses are predicted. Gene number: boldface values indicate known gene numbers from sequence data; asterisks indicate total gene numbers confirmed by complete genome sequence; values within parentheses are predicted. The data show that the eight-membered chaperonin ring is widespread among euryarchaeota (see also Table 14), as is the case in eukaryotes (295), but that the situation may be different in Sulfolobus. It would appear from gene sequence data that a transition from eight- to nine-membered chaperonin (CPN) rings (inset) occurred in an ancestor of the extant Sulfolobus during crenarchaeal evolution. This suggestion awaits confirmation from experiments that would demonstrate the existence of a third, distinct protein that is functional in vivo along with the other two subunits. Reprinted from reference (in which source of sequences, methods, and other details are given) with permission of the publisher.
FIG. 16
FIG. 16
Archaeal multicellular structures. M. mazei S-6 packets (A) and lamina (B) are displayed, along with the single-cell morphotype (C) for comparison (197). The diameter of the single cells is ∼3 μm, and the magnification factor is the same for the three panels. The photographs were taken with phase-contrast optics of wet samples from live cultures between the glass slide and coverslip (180a).
FIG. 17
FIG. 17
Archaea-bacterial multicellular structures shown in thin histological sections. (A) Cross section of a granule (multicellular consortium) from a thermophilic (50°C), anaerobic, methanogenic bioreactor. Visible are the cortex and medulla (48, 134) and a large island of methanosarcina cells and packets (arrows) (180a). Hematoxylin-eosin stain. Magnification, ×736. (B) Another section of the same granule in which the presence of Methanosarcina thermophila TM-1 (optimal temperature for growth, 50°C) is demonstrated with a antibody probe for TM-1 by immunofluorescence (180a). Magnification, ×3,680.
FIG. 18
FIG. 18
Heat resistance of archaeal multicellular structures compared with the single-cell phenotype. Primer extension mapping of the transcription initiation site for M. mazei S-6 grpE was performed. A radiolabelled oligonucleotide primer complementary to bases 57 through 77 within the grpE coding region was used with 10 μg of total RNA from single cells (lanes 1 to 3) or packets (lanes 4 to 6) per test. Single cells and packets were grown at 37°C (lanes 1 and 4) or heat shocked at 45°C for 30 (lanes 2 and 5) or 60 (lanes 3 and 6) min. The primer-extended products were electrophoresed in a 6% acrylamide sequencing gel in parallel with the products of a sequencing reaction that was done with the same primer and the dideoxy chain termination method (lanes G, A, T, and C). These lanes show the complementary (antisense) strand sequence. The coding (sense) strand sequence and the initiation site (asterisk) are shown on the left. Reprinted from reference with permission of the American Society for Microbiology.
FIG. 19
FIG. 19
Superficial, histological thin section of a granule like that shown in Fig. 17, passing through the cortex. Visible are circular openings which represent cross sections of the tubes that crisscross the cortex and enable communication between different zones of the granule (180a, 185). Hematoxylin-eosin stain. Magnification, ×800.
FIG. 20
FIG. 20
Space-filling model of the multimeric complex formed by an sHsp from the hyperthermophilic methanogenic archaeaon M. jannaschii. The model was derived from crystallographic analysis at 2.9-Å resolution, and each atom is represented by a small sphere. The whole structure consists of 24 identical protein (the sHsp) subunits (16.5 kDa each) arranged in regular octahedral symmetry with a total molecular mass of about 400 kDa. Twelve dimers are represented by different colors, with monomers in each dimer shown by different shading of the same color. The complex is a hollow sphere with eight triangular and six square openings or windows that connect the inner cavity with the outside. The view in the figure is along the axis that aligns two triangular windows, one in front, closest to the observer, and the other on the back of the sphere, farthest from the observer. Reprinted from reference with permission of the publisher.

Similar articles

Cited by

References

    1. Andersson S G, Zomorodipour A, Andersson J O, Sicheritz-Pontén T, Alsmark U C M, Podowski R M, Näslund A K, Eriksson A-S, Winkler H H, Kurland C G. The genome sequence of Rickettsia prowazekii and the origin of mitochondria. Nature. 1998;396:133–140. - PubMed
    1. Andrä S, Frey G, Jaenicke R, Stetter K O. The thermosome from Methanopyrus kandleri possesses an NH4+-dependent ATPase activity. Eur J Biochem. 1998;255:93–99. - PubMed
    1. Andrä S, Frey G, Nitsch M, Baumeister W, Stetter K O. Purification and structural characterization of the thermosome from the hyperthermophilic archaeum Methanopyrus kandleri. FEBS Lett. 1996;379:127–131. - PubMed
    1. Aravind L, Tatusov R L, Wolf Y I, Walker D R, Koonin E V. Evidence for massive gene exchange between archaeal and bacterial hyperthermophiles. Trends Genet. 1998;14:442–444. - PubMed
    1. Archibald J M, Logsdon Jr J M, Doolittle W F. Recurrent paralogy in the evolution of archaeal chaperonins. Curr Biol. 1999;9:1053–1056. - PubMed

Publication types

MeSH terms