. 1999 Dec 6;190(11):1583-94.
doi: 10.1084/jem.190.11.1583.

1alpha,25-dihydroxyvitamin D(3)-induced myeloid cell differentiation is regulated by a vitamin D receptor-phosphatidylinositol 3-kinase signaling complex

Affiliations

1alpha,25-dihydroxyvitamin D(3)-induced myeloid cell differentiation is regulated by a vitamin D receptor-phosphatidylinositol 3-kinase signaling complex

Z Hmama et al. J Exp Med. .

Abstract

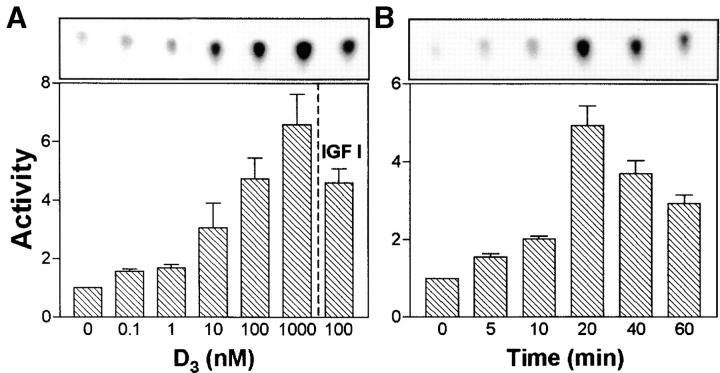
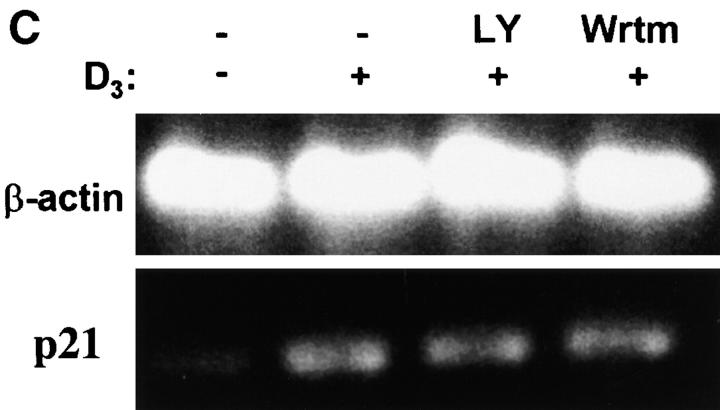
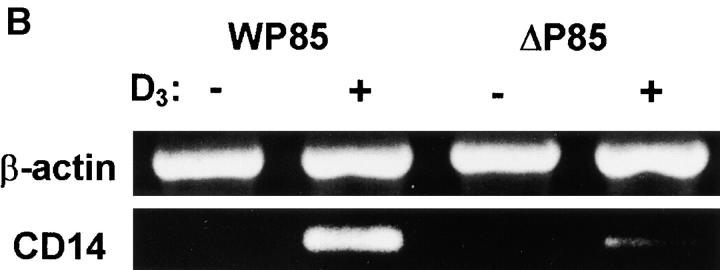
1alpha,25-dihydroxyvitamin D(3) (D(3)) promotes the maturation of myeloid cells and surface expressions of CD14 and CD11b, markers of cell differentiation in response to D(3). To examine how these responses are regulated, THP-1 cells were grown in serum-free medium and incubated with D(3). This was associated with rapid and transient increases in phosphatidylinositol 3-kinase (PI 3-kinase) activity. Furthermore, induction of CD14 expression in response to D(3) was abrogated by (a) the PI 3-kinase inhibitors LY294002 and wortmannin; (b) antisense oligonucleotides to mRNA for the p110 catalytic subunit of PI 3-kinase; and (c) a dominant negative mutant of PI 3-kinase. In THP-1 cells, induction of CD11b expression by D(3) was also abrogated by LY294002 and wortmannin. Similarly, LY294002 and wortmannin inhibited D(3)-induced expression of both CD14 and CD11b in peripheral blood monocytes. In contrast to CD14 and CD11b, hormone-induced expression of the Cdk inhibitor p21 in THP-1 cells was unaffected by either wortmannin or LY294002. These findings suggest that PI 3-kinase selectively regulates D(3)-induced monocyte differentiation, independent of any effects on p21.


Figures

Figure 1
Figure 1
Induction of CD14 expression in response to D3. (A) THP-1 cells were incubated in RPMI 1640 containing 10% FCS for 24 h with the indicated concentrations of D3. (B) Cells were incubated in the same medium with 100 nM D3 for the indicated times. (C) Serum-starved cells were incubated for 24 h either in serum-free medium, or in medium supplemented with either 10% FCS, IGF-I (100 ng/ml), D3 (100 nM), 10% FCS + D3, or IGF-I + D3. At the end of incubation, cells were washed with staining buffer and labeled for 30 min at 4°C with either 3C10 (anti-CD14) mAb or irrelevant IgG2b. Cells were washed and stained with FITC-conjugated F(ab)′2 sheep anti–mouse IgG. Samples were washed and fixed in 2% paraformaldehyde before flow cytometric analysis. Results in (A) and (B) are expressed as histograms of fluorescence intensity. Histograms displaced to the right represent cells stained with 3C10, and histograms on the left represent cells stained with irrelevant IgG2b. Data presented correspond to one of two independent experiments yielding similar results. In C, results are means ± SEM (n = 3 independent experiments) of MFI indices which correspond to the following ratio: MFI of cells incubated with specific Ab/MFI of cells stained with irrelevant Ab.
Figure 1
Figure 1
Induction of CD14 expression in response to D3. (A) THP-1 cells were incubated in RPMI 1640 containing 10% FCS for 24 h with the indicated concentrations of D3. (B) Cells were incubated in the same medium with 100 nM D3 for the indicated times. (C) Serum-starved cells were incubated for 24 h either in serum-free medium, or in medium supplemented with either 10% FCS, IGF-I (100 ng/ml), D3 (100 nM), 10% FCS + D3, or IGF-I + D3. At the end of incubation, cells were washed with staining buffer and labeled for 30 min at 4°C with either 3C10 (anti-CD14) mAb or irrelevant IgG2b. Cells were washed and stained with FITC-conjugated F(ab)′2 sheep anti–mouse IgG. Samples were washed and fixed in 2% paraformaldehyde before flow cytometric analysis. Results in (A) and (B) are expressed as histograms of fluorescence intensity. Histograms displaced to the right represent cells stained with 3C10, and histograms on the left represent cells stained with irrelevant IgG2b. Data presented correspond to one of two independent experiments yielding similar results. In C, results are means ± SEM (n = 3 independent experiments) of MFI indices which correspond to the following ratio: MFI of cells incubated with specific Ab/MFI of cells stained with irrelevant Ab.
Figure 2
Figure 2
D3 induces PI 3-kinase activation in THP-1 cells. Serum-starved (6 h) cells were stimulated with D3, followed by detergent lysis and immunoprecipitation with anti–PI 3-kinase Ab. PI 3-kinase activity was assayed as described in Materials and Methods. Spots corresponding to phosphatidylinositol 3-phosphate (PIP) were cut and subjected to scintillation counting. In A, cells were stimulated with a range of concentrations of D3 (0–1,000 nM) or with IGF-I (100 ng/ml) for 20 min. In B, cells were stimulated with 100 nM D3 for 0–60 min. The upper rectangles in both panels show PIP spots obtained in one representative experiment. The graphical data shown are the means ± SEM of values obtained in three separate experiments. Activities are expressed as fold increase relative to control (untreated) cells.
Figure 3
Figure 3
Wortmannin and LY294002 attenuate D3-induced CD14 expression, but not expression of Cdk inhibitor p21. Serum-starved THP-1 (4 × 10⁶) cells were incubated for 20 min at 37°C and 5% CO2 in medium alone, with wortmannin (Wrtm), or with LY294002 (LY). D3 (100 nM) was then added for 24 h at 37°C. (A) Aliquots of cells (∼0.5 × 10⁶) from each treatment were washed with staining buffer and labeled with anti-CD14 mAb or irrelevant mAb, followed by FITC-conjugated secondary Abs. Flow cytometric analyses were performed, and MFI indices were determined as described in the legend to Fig. 1. The results shown are the means ± SEM of values obtained in three separate experiments. (B and C) Total RNA was extracted from the cells remaining, and RT-PCR was carried out for CD14 (B) and p21 (C) as described (reference 41). β-actin was analyzed to control for loading. Negative controls consisting of no RNA and RNA without RT were included, and these produced no signals (data not shown). The data shown are from one of two independent experiments that yielded similar results.
Figure 3
Figure 3
Wortmannin and LY294002 attenuate D3-induced CD14 expression, but not expression of Cdk inhibitor p21. Serum-starved THP-1 (4 × 10⁶) cells were incubated for 20 min at 37°C and 5% CO2 in medium alone, with wortmannin (Wrtm), or with LY294002 (LY). D3 (100 nM) was then added for 24 h at 37°C. (A) Aliquots of cells (∼0.5 × 10⁶) from each treatment were washed with staining buffer and labeled with anti-CD14 mAb or irrelevant mAb, followed by FITC-conjugated secondary Abs. Flow cytometric analyses were performed, and MFI indices were determined as described in the legend to Fig. 1. The results shown are the means ± SEM of values obtained in three separate experiments. (B and C) Total RNA was extracted from the cells remaining, and RT-PCR was carried out for CD14 (B) and p21 (C) as described (reference 41). β-actin was analyzed to control for loading. Negative controls consisting of no RNA and RNA without RT were included, and these produced no signals (data not shown). The data shown are from one of two independent experiments that yielded similar results.
Figure 4
Figure 4
Antisense S-oligo to the p110 subunit of PI 3-kinase inhibits D3-induced CD14 expression. 7 × 10⁶ THP-1 cells were suspended in 500 μl of 2.5% lipofectAMINE/RPMI 1640 alone (Control), or containing 5 μM of either sense (S) or antisense (AS) S-oligo to p110. Cells were then incubated on a rotary shaker for 4 h at 37°C. The incubation was brought up to 10 ml of medium, and cells were cultured for an additional 18 h at 37°C and 5% CO2. (A) 3 × 10⁶ cells were stimulated with 100 nM D3 for 20 min and assayed for PI 3-kinase assay as described in Materials and Methods. The upper rectangle shows PIP spots obtained in one representative experiment. The graphical data shown below represent PI 3-kinase activities (means ± SEM of values obtained in three separate experiments), calculated as described in the legend to Fig. 2. (B) Fractions of control or S-oligo–treated cells (∼1 × 10⁶) were incubated in medium alone or with D3 (100 nM, 24 h), washed with staining buffer, and then labeled with anti-CD14 mAb or irrelevant mAb, followed by FITC-conjugated secondary Abs. Flow cytometric analyses were performed, and MFI indices were determined as described in the legend to Fig. 1. Results are expressed as histograms of fluorescence intensity. Histograms displaced to the right represent cells stained with anti-CD14, and histograms on the left represent cells stained with irrelevant IgG2b. Bold, italicized values are means ± SEM (n = 3) of MFI indices, calculated as described in the legend to Fig. 1. (C) Control or S-oligo–treated cells (∼3 × 10⁶) were incubated with D3 (100 nM, 24 h). Total RNA was extracted and RT-PCR was carried out for CD14 and β-actin as described (reference 41). RT-PCR controls, as described in the legend to Fig. 3, were included. The data shown are from one of two independent experiments that yielded similar results.
Figure 4
Figure 4
Antisense S-oligo to the p110 subunit of PI 3-kinase inhibits D3-induced CD14 expression. 7 × 10⁶ THP-1 cells were suspended in 500 μl of 2.5% lipofectAMINE/RPMI 1640 alone (Control), or containing 5 μM of either sense (S) or antisense (AS) S-oligo to p110. Cells were then incubated on a rotary shaker for 4 h at 37°C. The incubation was brought up to 10 ml of medium, and cells were cultured for an additional 18 h at 37°C and 5% CO2. (A) 3 × 10⁶ cells were stimulated with 100 nM D3 for 20 min and assayed for PI 3-kinase assay as described in Materials and Methods. The upper rectangle shows PIP spots obtained in one representative experiment. The graphical data shown below represent PI 3-kinase activities (means ± SEM of values obtained in three separate experiments), calculated as described in the legend to Fig. 2. (B) Fractions of control or S-oligo–treated cells (∼1 × 10⁶) were incubated in medium alone or with D3 (100 nM, 24 h), washed with staining buffer, and then labeled with anti-CD14 mAb or irrelevant mAb, followed by FITC-conjugated secondary Abs. Flow cytometric analyses were performed, and MFI indices were determined as described in the legend to Fig. 1. Results are expressed as histograms of fluorescence intensity. Histograms displaced to the right represent cells stained with anti-CD14, and histograms on the left represent cells stained with irrelevant IgG2b. Bold, italicized values are means ± SEM (n = 3) of MFI indices, calculated as described in the legend to Fig. 1. (C) Control or S-oligo–treated cells (∼3 × 10⁶) were incubated with D3 (100 nM, 24 h). Total RNA was extracted and RT-PCR was carried out for CD14 and β-actin as described (reference 41). RT-PCR controls, as described in the legend to Fig. 3, were included. The data shown are from one of two independent experiments that yielded similar results.
Figure 5
Figure 5
CD14 response to D3 in U937 cells transfected with wild-type bovine p85α (WP85) or dominant negative mutant Δp85α (Δp85). (A) Cells were stimulated with either 100 nM D3 or medium alone for 48 h. Cells were washed with staining buffer, and then labeled with anti-CD14 mAb or irrelevant mAb, followed by secondary FITC-conjugated Abs. Flow cytometric analyses were performed, and MFI indices were determined as described in the legend to Fig. 1. The data shown are the means ± SEM of values obtained in three separate experiments. (B) Cells were stimulated with D3 or medium alone for 24 h, then total RNA was extracted and RT-PCR was carried out for CD14 and β-actin as described (reference 41). No signals were obtained with controls consisting of no RNA and RNA without RT (data not shown). The data shown are from one of two independent experiments that yielded similar results.
Figure 5
Figure 5
CD14 response to D3 in U937 cells transfected with wild-type bovine p85α (WP85) or dominant negative mutant Δp85α (Δp85). (A) Cells were stimulated with either 100 nM D3 or medium alone for 48 h. Cells were washed with staining buffer, and then labeled with anti-CD14 mAb or irrelevant mAb, followed by secondary FITC-conjugated Abs. Flow cytometric analyses were performed, and MFI indices were determined as described in the legend to Fig. 1. The data shown are the means ± SEM of values obtained in three separate experiments. (B) Cells were stimulated with D3 or medium alone for 24 h, then total RNA was extracted and RT-PCR was carried out for CD14 and β-actin as described (reference 41). No signals were obtained with controls consisting of no RNA and RNA without RT (data not shown). The data shown are from one of two independent experiments that yielded similar results.
Figure 6
Figure 6
VDR antisense S-oligo inhibits D3-induced CD14 expression. 5 × 10⁶ THP-1 cells were suspended in 500 μl of 2.5% lipofectAMINE/RPMI 1640 alone (control), or containing 5 μM of either sense (S) or antisense (AS) S-oligo to the VDR. Cells were then incubated on a rotary shaker for 4 h at 37°C. The volume was then brought up to 7 ml, and cells were cultured for an additional 18 h at 37°C and 5% CO2. (A) 0.5 × 10⁶ cells were boiled in Laemmli buffer and subjected to SDS-PAGE and immunoblotting with mAb to VDR. Membranes were developed by ECL as described (reference 44). The data shown are from one of two independent experiments that yielded similar results. (B) Aliquots of control or S-oligo–treated cells (∼1 × 10⁶) were incubated with D3 (100 nM, 24 h), washed with staining buffer, and then labeled with anti-CD14 mAb or irrelevant mAb followed by FITC-conjugated, secondary Abs. Flow cytometric analyses were performed, and MFI indices were determined as described in the legend to Fig. 1. Results are expressed as histograms of fluorescence intensity. Histograms displaced to the right represent cells stained with anti-CD14, and histograms on the left represent cells stained with irrelevant IgG2b. Bold, italicized values in each frame are averages (n = 2) of MFI indices, determined as in the legend to Fig. 1. (C) Control or S-oligo–treated cells (∼3 × 10⁶) were incubated with D3 (100 nM, 24 h). Total RNA was extracted and RT-PCR was carried out for CD14 and β-actin as described (reference 41). Controls consisting of no RNA and RNA without RT were included, and no signals were obtained (data not shown). The data shown are from one of two independent experiments that yielded similar results.
Figure 6
Figure 6
VDR antisense S-oligo inhibits D3-induced CD14 expression. 5 × 10⁶ THP-1 cells were suspended in 500 μl of 2.5% lipofectAMINE/RPMI 1640 alone (control), or containing 5 μM of either sense (S) or antisense (AS) S-oligo to the VDR. Cells were then incubated on a rotary shaker for 4 h at 37°C. The volume was then brought up to 7 ml, and cells were cultured for an additional 18 h at 37°C and 5% CO2. (A) 0.5 × 10⁶ cells were boiled in Laemmli buffer and subjected to SDS-PAGE and immunoblotting with mAb to VDR. Membranes were developed by ECL as described (reference 44). The data shown are from one of two independent experiments that yielded similar results. (B) Aliquots of control or S-oligo–treated cells (∼1 × 10⁶) were incubated with D3 (100 nM, 24 h), washed with staining buffer, and then labeled with anti-CD14 mAb or irrelevant mAb followed by FITC-conjugated, secondary Abs. Flow cytometric analyses were performed, and MFI indices were determined as described in the legend to Fig. 1. Results are expressed as histograms of fluorescence intensity. Histograms displaced to the right represent cells stained with anti-CD14, and histograms on the left represent cells stained with irrelevant IgG2b. Bold, italicized values in each frame are averages (n = 2) of MFI indices, determined as in the legend to Fig. 1. (C) Control or S-oligo–treated cells (∼3 × 10⁶) were incubated with D3 (100 nM, 24 h). Total RNA was extracted and RT-PCR was carried out for CD14 and β-actin as described (reference 41). Controls consisting of no RNA and RNA without RT were included, and no signals were obtained (data not shown). The data shown are from one of two independent experiments that yielded similar results.
Figure 7
Figure 7
The VDR is required for D3-induced PI 3-kinase activation. (A) 3 × 10⁶ THP-1 cells were treated overnight with 5 μM of either sense (S) or antisense (AS) S-oligo to VDR as described in the legend to Fig. 6. Cells were then stimulated for 20 min with 100 nM D3, and lysates were prepared and assayed for PI 3-kinase activities as described in Materials and Methods. The upper rectangle shows PIP spots obtained in one representative experiment. The data shown below are PI 3-kinase activities (averages of values obtained in two separate experiments), calculated as described in the legend to Fig. 2. (B) Cells were stimulated with D3 as in A and cell lysates were prepared and incubated overnight at 4°C either with 9A7 mAb (anti-VDR) or with mAb specific for the p85 subunit of PI 3-kinase. Immune complexes were adsorbed onto protein A and assayed for PI 3-kinase activities as described in Materials and Methods. The upper rectangle shows PIP spots obtained in one representative experiment. The data shown below are PI 3-kinase activities (average of two separate experiments), calculated as described in the legend to Fig. 2. (C) Cell lysates prepared from either control cells or D3-treated cells were immunoprecipitated with specific mAbs to either the VDR or the p85 subunit of PI 3-kinase. Immunoprecipitates were then analyzed by SDS-PAGE and immunoblotting with Abs to p85 (reference 40). Immunoprecipitates with normal mouse IgG (MIgG) and normal rat IgG (RIgG) were used to control for the specificity of anti-p85 and anti-VDR Abs, respectively.
Figure 7
Figure 7
The VDR is required for D3-induced PI 3-kinase activation. (A) 3 × 10⁶ THP-1 cells were treated overnight with 5 μM of either sense (S) or antisense (AS) S-oligo to VDR as described in the legend to Fig. 6. Cells were then stimulated for 20 min with 100 nM D3, and lysates were prepared and assayed for PI 3-kinase activities as described in Materials and Methods. The upper rectangle shows PIP spots obtained in one representative experiment. The data shown below are PI 3-kinase activities (averages of values obtained in two separate experiments), calculated as described in the legend to Fig. 2. (B) Cells were stimulated with D3 as in A and cell lysates were prepared and incubated overnight at 4°C either with 9A7 mAb (anti-VDR) or with mAb specific for the p85 subunit of PI 3-kinase. Immune complexes were adsorbed onto protein A and assayed for PI 3-kinase activities as described in Materials and Methods. The upper rectangle shows PIP spots obtained in one representative experiment. The data shown below are PI 3-kinase activities (average of two separate experiments), calculated as described in the legend to Fig. 2. (C) Cell lysates prepared from either control cells or D3-treated cells were immunoprecipitated with specific mAbs to either the VDR or the p85 subunit of PI 3-kinase. Immunoprecipitates were then analyzed by SDS-PAGE and immunoblotting with Abs to p85 (reference 40). Immunoprecipitates with normal mouse IgG (MIgG) and normal rat IgG (RIgG) were used to control for the specificity of anti-p85 and anti-VDR Abs, respectively.

References

    1. Boyle I.T., Miravet L., Gray R.W., Holick M.F., DeLuca H.F. The response of intestinal calcium transport to 25-hydroxy and 1,25-dihydroxyvitamin D in nefrectomized rats. Endocrinology. 1972;90:605–608. - PubMed
    1. Nemere I. Nongenomic effects of 1,25-dihydroxyvitamin D3potential relation of a plasmalemmal receptor to the acute enhancement of intestinal calcium transport in chick. J. Nutr. 1995;125:1695S–1698S. - PubMed
    1. Holick M.F., Garabedian M., DeLuca H.F. 1,25-dihydroxycholecalciferolmetabolite of vitamin D3 active on bone in anepheric rats. Science. 1972;176:1146–1147. - PubMed
    1. Raisz L.G., Trummel C.L., Holick M.F., DeLuca H.F. 1,25-dihydroxyvitamina potent stimulator of bone resorption in tissue culture. Science. 1972;175:768–769. - PubMed
    1. Takahashi T., Nakamura K., Iho S. Differentiation of myeloid cells and 1,25-dihydroxyvitamin D3 . Leuk. Lymphoma. 1997;27:25–33. - PubMed

Publication types

MeSH terms