. 1999 Dec 6;190(11):1605-16.
doi: 10.1084/jem.190.11.1605.

Thymocyte maturation is regulated by the activity of the helix-loop-helix protein, E47

Affiliations

Thymocyte maturation is regulated by the activity of the helix-loop-helix protein, E47

G Bain et al. J Exp Med. .

Abstract

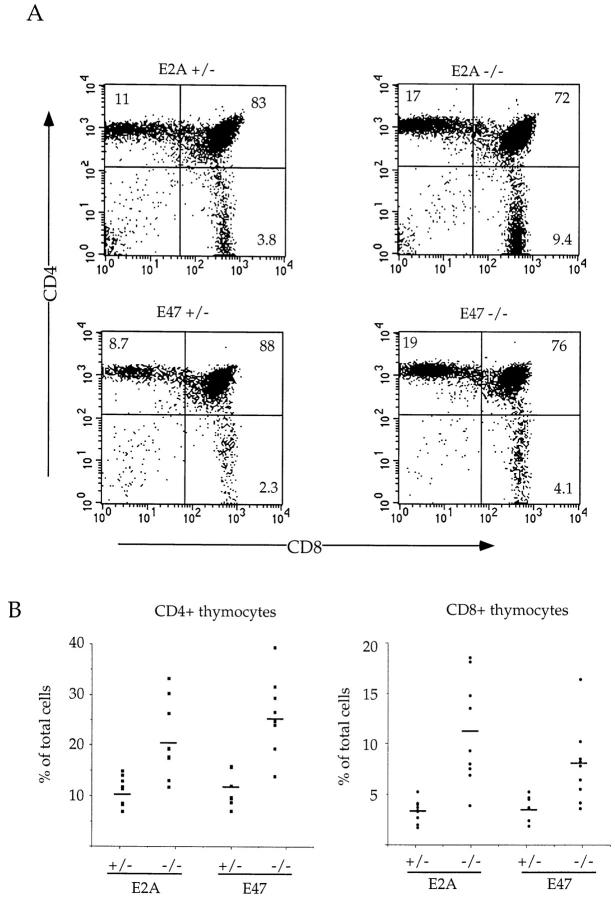
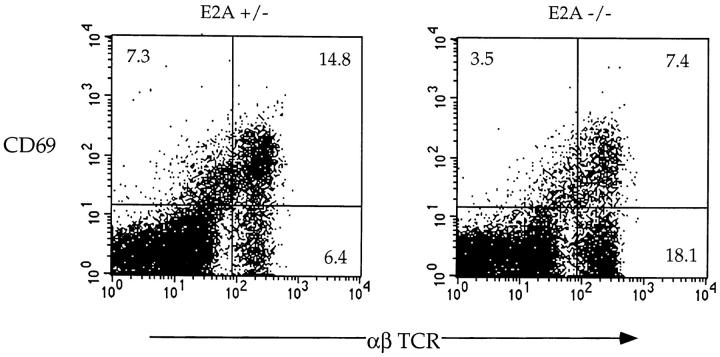
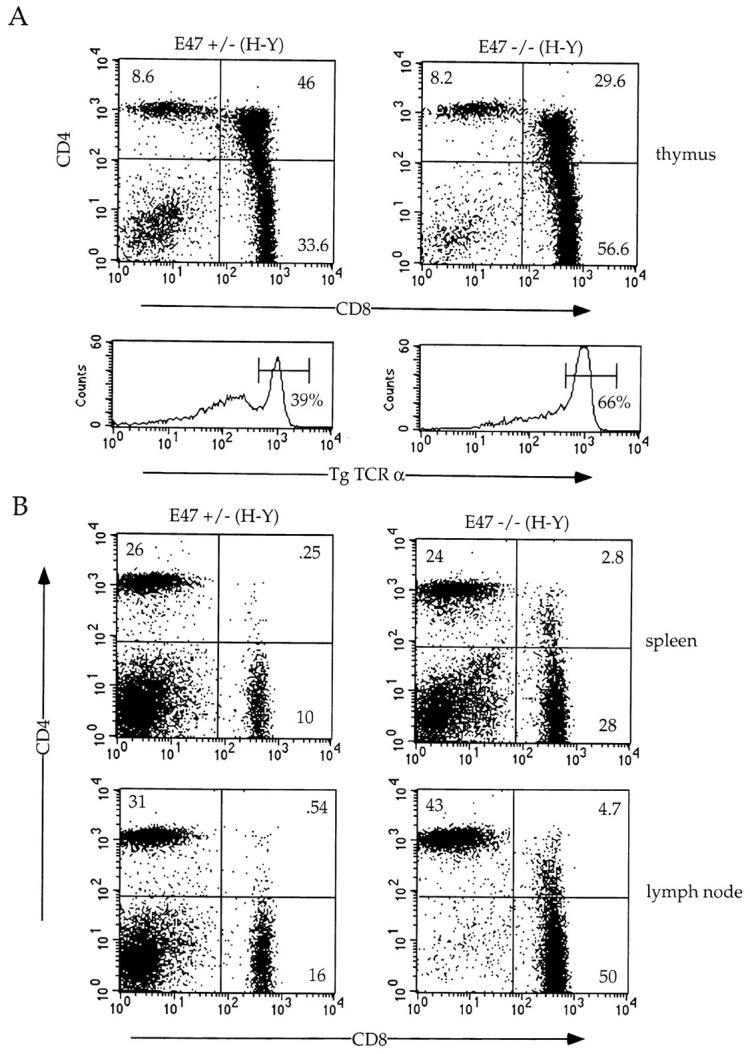
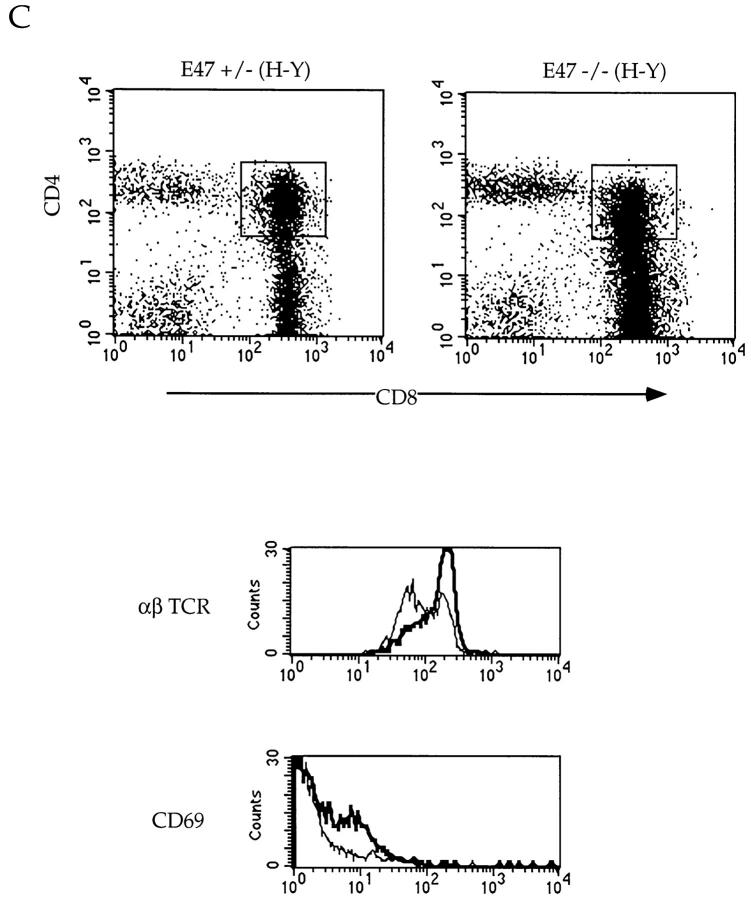
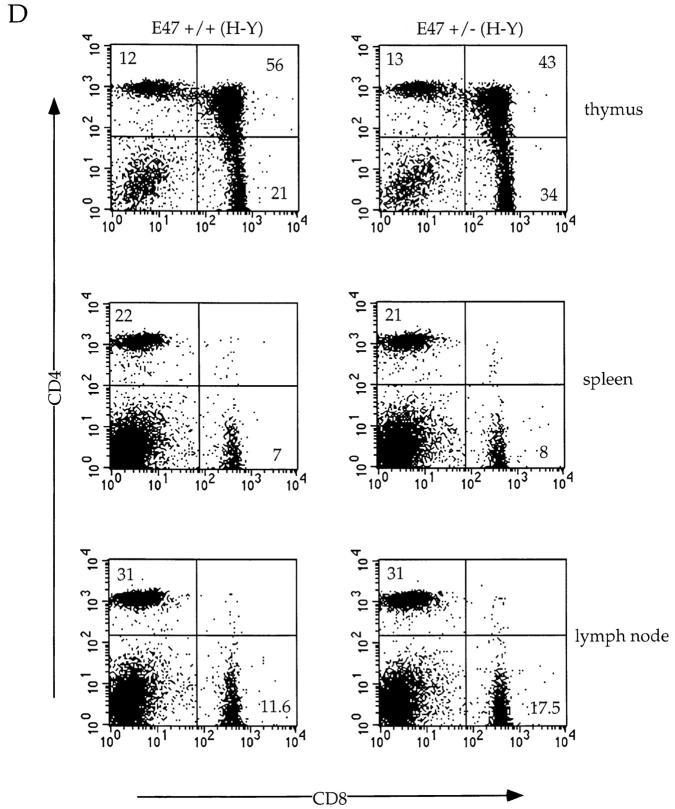
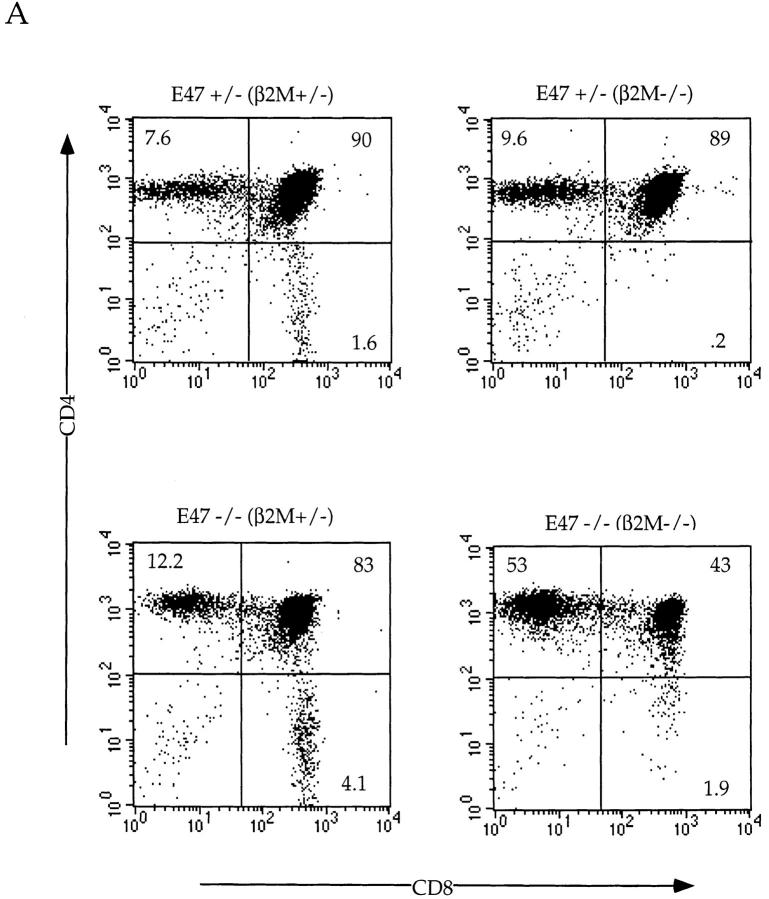
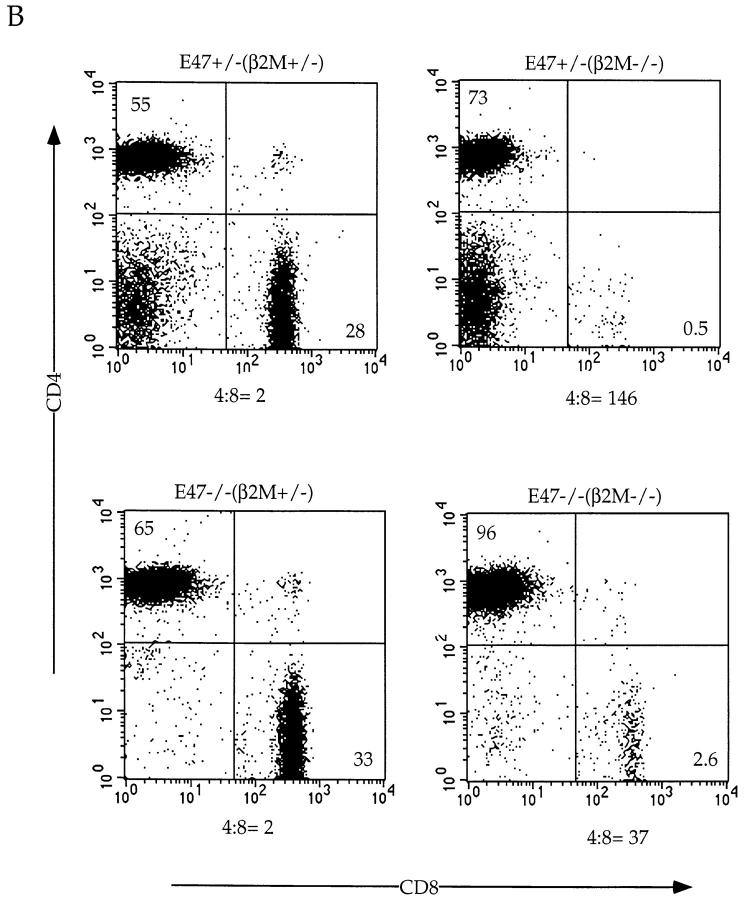
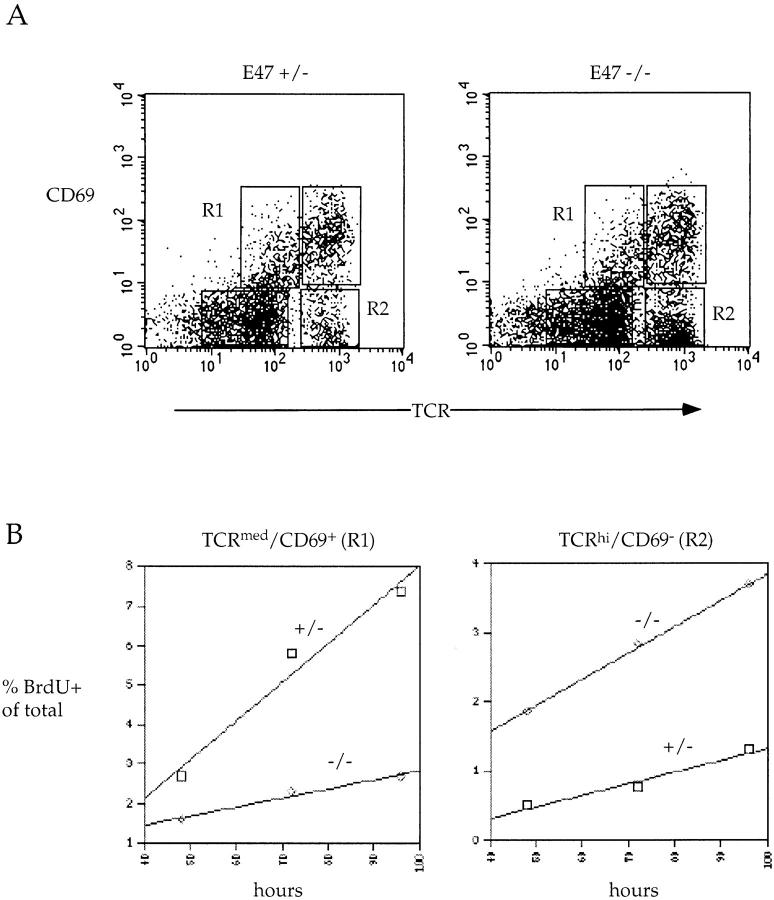
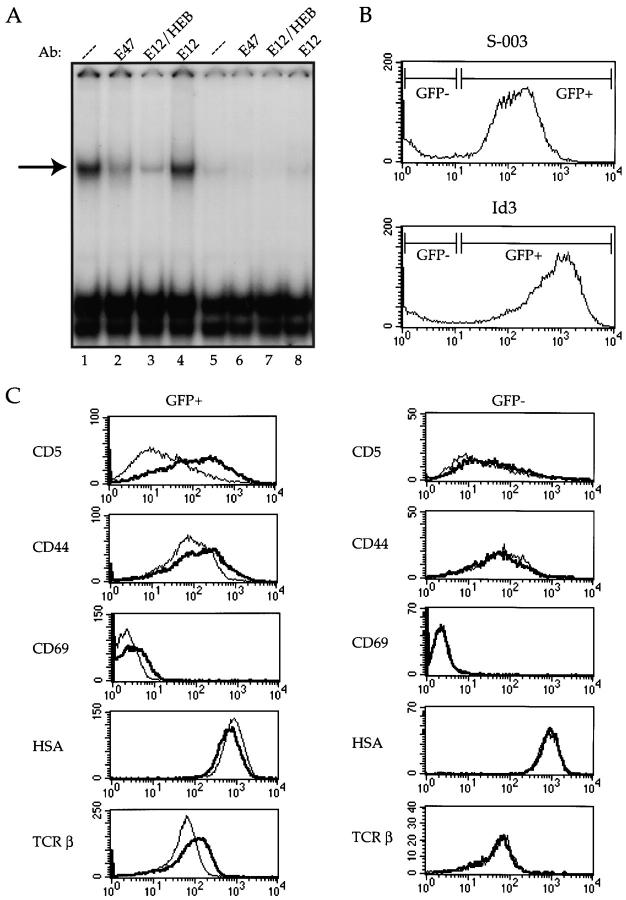
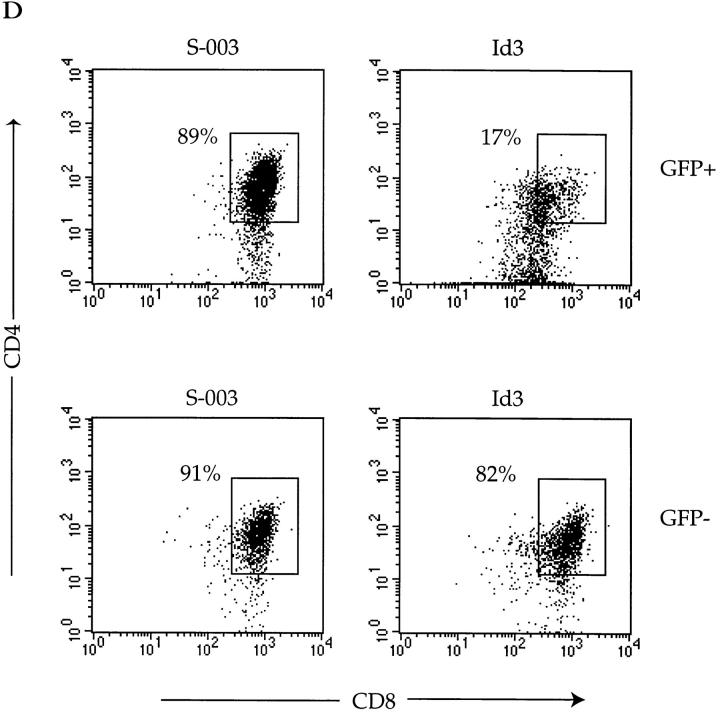
The E2A proteins, E12 and E47, are required for progression through multiple developmental pathways, including early B and T lymphopoiesis. Here, we provide in vitro and in vivo evidence demonstrating that E47 activity regulates double-positive thymocyte maturation. In the absence of E47 activity, positive selection of both major histocompatibility complex (MHC) class I- and class II-restricted T cell receptors (TCRs) is perturbed. Additionally, development of CD8 lineage T cells in an MHC class I-restricted TCR transgenic background is sensitive to the dosage of E47. Mice deficient for E47 display an increase in production of mature CD4 and CD8 lineage T cells. Furthermore, ectopic expression of an E2A inhibitor helix-loop-helix protein, Id3, promotes the in vitro differentiation of an immature T cell line. These results demonstrate that E2A functions as a regulator of thymocyte positive selection.


Figures

Figure 1
Figure 1
Increased percentage of SP thymocytes in E2A- and E47-deficient mice. (A) Two-color flow cytometric analysis of thymocytes from 4–6-wk-old E2A- and E47-deficient mice and heterozygous littermates. Thymocytes were analyzed by staining with anti-CD8α and anti-CD4. The numbers in each quadrant indicate the percentage of thymocytes in that population. (B) The percentage of mature CD4+ (left) or CD8+ (right) thymocytes is plotted for eight to nine individual E2A- and E47-deficient mice and heterozygous controls. The horizontal bars indicate the average percentage of CD4+ or CD8+ thymocytes for each genotype.
Figure 3
Figure 3
Absence of E2A leads to an increased generation of mature SP cells in class II–restricted TCR transgenic mice. Flow cytometric analysis of 4–6-wk-old E47-deficient mice and littermate controls expressing the class II–restricted AND TCR transgene. Thymocytes (top panels), splenocytes (middle panels), and lymph node cells (bottom panels) were analyzed by staining with anti-CD4–PE and anti-CD8α–FITC. The numbers in each quadrant indicate the percentage of cells in that population. Genotypes of the mice are indicated above the thymic profiles. The numbers shown above the splenocyte and lymph node panels indicate the CD4/CD8 ratio within those populations.
Figure 2
Figure 2
E47 deficiency leads to altered thymocyte maturation. Two-color flow cytometric analysis of TCR-α/β and CD69 expression on thymocytes from a 5-wk-old E2A-deficient mouse and a heterozygous littermate. The numbers in each quadrant indicate the percentage of thymocytes in that population.
Figure 4
Figure 4
Altered maturation of thymocytes in class I–restricted TCR transgenic mice expressing decreased levels of E47. Flow cytometric analysis of 4–6-wk-old E47-deficient female mice and littermate controls expressing the class I–restricted H-Y TCR transgene. (A) Thymocytes from E47 knockout and heterozygous littermate females were stained with anti-CD4–PE and anti-CD8α–FITC or with the anti-Vα3 antibody, T3.70, which recognizes the transgenic α chain. The numbers in each quadrant indicate the percentage of cells in that population, and the percentage of cells staining brightly for the transgenic α chain is indicated in the histograms. (B) Splenocytes (top panels) and lymph node cells (bottom panels) from female H-Y transgenics of the indicated E47 genotype were analyzed by staining with anti-CD4–PE and anti-CD8α–FITC. The numbers in each quadrant indicate the percentage of cells in that population. (C) Thymocytes from an E47 heterozygous and knockout littermate expressing the H-Y TCR transgene were analyzed by three-color flow cytometric analysis for expression of CD4, CD8, and either TCR-α/β or CD69. The boxed regions in the CD4 versus CD8 plots indicate the analysis gates used to define the DP population. In the histogram plots, the thin lines indicate staining on the E47 heterozygous H-Y DP cells, and the thick lines indicate staining on the E47-deficient H-Y DP cells. The third color antibody used in each case is indicated. (D) Thymocytes (top panels), splenocytes (middle panels), and lymph node cells (bottom panels) from female H-Y transgenics that are wild-type or heterozygous for E47 were analyzed by staining with antibodies to CD4 and CD8. The numbers in each quadrant indicate the percentage of cells in that population.
Figure 4
Figure 4
Altered maturation of thymocytes in class I–restricted TCR transgenic mice expressing decreased levels of E47. Flow cytometric analysis of 4–6-wk-old E47-deficient female mice and littermate controls expressing the class I–restricted H-Y TCR transgene. (A) Thymocytes from E47 knockout and heterozygous littermate females were stained with anti-CD4–PE and anti-CD8α–FITC or with the anti-Vα3 antibody, T3.70, which recognizes the transgenic α chain. The numbers in each quadrant indicate the percentage of cells in that population, and the percentage of cells staining brightly for the transgenic α chain is indicated in the histograms. (B) Splenocytes (top panels) and lymph node cells (bottom panels) from female H-Y transgenics of the indicated E47 genotype were analyzed by staining with anti-CD4–PE and anti-CD8α–FITC. The numbers in each quadrant indicate the percentage of cells in that population. (C) Thymocytes from an E47 heterozygous and knockout littermate expressing the H-Y TCR transgene were analyzed by three-color flow cytometric analysis for expression of CD4, CD8, and either TCR-α/β or CD69. The boxed regions in the CD4 versus CD8 plots indicate the analysis gates used to define the DP population. In the histogram plots, the thin lines indicate staining on the E47 heterozygous H-Y DP cells, and the thick lines indicate staining on the E47-deficient H-Y DP cells. The third color antibody used in each case is indicated. (D) Thymocytes (top panels), splenocytes (middle panels), and lymph node cells (bottom panels) from female H-Y transgenics that are wild-type or heterozygous for E47 were analyzed by staining with antibodies to CD4 and CD8. The numbers in each quadrant indicate the percentage of cells in that population.
Figure 5
Figure 5
Appearance of DP cells in the periphery of E47-deficient/ H-Y transgenic mice. 6-wk-old H-Y transgenic mice of the indicated E47 genotype were analyzed by three-color flow cytometry for the expression of CD4, CD8, and either HSA (B) or TCR-α/β (C). The CD4 versus CD8 profiles for the thymocytes (top panels) and splenocytes (bottom panels) are shown (A), and the numbers in each quadrant indicate the percentage of cells in that population. The boxed regions in the CD4 versus CD8 plots (a–e) indicate the analysis gates used to define the populations analyzed in B and C. In the histogram plots (B and C), the lettered arrows indicate the staining pattern for the corresponding boxed populations in A. To make comparisons clearer, the histograms were plotted in pairs to compare the peripheral DP population with the thymic DP population (left panels) and with the SP populations (right panels).
Figure 6
Figure 6
Development of CD8+ cells in the E47-deficient mice requires MHC class I expression. E47-deficient mice were bred onto the β2M-deficient background, and 4–6-wk-old littermates were analyzed for CD4, CD8, and TCR expression. Thymocytes (A) and splenocytes (B) from E47-deficient and heterozygous littermates on a β2M-deficient or heterozygous background were analyzed by staining with anti-CD8α and anti-CD4. The numbers in each quadrant indicate the percentage of thymocytes in that population. The CD4/CD8 ratios for the spleens are indicated under the FACS® plots in B.
Figure 6
Figure 6
Development of CD8+ cells in the E47-deficient mice requires MHC class I expression. E47-deficient mice were bred onto the β2M-deficient background, and 4–6-wk-old littermates were analyzed for CD4, CD8, and TCR expression. Thymocytes (A) and splenocytes (B) from E47-deficient and heterozygous littermates on a β2M-deficient or heterozygous background were analyzed by staining with anti-CD8α and anti-CD4. The numbers in each quadrant indicate the percentage of thymocytes in that population. The CD4/CD8 ratios for the spleens are indicated under the FACS® plots in B.
Figure 7
Figure 7
Increased rate of appearance of mature thymocytes in mice deficient for E47. Mice were continuously exposed to the thymidine analogue BrdU in their drinking water for the indicated times and then analyzed for BrdU content and TCR-α/β and CD69 surface expression. (A) Representative TCR-α/β/CD69 FACS® plots for E47-deficient and heterozygous mice. (B) Rate of appearance of BrdU-labeled TCRmed CD69+ cells (left) and TCRhiCD69 cells (right). The percent BrdU-labeled cells of total cells is plotted against the time of continuous exposure to BrdU. The gates used to define the TCRmedCD69+ cells and TCRhiCD69 cells are shown in A as R1 and R2, respectively. The numbers plotted are the averages from two mice.
Figure 8
Figure 8
Inhibition of E47 activity in a DP T cell line promotes differentiation. The 16610D9 DP T cell line was retrovirally infected with Id3 or control (S-003) virus. 48 h after infection, the cells were harvested and WCE was prepared as described from half of the cells while the remainder of the cells was stained with the indicated antibodies and analyzed by flow cytometry. (A) E2A binding activity was analyzed by electrophoretic mobility shift assay using a labeled μE5 oligo probe. Lanes 1–4, S-003–infected cells; lanes 5–8, Id3-infected cells. Extracts were preincubated with mAbs (Ab) against E47 (lanes 2 and 6), E12/HEB (lanes 3 and 7), or E12 (lanes 4 and 8) before the addition of the probe. The arrow at left indicates the E47-containing complex. (B) EGFP expression on the S-003 (top) and Id3 (bottom) infected cells. The gates used to define the GFP+ and GFP populations are indicated in the histograms. (C) Infected cells were stained with the indicated antibodies and analyzed by flow cytometry. The left panels show staining patterns on the GFP+ cells, and the right panels show staining patterns on the GFP cells within the same infection. Thin line indicates staining on the S-003–infected cells, and thick line indicates staining on the Id3-infected cells. (D) CD4/CD8 staining on GFP+ (top panels) and GFP (bottom panels) from control (S-003) and Id3-infected cells. The percentage of CD4/CD8 DP cells (boxed area) is indicated in each plot.
Figure 8
Figure 8
Inhibition of E47 activity in a DP T cell line promotes differentiation. The 16610D9 DP T cell line was retrovirally infected with Id3 or control (S-003) virus. 48 h after infection, the cells were harvested and WCE was prepared as described from half of the cells while the remainder of the cells was stained with the indicated antibodies and analyzed by flow cytometry. (A) E2A binding activity was analyzed by electrophoretic mobility shift assay using a labeled μE5 oligo probe. Lanes 1–4, S-003–infected cells; lanes 5–8, Id3-infected cells. Extracts were preincubated with mAbs (Ab) against E47 (lanes 2 and 6), E12/HEB (lanes 3 and 7), or E12 (lanes 4 and 8) before the addition of the probe. The arrow at left indicates the E47-containing complex. (B) EGFP expression on the S-003 (top) and Id3 (bottom) infected cells. The gates used to define the GFP+ and GFP populations are indicated in the histograms. (C) Infected cells were stained with the indicated antibodies and analyzed by flow cytometry. The left panels show staining patterns on the GFP+ cells, and the right panels show staining patterns on the GFP cells within the same infection. Thin line indicates staining on the S-003–infected cells, and thick line indicates staining on the Id3-infected cells. (D) CD4/CD8 staining on GFP+ (top panels) and GFP (bottom panels) from control (S-003) and Id3-infected cells. The percentage of CD4/CD8 DP cells (boxed area) is indicated in each plot.

Similar articles

Cited by

References

    1. Jameson S., Bevan M. T-cell selection. Curr. Opin. Immunol. 1998;10:214–219. - PubMed
    1. Kisielow P., von Boehmer H. Development and selection of T cellsfacts and puzzles. Adv. Immunol. 1995;58:87–209. - PubMed
    1. Robey E., Fowlkes B. Selective events in T cell development. Annu. Rev. Immunol. 1994;12:675–705. - PubMed
    1. Bain G., Robanus-Maandag E., Izon D., Amsen D., Kruisbeek A., Weintraub B., Krop I., Schlissel M., Feeney A., van Roon M. E2A proteins are required for proper B cell development and initiation of immunoglobulin gene rearrangements. Cell. 1994;79:885–892. - PubMed
    1. Murre C., McCaw P.S., Baltimore D. A new DNA binding and dimerization motif in immunoglobulin enhancer binding, daughterless, MyoD, and myc proteins. Cell. 1989;56:777–783. - PubMed

Publication types

MeSH terms

Substances