. 1999 Dec 6;190(11):1657-68.
doi: 10.1084/jem.190.11.1657.

RIBP, a novel Rlk/Txk- and itk-binding adaptor protein that regulates T cell activation

Affiliations

RIBP, a novel Rlk/Txk- and itk-binding adaptor protein that regulates T cell activation

K Rajagopal et al. J Exp Med. .

Abstract

A novel T cell-specific adaptor protein, RIBP, was identified based on its ability to bind Rlk/Txk in a yeast two-hybrid screen of a mouse T cell lymphoma library. RIBP was also found to interact with a related member of the Tec family of tyrosine kinases, Itk. Expression of RIBP is restricted to T and natural killer cells and is upregulated substantially after T cell activation. RIBP-disrupted knockout mice displayed apparently normal T cell development. However, proliferation of RIBP-deficient T cells in response to T cell receptor (TCR)-mediated activation was significantly impaired. Furthermore, these activated T cells were defective in the production of interleukin (IL)-2 and interferon gamma, but not IL-4. These data suggest that RIBP plays an important role in TCR-mediated signal transduction pathways and that its binding to Itk and Rlk/Txk may regulate T cell differentiation.


Figures

Figure 1
Figure 1
Identification of an Rlk and Itk interacting protein, RIBP. (A) Yeast two-hybrid system interactions between RIBP and Itk, Rlk, or kinase-mutant Rlk (K309R). Top: Growth of bait plus trap–transformed yeast on leucine and tryptophan–deficient (−LT) medium (positive control for transformation with both constructs). Bottom: Assay for a specific bait–trap interaction. Growth of bait plus trap–transformed yeast on –LT, +3-aminotriazole (3AT, endogenous histidine synthesis inhibitor) medium. For interactions with Rlk, results are representative of 11 independent experiments. For interactions with Itk, results are representative of two independent experiments. For interactions with Rlk(K309R), results are representative of four independent experiments. (B) Western blot demonstrating association of RIBP with Itk in transfected HEK293 cells. Top: Lysates prepared from HEK293 cells transfected with the indicated constructs (top of the blot) were precleared with rat IgG on protein G beads, and subsequently, the supernatants were immunoprecipitated with rat anti-HA mAb. Immunoprecipitates and preclears were resolved by SDS-PAGE, transferred to a polyvinyldifluoride membrane, and immunoblotted with an anti-Itk antiserum. Bottom: Immunoblot from B was stripped and reprobed with mouse anti-HA to assess the amount of RIBP in the immunoprecipitates. Results are representative of three experiments. WCL, whole cell lysates. (C) Amino acid sequence homology between RIBP and TSAd. NH2 and COOH termini of a putative SH2 domain and PRR are indicated by arrows. Dots between amino acids in RIBP and TSAd indicate homology, with two dots indicating greater homology. The amino acid insertions present in the alternatively spliced forms of RIBP and TSAd are boxed with a solid line; NPXY PTB domain sequences are underlined, and YXXP and YXXV sequences, in boldface, are in boxes with dashed lines or dot-dashed lines, respectively. Putative N-myristoylation sites are in boldface and italics. The RIBP nucleotide sequence is available from EMBL/GenBank/DDBJ under accession no. AF203343.
Figure 2
Figure 2
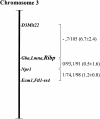
Chromosomal localization of mouse RIBP. To the right of the map are recombination fractions between adjacent loci, with the first fraction representing data from the M. m. musculus crosses and the second from the M. spretus crosses. Numbers in parentheses are recombinational distances ± SE. The M. m. musculus crosses were not typed for D3Mit22.
Figure 4
Figure 4
Targeted disruption of the RIBP gene. (A) Partial restriction endonuclease maps of the endogenous RIBP locus, targeting construct, and the targeted RIBP locus. Top: Restriction endonuclease map of the endogenous RIBP locus. Exons 3 and 4, deleted by homologous recombination in the KO mice, are indicated. Middle: Restriction endonuclease map of the targeting construct. Bottom: Restriction endonuclease map of the targeted RIBP locus. (B) Southern blot analyses of genomic DNA from targeted ES cell clones and genotyping of a litter from an intercross of RIBP heterozygous parents. Top left: Genomic DNA from ES cell clones was digested with EcoRI and XhoI, subjected to gel electrophoresis, and subsequently hybridized to a 5′ RIBP cDNA probe (a 1.8-kb fragment spanning the 5′-most EcoRI site to the KpnI/Asp718 site). The wild-type RIBP allele is represented by a 3.8-kb band, and the targeted allele is represented by a 5.5-kb band. Targeted ES cell clones are lanes 1–4, and a wild-type ES cell clone is denoted J1. Top right: ES cell genomic DNA was digested with Asp718 and XhoI, subjected to gel electrophoresis, and subsequently hybridized to a 3′ RIBP cDNA probe (a 1-kb fragment contained within the SmaI to HindIII fragment, near the 3′ end of RIBP, as shown in A). The wild-type RIBP allele is represented by a 20-kb band, and the targeted allele is represented by a 15-kb band. ES cell clones are as indicated previously. Bottom: Mouse tail genomic DNA samples from progeny of a mating of RIBP heterozygous parents were digested, subjected to gel electrophoresis, and subsequently hybridized to a 5′ RIBP cDNA probe as described previously for ES cell clone samples (top left). (C) Verification of absence of RIBP expression in RIBP KO mice. Lysates were prepared from activated splenocytes from wild-type, heterozygous, and homozygous KO mice and immunoblotted with an anti-RIBP polyclonal antiserum.
Figure 4
Figure 4
Targeted disruption of the RIBP gene. (A) Partial restriction endonuclease maps of the endogenous RIBP locus, targeting construct, and the targeted RIBP locus. Top: Restriction endonuclease map of the endogenous RIBP locus. Exons 3 and 4, deleted by homologous recombination in the KO mice, are indicated. Middle: Restriction endonuclease map of the targeting construct. Bottom: Restriction endonuclease map of the targeted RIBP locus. (B) Southern blot analyses of genomic DNA from targeted ES cell clones and genotyping of a litter from an intercross of RIBP heterozygous parents. Top left: Genomic DNA from ES cell clones was digested with EcoRI and XhoI, subjected to gel electrophoresis, and subsequently hybridized to a 5′ RIBP cDNA probe (a 1.8-kb fragment spanning the 5′-most EcoRI site to the KpnI/Asp718 site). The wild-type RIBP allele is represented by a 3.8-kb band, and the targeted allele is represented by a 5.5-kb band. Targeted ES cell clones are lanes 1–4, and a wild-type ES cell clone is denoted J1. Top right: ES cell genomic DNA was digested with Asp718 and XhoI, subjected to gel electrophoresis, and subsequently hybridized to a 3′ RIBP cDNA probe (a 1-kb fragment contained within the SmaI to HindIII fragment, near the 3′ end of RIBP, as shown in A). The wild-type RIBP allele is represented by a 20-kb band, and the targeted allele is represented by a 15-kb band. ES cell clones are as indicated previously. Bottom: Mouse tail genomic DNA samples from progeny of a mating of RIBP heterozygous parents were digested, subjected to gel electrophoresis, and subsequently hybridized to a 5′ RIBP cDNA probe as described previously for ES cell clone samples (top left). (C) Verification of absence of RIBP expression in RIBP KO mice. Lysates were prepared from activated splenocytes from wild-type, heterozygous, and homozygous KO mice and immunoblotted with an anti-RIBP polyclonal antiserum.
Figure 3
Figure 3
Northern blot analysis of RIBP tissue and T cell subset expression and its induction by T cell activation. (A) Northern blot analysis of RIBP gene expression in various tissues, and in different thymocyte subsets and peripheral T cells. A blot with RNA from various tissues was probed with an oligonucleotide derived from RIBP cDNA (left). Reprobing of the blot with an oligonucleotide specific for the housekeeping gene EF demonstrated equivalent RNA loading (not shown). RIBP expression in lymph node and thymocyte subsets was assessed similarly (right). Ethidium bromide staining of the gel revealed equivalent RNA loading except for lanes 3 and 4 (not shown), which had greater amounts of RNA present. (B) Northern blot analysis of regulation of RIBP gene expression by T cell activation. Top: RIBP expression in A.E7 Th1 T cell clones (left) and PGL10 Th1 T cell clones (right) stimulated with anti-CD3 (0.1 μg/ml for A.E7, and 5.0 μg/ml for PGL10) for the indicated times. Total RNA per sample was assessed by ethidium bromide staining, and demonstrated equivalent loading (not shown). Results for regulation of RIBP expression in T cell clones are representative of a total of four experiments. Bottom: Expression of RIBP in NK cells and Th2 T cell clones.
Figure 5
Figure 5
Flow cytofluorimetric analysis of T cell development and peripheral T cell subsets in RIBP KO mice. (A) Thymocyte development in RIBP KO mice. Mice used were 7–10 wk of age. Cells were stained with FITC-conjugated anti-CD8 mAb and PE-conjugated anti-CD4 mAb to distinguish double negative, double positive, and single positive populations. Staining of thymocytes pooled from three wild-type mice (WT, left) compared with thymocytes pooled from three RIBP KO mice (right). (B) Lymph node T cell subsets in RIBP KO mice. Lymph node cells from 7–10 wk old wild-type (left) and KO (right) mice were stained with the same Abs as in A, as described in Materials and Methods. Results are representative of four independent experiments.
Figure 5
Figure 5
Flow cytofluorimetric analysis of T cell development and peripheral T cell subsets in RIBP KO mice. (A) Thymocyte development in RIBP KO mice. Mice used were 7–10 wk of age. Cells were stained with FITC-conjugated anti-CD8 mAb and PE-conjugated anti-CD4 mAb to distinguish double negative, double positive, and single positive populations. Staining of thymocytes pooled from three wild-type mice (WT, left) compared with thymocytes pooled from three RIBP KO mice (right). (B) Lymph node T cell subsets in RIBP KO mice. Lymph node cells from 7–10 wk old wild-type (left) and KO (right) mice were stained with the same Abs as in A, as described in Materials and Methods. Results are representative of four independent experiments.
Figure 6
Figure 6
Impairment of RIBP KO T cell proliferation and IL-2 production in response to TCR-triggered activation. (A) Proliferation of T cells from RIBP heterozygous and RIBP KO mice as a function of TCR stimulus (anti-CD3). Splenocytes from heterozygous (filled symbols) or KO (open symbols) mice were stimulated with the indicated concentrations of soluble anti-CD3 alone (triangles), with or without soluble anti-CD28 added at 1.0 μg/ml (circles). Proliferation was assessed at 48 h, with a [3H]thymidine pulse added after 40 h, for an 8-h pulse duration. Results are representative of four independent experiments performed using splenocytes, and three independent experiments using purified T cells and irradiated, T cell–depleted APCs. (B) Proliferation of T cells from wild-type (WT) and RIBP KO mice in response to either anti-CD3 or PMA plus ionomycin (P+I). Proliferation was assessed as above. (C) Splenocytes from wild-type and RIBP KO mice were stimulated with 1 μg/ml of soluble anti-CD3, with or without 1 μg/ml of soluble anti-CD28. Supernatants were collected at either 6, 24, or 48 h, and the concentration of IL-2 was determined by ELISA; values listed above were obtained at 24 h. Results are representative of 11 independent experiments. (D) Splenocytes from RIBP KO or wild-type mice were activated for the indicated times with anti-CD3 with or without anti-CD28. Ab concentrations were 1 μg/ml for both mAbs. RNA prepared from cells was subsequently subjected to RNase protection assays, as described in Materials and Methods. 32P autoradiogram of RNase protection assay polyacrylamide gel. Top: IL-2 mRNA levels in wild-type and RIBP KO T cells activated for the indicated times with the stimuli listed. EL4 mRNA is a positive control for cytokine gene expression, and yeast tRNA is a negative control. Bottom: mRNA levels for the L32 housekeeping gene. Results are representative of three independent experiments.
Figure 6
Figure 6
Impairment of RIBP KO T cell proliferation and IL-2 production in response to TCR-triggered activation. (A) Proliferation of T cells from RIBP heterozygous and RIBP KO mice as a function of TCR stimulus (anti-CD3). Splenocytes from heterozygous (filled symbols) or KO (open symbols) mice were stimulated with the indicated concentrations of soluble anti-CD3 alone (triangles), with or without soluble anti-CD28 added at 1.0 μg/ml (circles). Proliferation was assessed at 48 h, with a [3H]thymidine pulse added after 40 h, for an 8-h pulse duration. Results are representative of four independent experiments performed using splenocytes, and three independent experiments using purified T cells and irradiated, T cell–depleted APCs. (B) Proliferation of T cells from wild-type (WT) and RIBP KO mice in response to either anti-CD3 or PMA plus ionomycin (P+I). Proliferation was assessed as above. (C) Splenocytes from wild-type and RIBP KO mice were stimulated with 1 μg/ml of soluble anti-CD3, with or without 1 μg/ml of soluble anti-CD28. Supernatants were collected at either 6, 24, or 48 h, and the concentration of IL-2 was determined by ELISA; values listed above were obtained at 24 h. Results are representative of 11 independent experiments. (D) Splenocytes from RIBP KO or wild-type mice were activated for the indicated times with anti-CD3 with or without anti-CD28. Ab concentrations were 1 μg/ml for both mAbs. RNA prepared from cells was subsequently subjected to RNase protection assays, as described in Materials and Methods. 32P autoradiogram of RNase protection assay polyacrylamide gel. Top: IL-2 mRNA levels in wild-type and RIBP KO T cells activated for the indicated times with the stimuli listed. EL4 mRNA is a positive control for cytokine gene expression, and yeast tRNA is a negative control. Bottom: mRNA levels for the L32 housekeeping gene. Results are representative of three independent experiments.
Figure 7
Figure 7
Demonstration of defective IFN-γ induction and normal IL-4 induction by activated RIBP KO T cells. (A) ELISA determination (see Fig. 6 C) of IFN-γ production by RIBP KO T cells. Results are representative of at least three independent experiments. (B) 32P autoradiogram of RNase protection assay polyacrylamide gel, as described in the legend to Fig. 6 D. Stimulation conditions are also as described for Fig. 6 D. Top: IFN-γ mRNA levels in wild-type (WT) and RIBP KO T cells activated for the indicated times with the stimuli listed. EL4 mRNA is a positive control for cytokine gene expression, and yeast tRNA is a negative control. Bottom: mRNA levels for the L32 housekeeping gene. Results are representative of three independent experiments. (C) IL-4 production by activated control and RIBP KO T cells. Supernatants (see Fig. 6 C and 7 A) were collected at 48 h and assessed for IL-4 by ELISA. Results are representative of at least three independent experiments.
Figure 7
Figure 7
Demonstration of defective IFN-γ induction and normal IL-4 induction by activated RIBP KO T cells. (A) ELISA determination (see Fig. 6 C) of IFN-γ production by RIBP KO T cells. Results are representative of at least three independent experiments. (B) 32P autoradiogram of RNase protection assay polyacrylamide gel, as described in the legend to Fig. 6 D. Stimulation conditions are also as described for Fig. 6 D. Top: IFN-γ mRNA levels in wild-type (WT) and RIBP KO T cells activated for the indicated times with the stimuli listed. EL4 mRNA is a positive control for cytokine gene expression, and yeast tRNA is a negative control. Bottom: mRNA levels for the L32 housekeeping gene. Results are representative of three independent experiments. (C) IL-4 production by activated control and RIBP KO T cells. Supernatants (see Fig. 6 C and 7 A) were collected at 48 h and assessed for IL-4 by ELISA. Results are representative of at least three independent experiments.

Similar articles

Cited by

References

    1. Chan A.C., Shaw A.S. Regulation of antigen receptor signal transduction by protein tyrosine kinases. Curr. Opin. Immunol. 1996;8:394–401. - PubMed
    1. Bolen J.B. Protein tyrosine kinases in the initiation of antigen receptor signaling. Curr. Opin. Immunol. 1995;7:306–311. - PubMed
    1. DeFranco A.L. Transmembrane signaling by antigen receptors of B and T lymphocytes. Curr. Opin. Cell Biol. 1995;7:163–175. - PubMed
    1. Weiss A., Littman D.R. Signal transduction by lymphocyte antigen receptors. Cell. 1994;76:263–274. - PubMed
    1. Neet K., Hunter T. Vertebrate non-receptor protein-tyrosine kinase families. Genes Cells. 1996;1:147–169. - PubMed

Publication types

MeSH terms

Associated data