. 1999 Dec 6;190(11):1697-710.
doi: 10.1084/jem.190.11.1697.

Mice transgenic for BAFF develop lymphocytic disorders along with autoimmune manifestations

Affiliations

Mice transgenic for BAFF develop lymphocytic disorders along with autoimmune manifestations

F Mackay et al. J Exp Med. .

Abstract

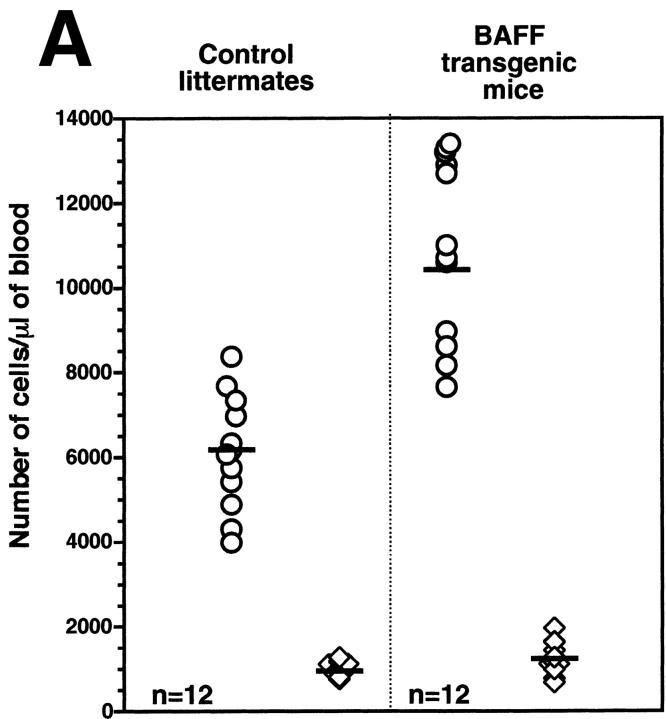
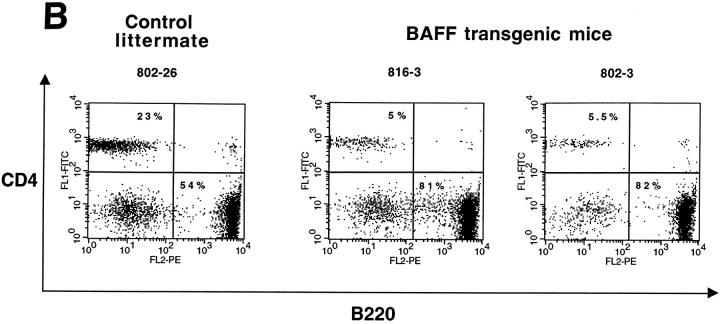
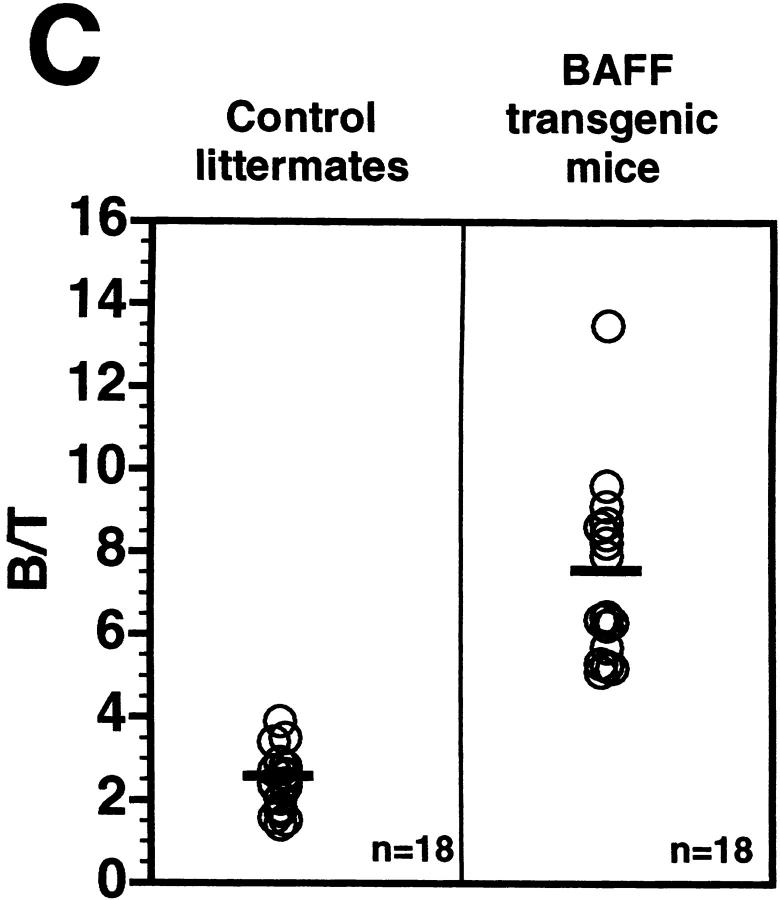
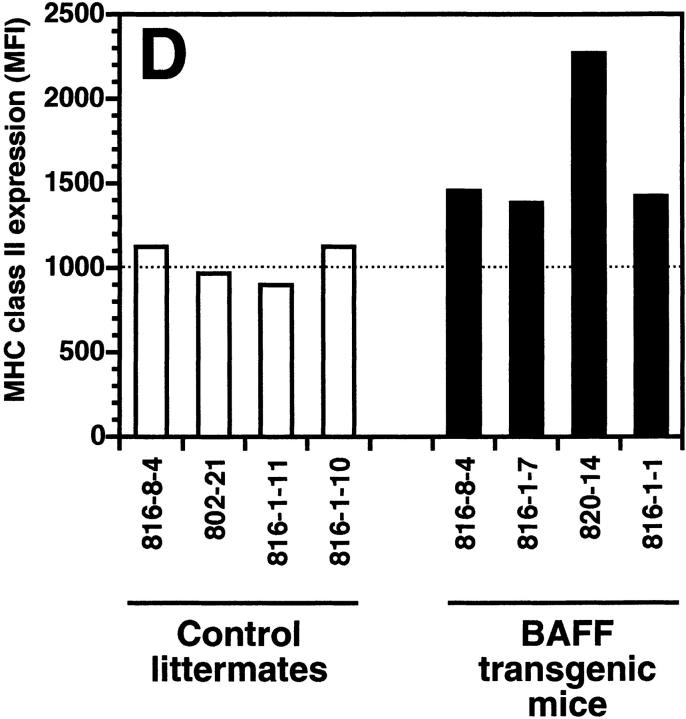
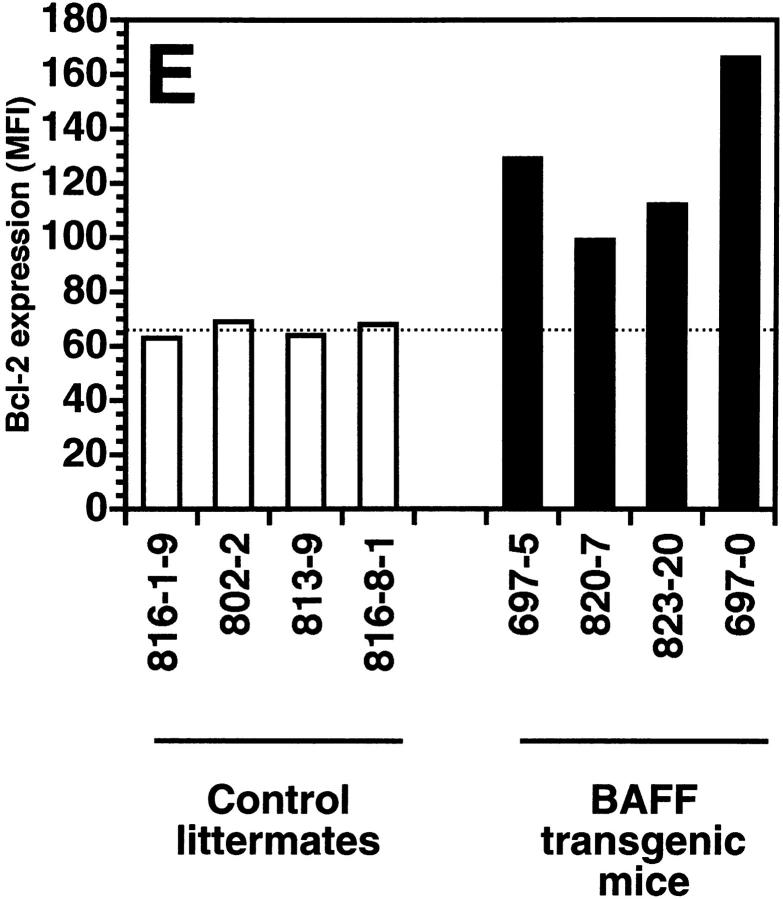
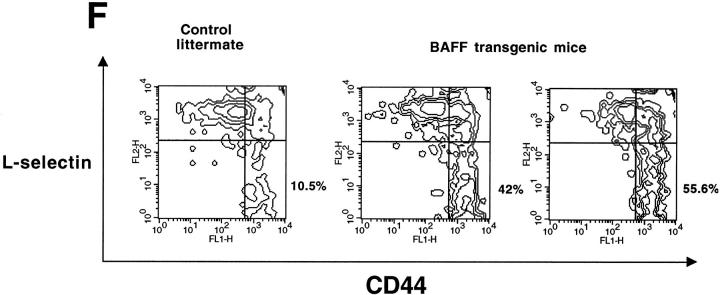
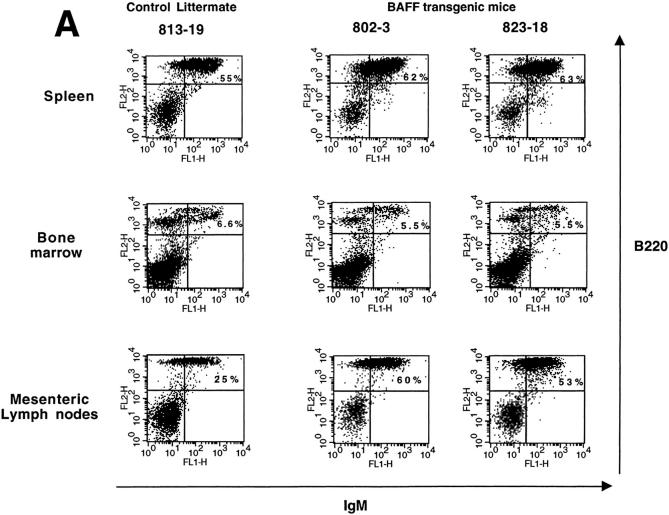
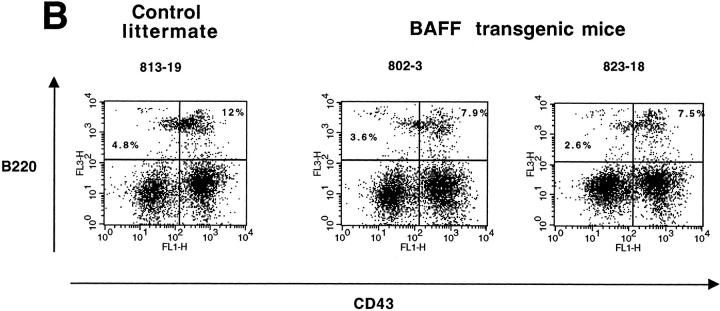
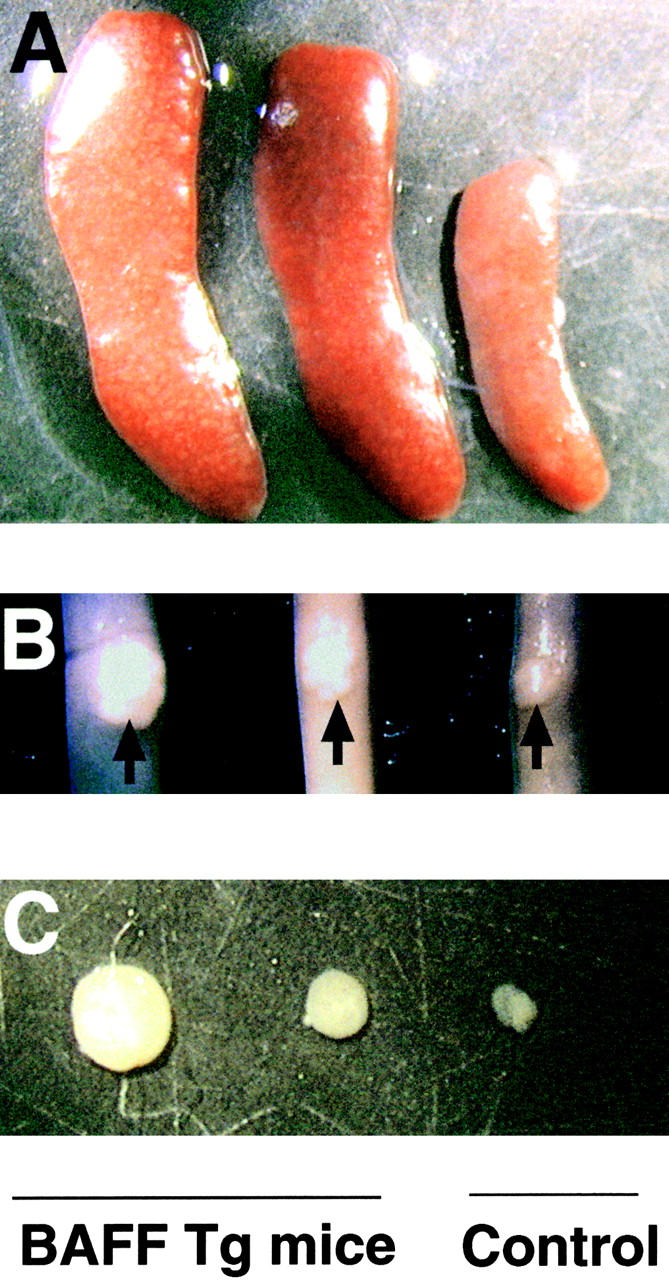
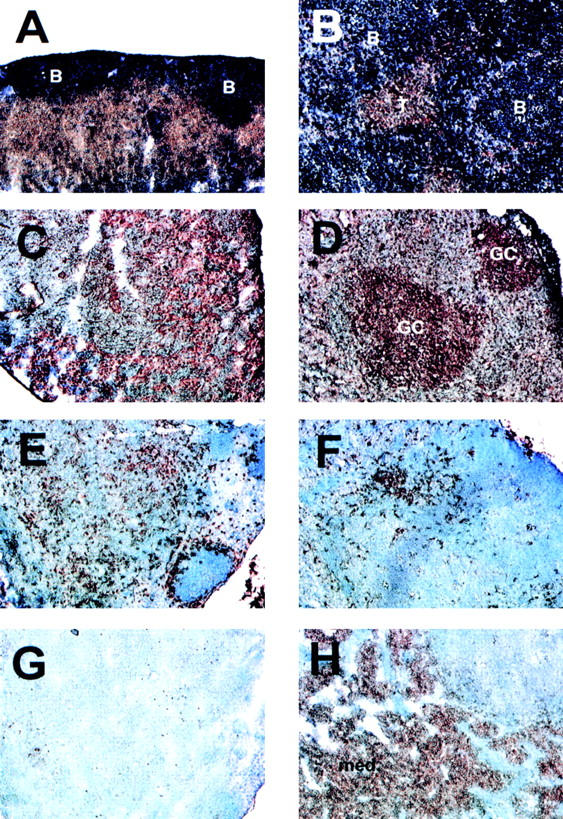
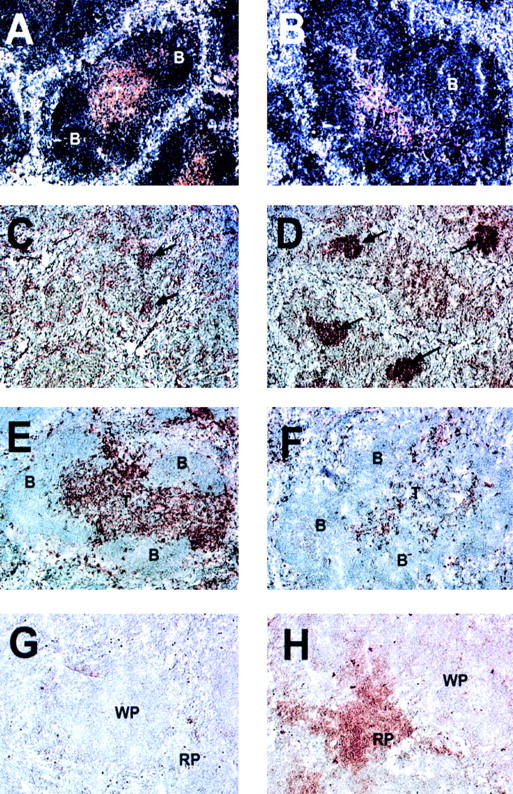
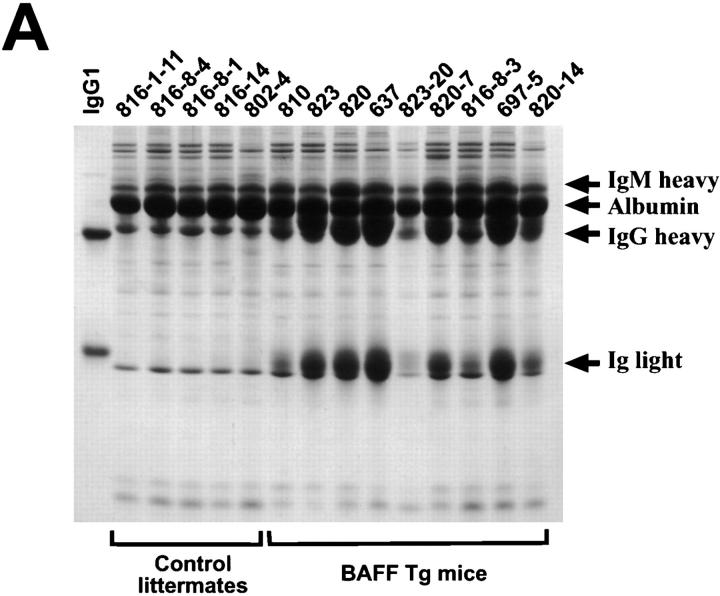
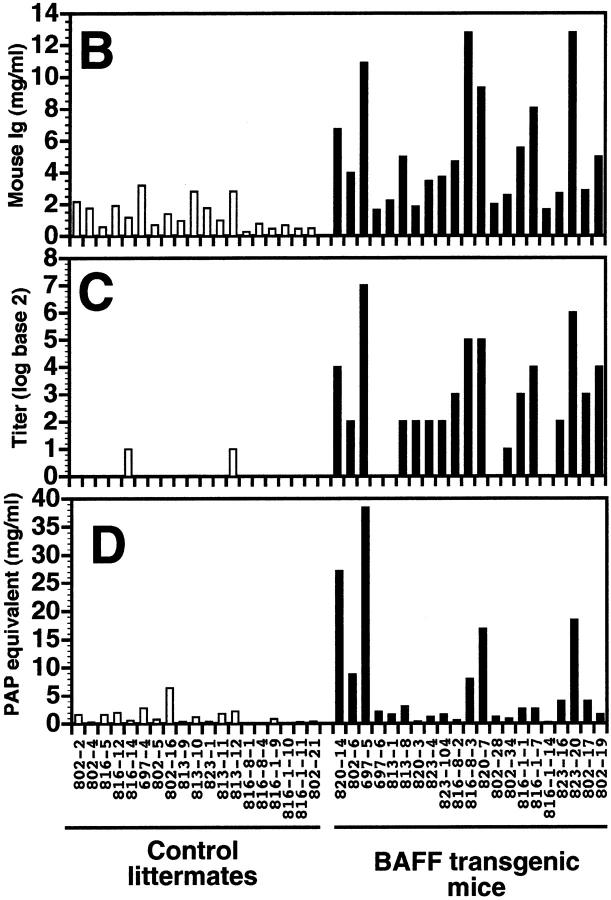
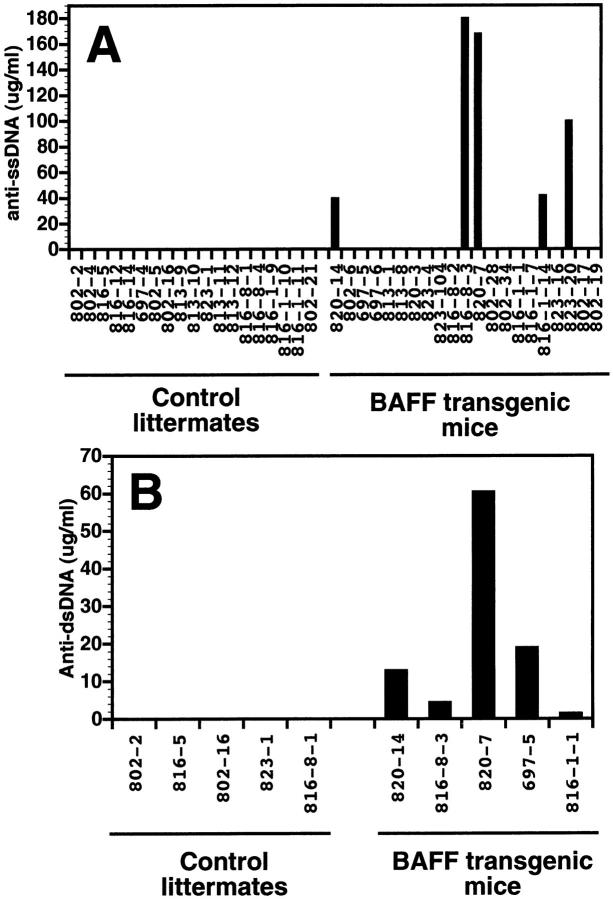
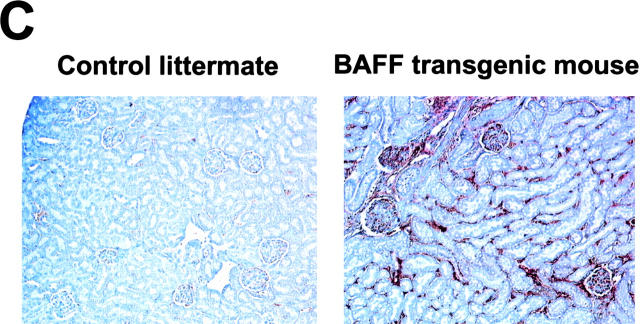
The cause of many autoimmune and inflammatory diseases is unresolved, although dysregulated production of tumor necrosis factor (TNF) family members appears to be important in many cases. BAFF, a new member of the TNF family, binds to B cells and costimulates their growth in vitro. Mice transgenic for BAFF have vastly increased numbers of mature B and effector T cells, and develop autoimmune-like manifestations such as the presence of high levels of rheumatoid factors, circulating immune complexes, anti-DNA autoantibodies, and immunoglobulin deposition in the kidneys. This phenotype is reminiscent of certain human autoimmune disorders and suggests that dysregulation of BAFF expression may be a critical element in the chain of events leading to autoimmunity.


Figures

Figure 1
Figure 1
Increased B cell numbers in BAFF-Tg mice. (A) Increased lymphocyte counts in BAFF-Tg mice. The graph compares 12 control littermates (left) with 12 BAFF-Tg mice (right). Lymphocyte counts (○) and granulocytes (including neutrophils, eosinophils, basophils; ⋄) are shown. (B) Increased proportion of B cells in PBL from BAFF-Tg mice. PBL were stained with both anti–B220-FITC and anti–CD4-PE for FACS® analysis and gated on live cells using the forward and side scatter profile. Percentages of CD4- and B220-positive cells are indicated. One control mouse (left) and two BAFF-Tg mice (right) are shown and the results were representative of seven animals analyzed in each group. (C) FACS® analysis of the ratio of B to T cells in PBL. The difference between control animals and BAFF-Tg mice in A and C was statistically significant (P < 0.001). (D) Increased MHC class II expression on B cells from BAFF-Tg mice PBL. MHC class II expression was analyzed by FACS®. (E) Increased Bcl-2 expression in B cells from BAFF-Tg mice PBL. Bcl-2 expression was measured by intracytoplasmic staining and cells were analyzed by FACS®. In both D and E, B220-positive cells were gated. Four control littermates (white bars) and four BAFF-Tg mice are shown and are representative of at least 12 animals analyzed for each group. MFI, mean of fluorescence intensity. The dotted line represents the average MFI for the control animals. The difference between control animals and BAFF-Tg mice was statistically significant (P < 0.005). (F) Increased expression of effector T cells in BAFF-Tg mice. PBL were stained with anti–CD4-CyChrome™, anti–CD44-FITC and anti–l-selectin-PE. Shown are CD4+-gated cells. Percentages of CD44hi/l-selectinlo cells are indicated. One control mouse (left) and two BAFF-Tg mice (right) are shown and the results were representative of eight animals analyzed in each group.
Figure 1
Figure 1
Increased B cell numbers in BAFF-Tg mice. (A) Increased lymphocyte counts in BAFF-Tg mice. The graph compares 12 control littermates (left) with 12 BAFF-Tg mice (right). Lymphocyte counts (○) and granulocytes (including neutrophils, eosinophils, basophils; ⋄) are shown. (B) Increased proportion of B cells in PBL from BAFF-Tg mice. PBL were stained with both anti–B220-FITC and anti–CD4-PE for FACS® analysis and gated on live cells using the forward and side scatter profile. Percentages of CD4- and B220-positive cells are indicated. One control mouse (left) and two BAFF-Tg mice (right) are shown and the results were representative of seven animals analyzed in each group. (C) FACS® analysis of the ratio of B to T cells in PBL. The difference between control animals and BAFF-Tg mice in A and C was statistically significant (P < 0.001). (D) Increased MHC class II expression on B cells from BAFF-Tg mice PBL. MHC class II expression was analyzed by FACS®. (E) Increased Bcl-2 expression in B cells from BAFF-Tg mice PBL. Bcl-2 expression was measured by intracytoplasmic staining and cells were analyzed by FACS®. In both D and E, B220-positive cells were gated. Four control littermates (white bars) and four BAFF-Tg mice are shown and are representative of at least 12 animals analyzed for each group. MFI, mean of fluorescence intensity. The dotted line represents the average MFI for the control animals. The difference between control animals and BAFF-Tg mice was statistically significant (P < 0.005). (F) Increased expression of effector T cells in BAFF-Tg mice. PBL were stained with anti–CD4-CyChrome™, anti–CD44-FITC and anti–l-selectin-PE. Shown are CD4+-gated cells. Percentages of CD44hi/l-selectinlo cells are indicated. One control mouse (left) and two BAFF-Tg mice (right) are shown and the results were representative of eight animals analyzed in each group.
Figure 2
Figure 2
Increased proportion of B cells in the spleen, MLN, but not in the bone marrow of BAFF-Tg mice. (A) FACS® staining for mature B cells using both anti–IgM-FITC and anti–B220-PE, in spleen (top), bone marrow (middle), and MLN (bottom). Percentages of B220+/IgM+ mature B cells are indicated. (B) FACS® staining for pre–B cells (B220+/CD43) and pro–B cells (B220+/CD43+) in the bone marrow using anti–CD43-FITC, anti–B220-CyChrome™, and anti–IgM-PE simultaneously. Shown are cells gated on the IgM negative population. Percentages of pre–B cells (B220+/CD43) and pro–B cells (B220+/CD43+) are indicated. For all panels (A and B), one control mouse (left) and two BAFF-Tg mice (right) are shown and results are representative of seven animals analyzed for each group.
Figure 2
Figure 2
Increased proportion of B cells in the spleen, MLN, but not in the bone marrow of BAFF-Tg mice. (A) FACS® staining for mature B cells using both anti–IgM-FITC and anti–B220-PE, in spleen (top), bone marrow (middle), and MLN (bottom). Percentages of B220+/IgM+ mature B cells are indicated. (B) FACS® staining for pre–B cells (B220+/CD43) and pro–B cells (B220+/CD43+) in the bone marrow using anti–CD43-FITC, anti–B220-CyChrome™, and anti–IgM-PE simultaneously. Shown are cells gated on the IgM negative population. Percentages of pre–B cells (B220+/CD43) and pro–B cells (B220+/CD43+) are indicated. For all panels (A and B), one control mouse (left) and two BAFF-Tg mice (right) are shown and results are representative of seven animals analyzed for each group.
Figure 3
Figure 3
Enlarged spleen, Peyer's patches, and lymph nodes in BAFF-Tg mice. Photograph of (A) spleen, (B) Peyer's patches (indicated with an arrow) on the small intestine, and (C) inguinal lymph nodes of a control mouse (right) and two BAFF-Tg mice (left). Pictures (5×) are representative of at least 12 mice killed for each group.
Figure 5
Figure 5
Disrupted T and B cell organization, intense germinal center reactions, and large numbers of plasma cells in the MLN of BAFF-Tg mice. The control mouse is shown in A, C, E, and G and the BAFF-Tg mouse is shown in B, D, F, and H. The immunohistochemistry was performed as described in Fig. 6. T and B cell staining is shown in A and B, germinal centers in C and D, dendritic cells in E and F, and plasma cells in G and H. The background is slightly more intense in C, but no germinal centers were detectable. GC, germinal center. Original magnifications: ×100.
Figure 4
Figure 4
Altered T and B cell organization, intense germinal center reactions, decreased number of dendritic cells, and increased number of plasma cells in the spleen of BAFF-Tg mice. A control mouse is shown in A, C, E, and G and a BAFF-Tg mouse in B, D, F, and H. B cells are blue and T cells brown (A and B). Germinal centers are marked with an arrow (C and D). Only a few residual germinal centers are seen in control mice (C). CD11c-positive dendritic cells are brown and appear in the T cell zone, bridging channels and the marginal zone (E). Very few are present in BAFF-Tg mice (F). Syndecan-1–positive plasma cells were only detectable in the red pulp of BAFF-Tg mice (H) but not control mice (G). These pictures are representative of at least 12 BAFF-Tg mice analyzed and 12 control mice. 100× except C and D (50×). B, B cell follicle; T, periarteriolar lymphocyte sheath; WP, white pulp; RP, red pulp.
Figure 6
Figure 6
Increased Ig, RF, and CIC levels in BAFF-Tg mice. (A) Reduced SDS-PAGE of sera from five control littermates and nine BAFF-Tg mice showing that BAFF increases IgG levels. For comparison, mouse IgG1 (MOPC-21) was included as a standard: loading per lane was 5 μg of MOPC-21 and 0.5 μl of the serum. The sharp band slightly below the Ig light chain is not an immunoglobulin and the IgM heavy chain comigrates with transferrin. ELISA-based analysis of total mouse Ig (B), RF (C), and CIC (D) in the sera of 19 control littermates (white bars) and 21 BAFF-Tg mice (black bars). The titer (log base 2) for RF is defined as the dilution of the sera giving an OD three times higher than that of background. The quantity of CIC is defined as the quantity of peroxidase-mouse antiperoxidase required to generate an OD equivalent to that obtained with the tested serum. The difference between control animals and BAFF-Tg mice was statistically significant (P < 0.001 in B and C, P < 0.003 in D).
Figure 6
Figure 6
Increased Ig, RF, and CIC levels in BAFF-Tg mice. (A) Reduced SDS-PAGE of sera from five control littermates and nine BAFF-Tg mice showing that BAFF increases IgG levels. For comparison, mouse IgG1 (MOPC-21) was included as a standard: loading per lane was 5 μg of MOPC-21 and 0.5 μl of the serum. The sharp band slightly below the Ig light chain is not an immunoglobulin and the IgM heavy chain comigrates with transferrin. ELISA-based analysis of total mouse Ig (B), RF (C), and CIC (D) in the sera of 19 control littermates (white bars) and 21 BAFF-Tg mice (black bars). The titer (log base 2) for RF is defined as the dilution of the sera giving an OD three times higher than that of background. The quantity of CIC is defined as the quantity of peroxidase-mouse antiperoxidase required to generate an OD equivalent to that obtained with the tested serum. The difference between control animals and BAFF-Tg mice was statistically significant (P < 0.001 in B and C, P < 0.003 in D).
Figure 7
Figure 7
Presence of anti–ssDNA and –dsDNA autoantibodies in some BAFF-Tg mice, and Ig deposition in the kidneys. (A) Analysis by ELISA of anti–ssDNA autoantibodies in 19 control littermates (left) and 21 BAFF-Tg mice (black bars). (B) Analysis by ELISA of anti–ssDNA autoantibodies in five control littermates and the five animals showing levels of anti–ssDNA autoantibodies from A (black bars). (C) Paraffin sections of kidneys from a control mouse (left) and a BAFF-Tg mouse (right), stained with goat anti–mouse Ig HRP. Ig deposition is shown by a brown staining. These pictures are representative of six BAFF-Tg mice analyzed. Original magnifications.
Figure 7
Figure 7
Presence of anti–ssDNA and –dsDNA autoantibodies in some BAFF-Tg mice, and Ig deposition in the kidneys. (A) Analysis by ELISA of anti–ssDNA autoantibodies in 19 control littermates (left) and 21 BAFF-Tg mice (black bars). (B) Analysis by ELISA of anti–ssDNA autoantibodies in five control littermates and the five animals showing levels of anti–ssDNA autoantibodies from A (black bars). (C) Paraffin sections of kidneys from a control mouse (left) and a BAFF-Tg mouse (right), stained with goat anti–mouse Ig HRP. Ig deposition is shown by a brown staining. These pictures are representative of six BAFF-Tg mice analyzed. Original magnifications.

Similar articles

Cited by

References

    1. Goodnow C.C., Cyster J.G., Hartley S.B., Bell S.E., Cooke M.P., Healy J.I., Akkaraju S., Rathmell J.C., Pogue S.L., Shokat K.P. Self-tolerance check points in B cell development. Adv. Immunol. 1995;59:279–369. - PubMed
    1. Miller J.F., Basten A. Mechanisms of tolerance to self. Curr. Opin. Immunol. 1996;8:815–821. - PubMed
    1. McDevitt H.O., Wakeland E.K. Autoimmunity. Curr. Opin. Immunol. 1998;10:647–648. - PubMed
    1. Rose N.R. The role of infection in the pathogenesis of autoimmune disease. Semin. Immunol. 1998;10:5–13. - PubMed
    1. Fox D. The role of T cells in the immunopathogenesis of rheumatoid arthritis. Arthritis Rheum. 1997;40:598–609. - PubMed

MeSH terms