. 1999 Dec;104(11):1549-57.
doi: 10.1172/JCI7707.

Lack of chemokine receptor CCR1 enhances Th1 responses and glomerular injury during nephrotoxic nephritis

Affiliations

Lack of chemokine receptor CCR1 enhances Th1 responses and glomerular injury during nephrotoxic nephritis

P S Topham et al. J Clin Invest. 1999 Dec.

Abstract

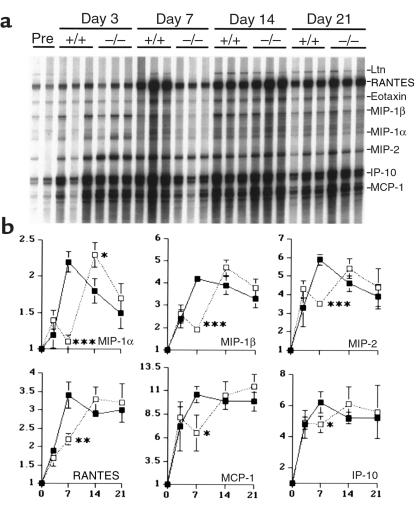
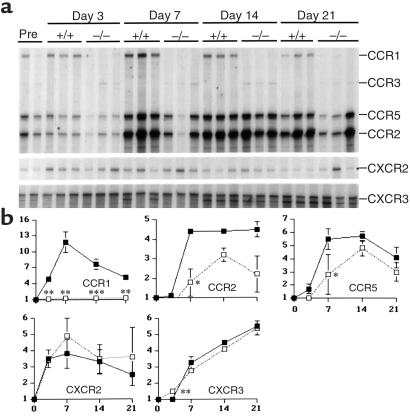
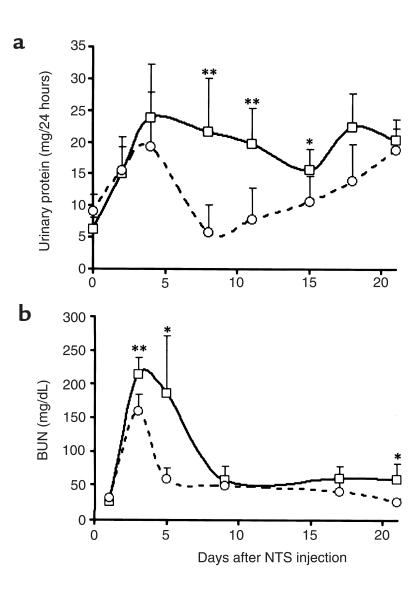
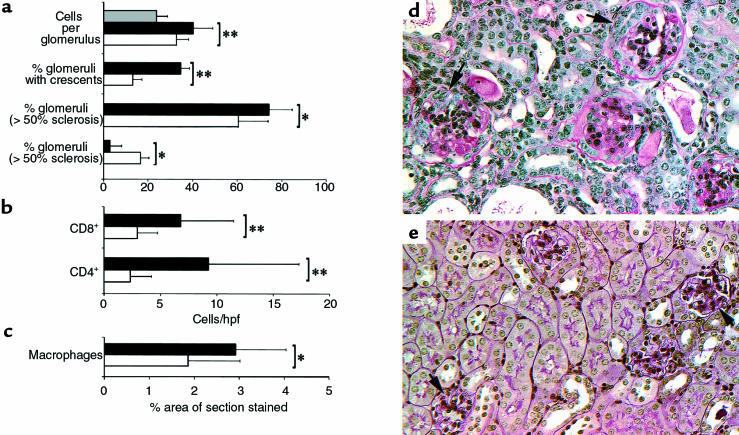
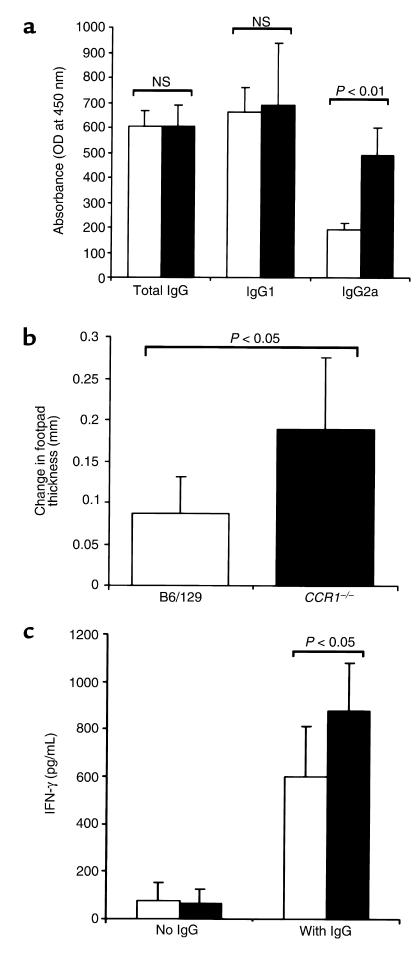
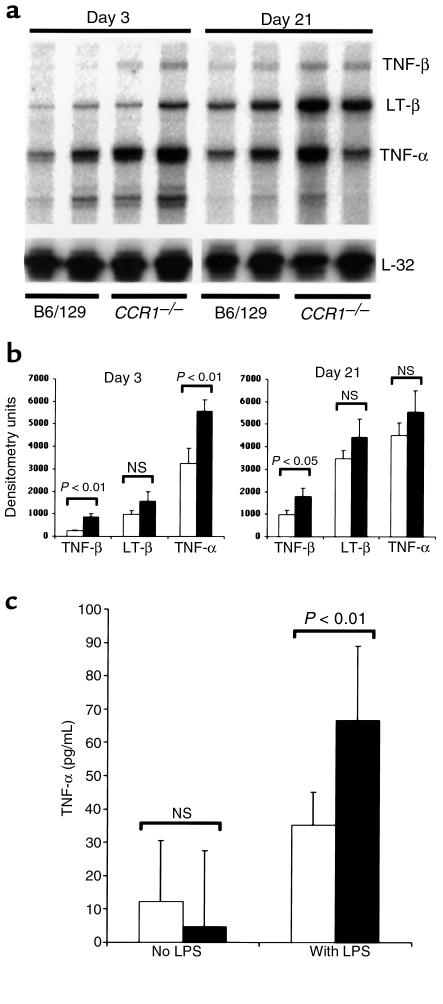
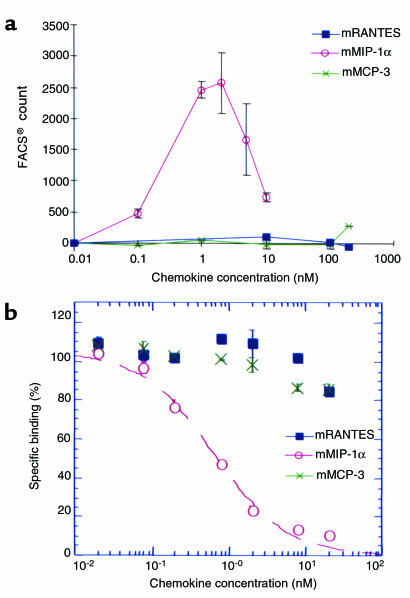
During the development of nephrotoxic nephritis (NTN) in the mouse, we find that a variety of chemokines and chemokine receptors are induced: CCR1 (RANTES, MIP-1alpha), CCR2 (MCP-1), CCR5 (RANTES, MIP-1alpha, MIP-1beta), CXCR2 (MIP-2), and CXCR3 (IP-10). Their timing of expression indicated that CXCR2 and CCR1 are probably important in the neutrophil-dependent heterologous phase of the disease, whereas CCR1, CCR2, CCR5, and CXCR3 accompany the subsequent mononuclear cell infiltration characteristic of autologous disease. We therefore assessed the role of CCR1 in NTN using CCR1(-/-) mice. We found that neutrophil accumulation in CCR1(-/-) mice was comparable to that in wild-type animals but that renal recruitment of CD4(+) and CD8(+) T cells and macrophages increased significantly. Moreover, CCR1(-/-) mice developed more severe glomerulonephritis than did controls, with greater proteinuria and blood urea nitrogen, as well as a higher frequency of crescent formation. In addition, CCR1(-/-) mice showed enhanced Th1 immune responses, including titers of antigen-specific IgG2a antibody, delayed-type hypersensitivity responses, and production of IFN-gamma and TNF-alpha. Lastly, using recombinant proteins and transfected cells that overexpressed CCR1, we demonstrated that MIP-1alpha, but not RANTES, bound CCR1 and induced cell chemotaxis. Thus, rather than simply promoting leukocyte recruitment during NTN, CCR1 expression profoundly alters the effector phase of glomerulonephritis. Therapeutic targeting of chemokine receptors may, on occasion, exacerbate underlying disease.


Figures

Figure 1
Figure 1
(a) Ribonuclease protection assay of serial renal chemokine expression in mice after NTS injection. RNA from 3 representative mice/group per timepoint were included (except for the 2 pre-NTS samples [Pre], the first of which is from a CCR1+/+ mouse and the second from a CCR1–/– mouse); the ribosomal component L32 served as a control for RNA loading. (b) The line graphs show densitometric analysis of chemokine mRNA expression after normalization to expression of the housekeeping genes L32 and GAPDH. Results are expressed as fold increase over baseline expression (mean ± SD), with statistically significant differences between CCR1+/+ mice (filled squares) and CCR1–/– mice (open squares) evaluated by Student’s t test. *P < 0.05, **P < 0.01, ***P < 0.001.
Figure 2
Figure 2
(a) Ribonuclease protection assay of serial renal chemokine receptor expression in mice after NTS injection. RNA from 3 representative mice/group per timepoint were included (except for the 2 pre-NTS samples, the first of which is from a CCR1+/+ mouse and the second from a CCR1–/– mouse); the ribosomal component L32 served as a control for RNA loading. (b) The line graphs show densitometric analysis of chemokine receptor mRNA expression after normalization to expression of the housekeeping genes L32 and GAPDH. Results are expressed as fold increase over baseline expression (mean ± SD), with statistically significant differences between CCR1+/+ mice (black squares) and CCR1–/– mice (open squares) evaluated by Student’s t test. *P < 0.05, **P < 0.01, ***P < 0.001.
Figure 3
Figure 3
CCR1–/– mice show greater renal injury than do CCR1+/+ mice. Renal dysfunction in mice was assessed by (a) urinary protein excretion and (b) blood urea nitrogen (BUN) concentration in CCR1+/+ mice (open circles) and CCR1–/– mice (open squares); mean ± SD values for 12 animals/timepoint per group. Results of Student’s t test for differences between the 2 groups at a corresponding timepoint: *P < 0.05, **P < 0.01.
Figure 4
Figure 4
CCR1–/– mice show greater histologic injury than do CCR1+/+ mice, as reflected by quantitative assessment of (a) numbers of glomerular cells, crescent formation, glomerulosclerosis, and (b) T-cell and (c) macrophage accumulation in nephritic CCR1+/+ mice (open bars) vs. nephritic CCR1–/– mice (solid bars) and normal CCR1+/+ mice (gray bars). Assessment (as detailed in Methods) was performed 21 days after NTS injection, using 8 mice per group; results of analysis by Student’s t test are presented as mean ± SD. *P < 0.05; **P < 0.01 for nephritic CCR1–/– mice vs. nephritic CCR1+/+ mice. (d and e) Representative histopathology of kidneys (8/group) harvested at day 21 after NTS from CCR1–/– and CCR1+/+ mice. (d) In CCR1–/– mice, most glomeruli showed extensive glomerulosclerosis and crescent formation (arrows), whereas CCR+/+ mice (e) typically showed considerably less glomerulosclerosis (arrows) and infrequent crescent formation. Paraffin sections, periodic acid–Schiff reagent counterstain, ×400.
Figure 5
Figure 5
CCR1–/– mice display Th1 antigen–specific immune responses. (a) Circulating titers of mouse anti-sheep IgG, IgG1, and IgG2a isotypes at 10 days after NTS injection were measured by ELISA in nephritic CCR1–/– and CCR1+/+ mice. Serum dilutions were 1:200 for total IgG, 1:100 for IgG1, and 1:20 for IgG2a; results are presented as mean ± SD of 6 animals/group as analyzed by Student’s t test. NS, not significant. (b) Antigen-specific DTH responses were assessed in nephritic CCR1+/+ and CCR1–/– mice (n = 10/group) by injecting the hind-limb footpad with either 100 μg sheep IgG or PBS and measuring footpad swelling after 48 hours; results are presented as mean ± SD of the difference in footpad thickness between the 2 treatments, analyzed by Student’s t test. (c) Antigen-specific production of IFN-γ by T cell–enriched splenocytes from nephritic CCR1+/+ and CCR1–/– mice (n = 10/group) after 72 hours of culture in the presence or absence of 20 μg/mL sheep IgG. IFN-γ was measured by ELISA; results are presented as mean ± SD.
Figure 6
Figure 6
CCR1–/– mice show enhanced mononuclear cell production of TNF-α. (a) Ribonuclease protection assay of renal expression of TNF-α, TNF-β, and lymphotoxin-β (LT-β) in nephritic CCR1–/– vs. nephritic CCR1+/+ mice at 3 days and 21 days after NTS injection. RNA loading was normalized relative to L32 gene expression. (b) Densitometric analysis of TNF gene family members after data were normalized to L32 and GAPDH expression; results are presented as mean ± SD values for 3 mice/group per timepoint (analyzed by Student’s t test). (c) TNF-α production from splenic mononuclear cells in response to LPS. Cells were isolated from CCR1+/+ and CCR1–/– mice and cultured for 3 hours; supernatants were assayed by ELISA. Results are presented as mean ± SD, with 4 mice/group.
Figure 7
Figure 7
MIP-1α is the major functional ligand of CCR1 in the mouse, as shown by comparison with murine RANTES and MCP-3. (a) Representative experiment (performed 4 times) showing the chemotactic response of murine CCR1-transfected L1/2 cells to mouse MIP-1α (filled squares) but not mouse RANTES or MCP-3. The latter chemokines were active as shown in control studies with mouse CCR5 and CCR3 transfectants, respectively (not shown). Transfectants were exposed to increasing doses of chemokine, and the chemotactic response was assessed by flow cytometric counting of CCR1+ cells in the lower well of the chemotaxis chamber. (b) Competitive binding assays showing that mouse MIP-1α, but not mouse RANTES or MCP-3, was able to competitively inhibit binding of radiolabeled human MIP-α to murine CCR1-transfected L1/2 cells (experiment performed 3 times). Results are presented as mean ± SD.

Similar articles

Cited by

References

    1. Schreiner GF. The role of the macrophage in glomerular injury. Semin Nephrol. 1991;11:268–275. - PubMed
    1. Tipping PG, Huang XR, Qi M, Van GY, Tang WW. Crescentic glomerulonephritis in CD4- and CD8-deficient mice. Requirement for CD4 but not CD8 cells. Am J Pathol. 1998;152:1541–1548. - PMC - PubMed
    1. Rovin BH, Phan LT. Chemotactic factors and renal inflammation. Am J Kidney Dis. 1998;31:1065–1084. - PubMed
    1. Rovin BH, Rumancik M, Tan L, Dickerson J. Glomerular expression of monocyte chemoattractant protein-1 in experimental and human glomerulonephritis. Lab Invest. 1994;71:536–542. - PubMed
    1. Tam FW, et al. Differential expression of macrophage inflammatory protein-2 and monocyte chemoattractant protein-1 in experimental glomerulonephritis. Kidney Int. 1996;49:715–721. - PubMed

Publication types

MeSH terms