. 1999 Dec;10(12):4403-17.
doi: 10.1091/mbc.10.12.4403.

The dynamin-like protein DLP1 is essential for normal distribution and morphology of the endoplasmic reticulum and mitochondria in mammalian cells

Affiliations
Free PMC article

The dynamin-like protein DLP1 is essential for normal distribution and morphology of the endoplasmic reticulum and mitochondria in mammalian cells

K R Pitts et al. Mol Biol Cell. 1999 Dec.
Free PMC article

Abstract

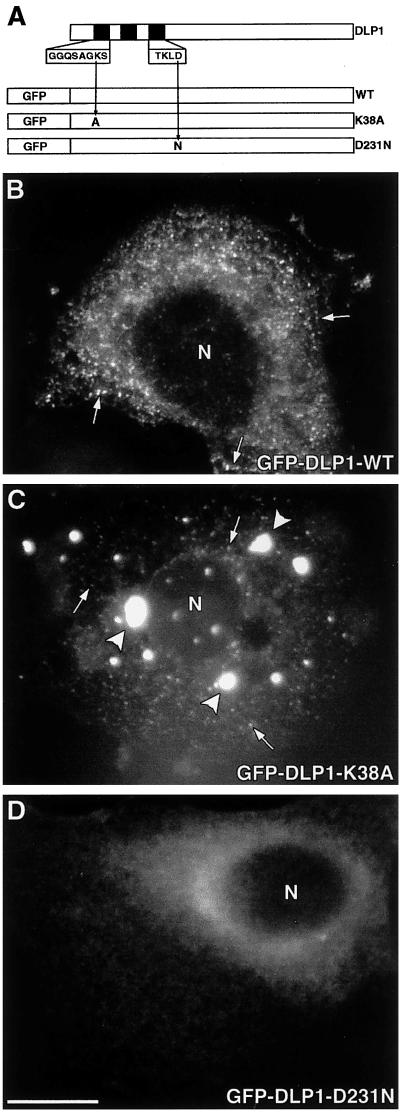
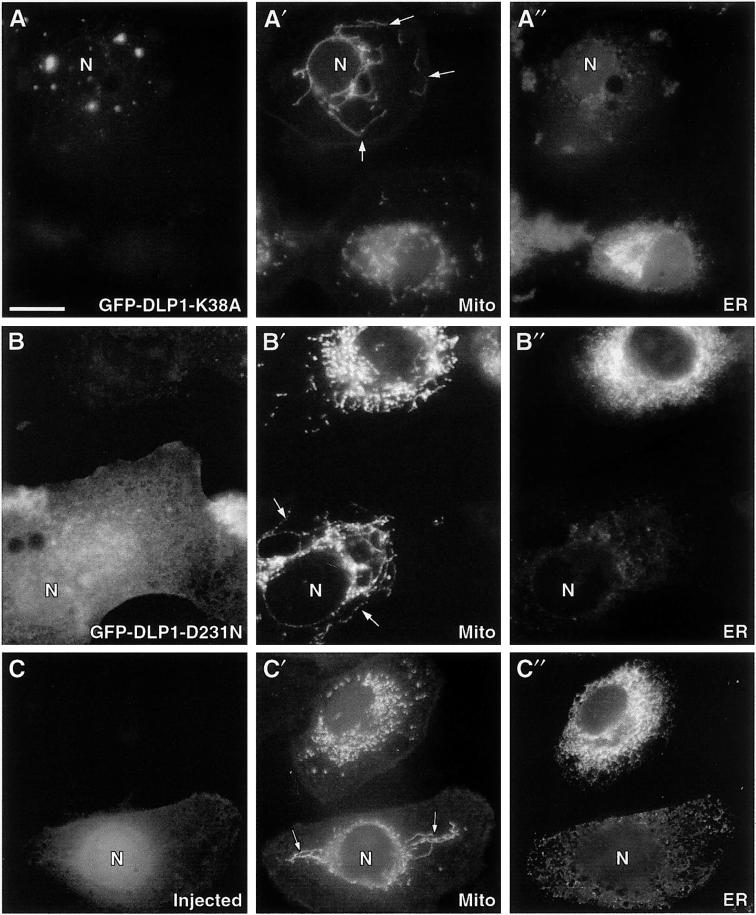
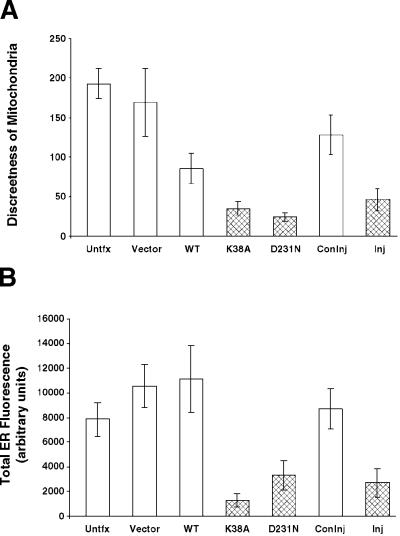
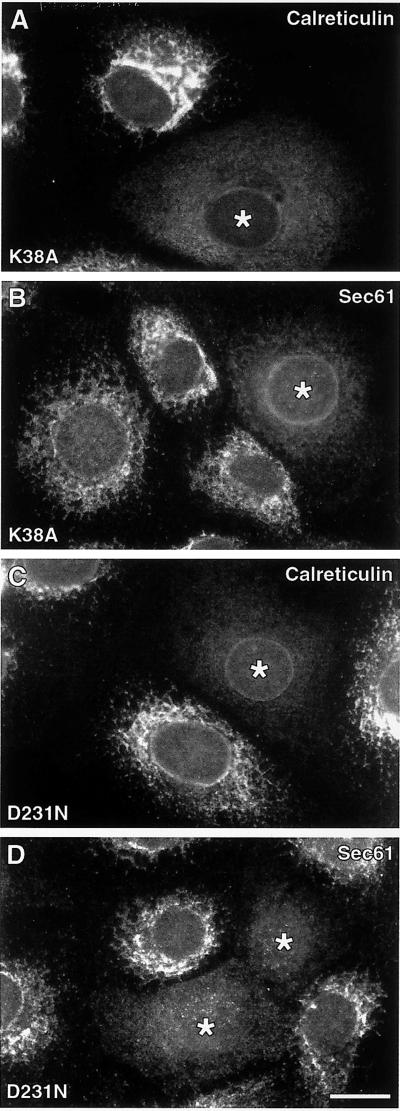
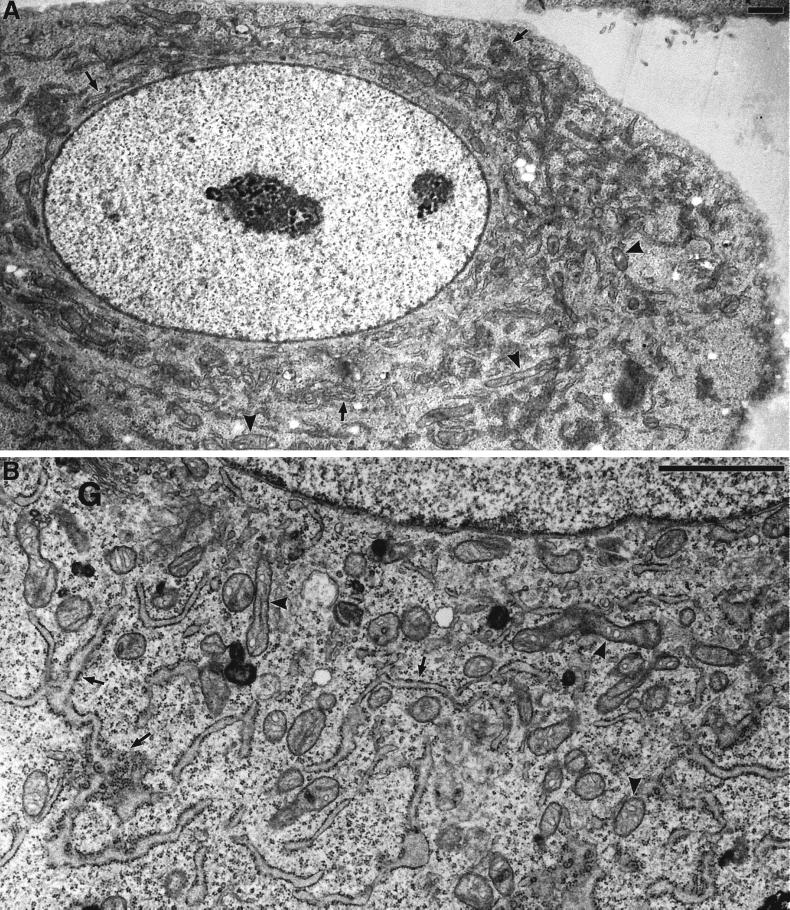
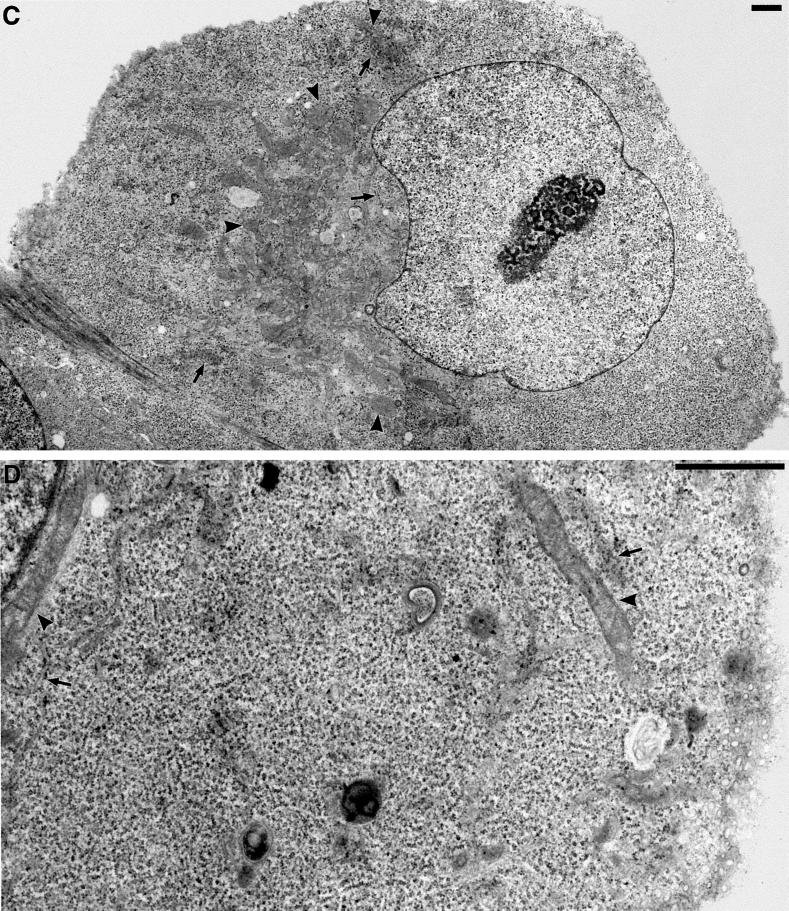
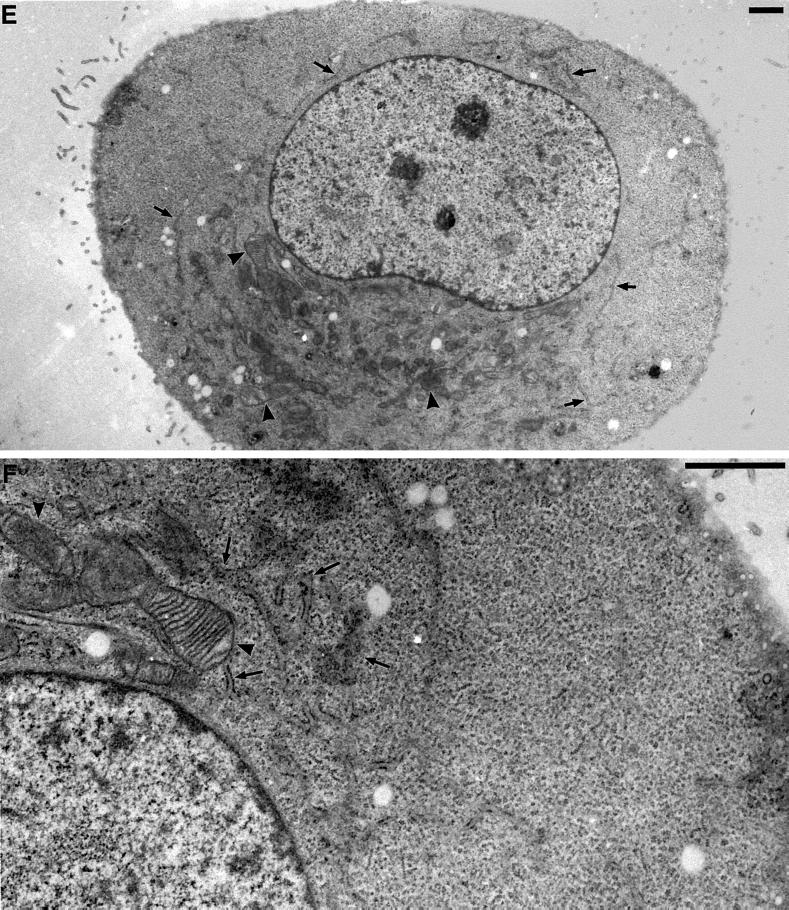
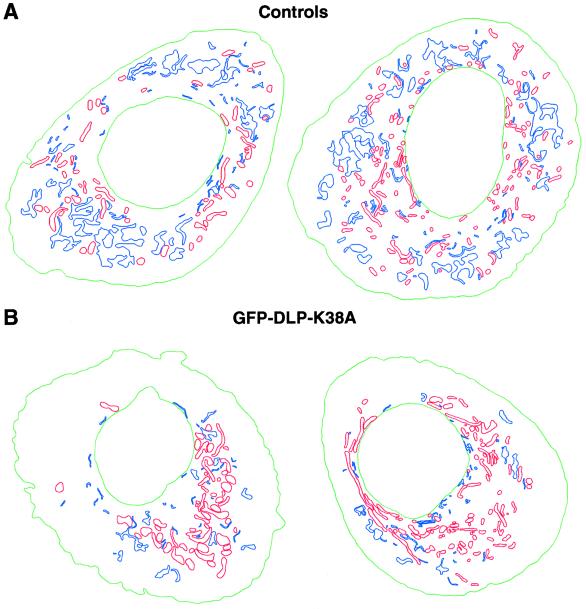
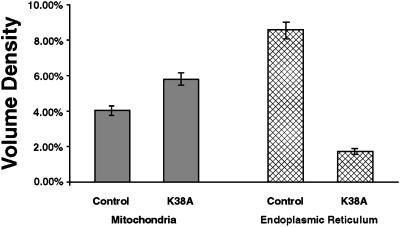
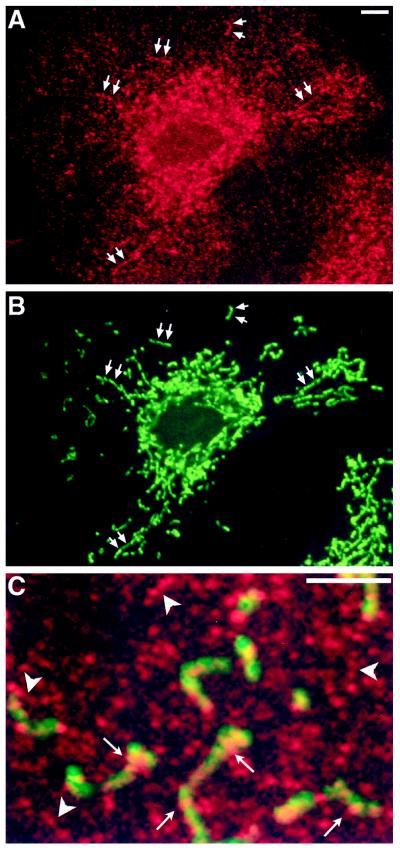
The dynamin family of large GTPases has been implicated in vesicle formation from both the plasma membrane and various intracellular membrane compartments. The dynamin-like protein DLP1, recently identified in mammalian tissues, has been shown to be more closely related to the yeast dynamin proteins Vps1p and Dnm1p (42%) than to the mammalian dynamins (37%). Furthermore, DLP1 has been shown to associate with punctate vesicles that are in intimate contact with microtubules and the endoplasmic reticulum (ER) in mammalian cells. To define the function of DLP1, we have transiently expressed both wild-type and two mutant DLP1 proteins, tagged with green fluorescent protein, in cultured mammalian cells. Point mutations in the GTP-binding domain of DLP1 (K38A and D231N) dramatically changed its intracellular distribution from punctate vesicular structures to either an aggregated or a diffuse pattern. Strikingly, cells expressing DLP1 mutants or microinjected with DLP1 antibodies showed a marked reduction in ER fluorescence and a significant aggregation and tubulation of mitochondria by immunofluorescence microscopy. Consistent with these observations, electron microscopy of DLP1 mutant cells revealed a striking and quantitative change in the distribution and morphology of mitochondria and the ER. These data support very recent studies by other authors implicating DLP1 in the maintenance of mitochondrial morphology in both yeast and mammalian cells. Furthermore, this study provides the first evidence that a dynamin family member participates in the maintenance and distribution of the ER. How DLP1 might participate in the biogenesis of two presumably distinct organelle systems is discussed.


Figures

Figure 1
Figure 1
GFP-tagged WT, K38A, and D231N show different localizations. (A) Diagram of full-length, untagged DLP1 with the N-terminal GTP-binding elements represented as black boxes. The amino acid sequences for the first and third elements are enlarged, and the GFP tag is situated at the N-terminal end of each construct. WT indicates wild-type GFP-DLP1, and the GFP-tagged point mutants are referred to as K38A and D231N. When transiently expressed in Clone 9 cells, these proteins show markedly distinct cellular distributions. WT DLP1 distributes to punctate vesicle-like structures (B, arrows) similar to the distribution described for endogenous DLP1. In contrast, K38A (C) accumulates into large aggregates (arrowheads) and also smaller punctate foci (arrows) similar to those observed in the WT cells. D231N exhibits a diffuse cytosolic distribution (D), suggesting a loss of membrane targeting. N, nucleus. Bar, 10 μm.
Figure 2
Figure 2
DLP1 mutants do not affect endocytosis. Clone 9 cells expressing GFP vector alone, WT, K38A, or D231N were incubated with Texas Red–conjugated dextran or DiI-LDL, fixed, and observed by fluorescence microscopy. Cells containing fluorescent marker in the cytoplasm were counted positive for marker uptake. Quantitation of transfected cells reveals that DLP1 mutants do not affect the endocytosis of dextran (white bars) or LDL (gray bars) relative to cells expressing GFP vector alone. Time-course experiments in transfected cells with the use of Alexa-conjugated transferrin showed that DLP1 mutant–expressing cells were indistinguishable from untransfected cells at 2, 5, 10, or 20 min (our unpublished results). Data are expressed as percentage uptake normalized to cells expressing GFP vector alone.
Figure 3
Figure 3
Inhibition of DLP1 function induces aberrant mitochondrial and ER phenotypes. Cells transfected with GFP-DLP1-K38A or GFP-DLP1-D231N or microinjected with inhibitory DLP1 antibodies were immunostained with antibodies to mitochondria (dihydrolipoamide acetyltransferase) and ER (PDI). (A) Cells expressing K38A show a reduction in uniform punctate DLP1 structures and the appearance of large aggregates. In the same cells, mitochondria appear to collapse toward the cell center, forming long tubules encircling the nucleus (A′, arrows) and losing the discrete size and shape observed in adjacent untransfected control cells. ER staining in these mutant cells is markedly reduced compared with that in adjacent untransfected control cells (A"). (B) Cells expressing D231N show a diffuse and markedly different distribution from cells expressing K38A or endogenous DLP1. Despite the difference in the distribution of the mutant D231N protein, these cells display the same aberrant mitochondrial (B′, arrows) and ER (B") phenotypes found in K38A-expressing cells. (C) A cell injected with DLP1 antibodies. The lower cell displays Cascade Blue–conjugated dextran concentrated in the nucleus and peripheral cytoplasm, confirming a successful injection. Mitochondrial staining in the same injected cell shows long tubular structures (C′, arrows) collapsed about the nucleus, similar to the aberrant mitochondria observed in the mutant cells. Note the collapse of the ER about the nucleus (C") and the reduced staining intensity, as in the mutant cells. N, nucleus of transfected or injected cells. Bar, 10 μm.
Figure 4
Figure 4
Quantitation of altered mitochondrial and ER phenotypes in DLP1 mutant–expressing cells or DLP1 antibody–injected cells. (A) The mitochondrial phenotype was quantitated by generating objects that correspond to mitochondrial discreteness (see MATERIALS AND METHODS). These objects were counted, and the data are expressed as the mean number of mitochondria ± 95% confidence intervals. In mutant cells (stippled bars), there are fewer discrete mitochondria than in control cells (white bars). Cells injected with inhibitory DLP1 antibodies (Inj, stippled bar) show a similarly decreased value compared with control injected cells (Coninj, white bar). (B) The ER phenotype was quantitated by measuring the total cytoplasmic fluorescence of cells stained for the ER (see MATERIALS AND METHODS). In mutant cells (stippled bars), a marked reduction in total ER fluorescence is observed compared with control cells (white bars). Cells injected with inhibitory DLP1 antibodies (Inj, stippled bar) show a similar reduction compared with control injected cells (Coninj, white bar). Data were collected from cells either 16 h after transfection or 8 h after injection.
Figure 5
Figure 5
Cells expressing DLP1 mutant proteins exhibit ER abnormalities assessed by multiple ER markers. Cells transfected and expressing either untagged DLP1-K38A (A and B) or GFP-DLP1-D231N (C and D) were immunostained with either calreticulin, a soluble ER luminal marker (A and C), or Sec61β, an ER transmembrane protein (B and D). In every case, cells deficient in DLP1 function show a reduction in total ER fluorescence, consistent with the fluorescence quantitation data obtained with DLP1-defective cells stained with PDI, a soluble ER luminal marker (see Figure 4B). Asterisks, mutant-expressing cells. Bar, 10 μm.
Figure 6
Figure 6
Electron microscopy of changes in ER and mitochondrial distribution and morphology in DLP1-defective cells. Selected transmission electron microscopic images from control uninjected cells, cells fixed for 16–24 h after nuclear injection with GFP-DLP1-K38A, or cells injected with inhibitory DLP1 antibodies. In control cells, the cytoplasm is filled with long strands of interconnected rough ER (A, arrows) interspersed with mitochondria of uniform size (A, arrowheads). A higher magnification resolves the normal morphology of these prevalent organelles (B, arrows and arrowheads). In contrast, cells injected with GFP-DLP1-K38A (C and D) or inhibitory DLP1 antibodies (E and F) show mitochondria collapsed to a perinuclear region (C and E, arrowheads). These cells possessed shortened, ill-defined ER profiles close to the nuclear envelope (C and E, arrows) and large cytoplasmic expanses completely devoid of ER (compare A, C, and E). At higher magnification, the ER cisternae appear less defined and in close proximity to mitochondria, and the mitochondria appear swollen, elongated, and branched with highly resolved cristae (D and F, arrowheads). Bars, 1 μm.
Figure 6
Figure 6
Electron microscopy of changes in ER and mitochondrial distribution and morphology in DLP1-defective cells. Selected transmission electron microscopic images from control uninjected cells, cells fixed for 16–24 h after nuclear injection with GFP-DLP1-K38A, or cells injected with inhibitory DLP1 antibodies. In control cells, the cytoplasm is filled with long strands of interconnected rough ER (A, arrows) interspersed with mitochondria of uniform size (A, arrowheads). A higher magnification resolves the normal morphology of these prevalent organelles (B, arrows and arrowheads). In contrast, cells injected with GFP-DLP1-K38A (C and D) or inhibitory DLP1 antibodies (E and F) show mitochondria collapsed to a perinuclear region (C and E, arrowheads). These cells possessed shortened, ill-defined ER profiles close to the nuclear envelope (C and E, arrows) and large cytoplasmic expanses completely devoid of ER (compare A, C, and E). At higher magnification, the ER cisternae appear less defined and in close proximity to mitochondria, and the mitochondria appear swollen, elongated, and branched with highly resolved cristae (D and F, arrowheads). Bars, 1 μm.
Figure 7
Figure 7
Spatial analysis of ER and mitochondrial profiles in control versus GFP-DLP1-K38A–injected cells. Tracings of ER and mitochondria from two control cells or two GFP-DLP1-K38A–expressing cells. (A) Control cells exhibit a uniform distribution of numerous ER profiles (blue) and mitochondria (red). (B) In contrast, cells expressing GFP-DLP1-K38A show a striking reduction in the number of ER profiles (blue) and a marked collapse, swelling, and tubulation of mitochondria (red). Nuclei are shown in green.
Figure 8
Figure 8
Ultrastructural quantitation of ER and mitochondrial phenotypes in GFP-DLP1-K38A–injected cells. ER and mitochondrial profiles were traced as depicted in Figure 7, and total ER and mitochondrial volume densities were calculated for five control and five K38A-expressing cells, as described in MATERIALS AND METHODS. The data are expressed as a percentage of total cell volume density ± SEM. In mutant cells, total mitochondrial volume density (gray bars) increased 43% over control. Strikingly, mutant cells exhibited an 80% decrease in the total ER volume density (stippled bars).
Figure 9
Figure 9
DLP1 localizes along mitochondria. Immunofluorescence double labeling of Clone 9 cells for DLP1 (red) and mitochondria (green) reveals that DLP1-positive structures (A and B, arrows) align along mitochondria. Note that although this structural association is convincing (C, arrows), the majority of DLP1-positive structures are cytoplasmic and arranged in linear arrays (C, arrowheads) where no mitochondria are present. These linear, nonmitochondrial arrays of DLP1 have been shown previously to represent microtubules and ER cisternae. Bar, 2 μm.

References

    1. Cao H, Garcia F, McNiven MA. Differential distribution of dynamin isoforms in mammalian cells. Mol Biol Cell. 1998;9:2595–2609. - PMC - PubMed
    1. Chandra NC, Spiro MJ, Spiro RG. Identification of a glycoprotein from rat liver mitochondrial inner membrane and demonstration of its origin in the endoplasmic reticulum. J Biol Chem. 1998;273:19715–19721. - PubMed
    1. Clanton DJ, Hattori S, Shih TY. Mutations of the ras gene product p21 that abolish guanine nucleotide binding. Proc Natl Acad Sci USA. 1986;83:5076–5080. - PMC - PubMed
    1. Cook TA, Mesa K, Urrutia R. Three dynamin-encoding genes are differentially expressed in developing rat brain. J Neurochem. 1996;67:927–931. - PubMed
    1. Cook TA, Urrutia R, McNiven MA. Identification of dynamin 2, an isoform ubiquitously expressed in rat tissues. Proc Natl Acad Sci USA. 1994;91:644–648. - PMC - PubMed

Publication types

LinkOut - more resources