Imaging of biological macromolecules on mica in humid air by scanning electrochemical microscopy
- PMID: 10588687
- PMCID: PMC24418
- DOI: 10.1073/pnas.96.25.14222
Imaging of biological macromolecules on mica in humid air by scanning electrochemical microscopy
Abstract
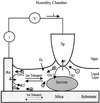
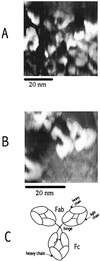
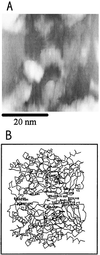
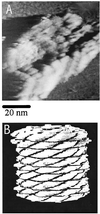
Imaging of DNA, keyhole limpet hemocyanin, mouse monoclonal IgG, and glucose oxidase on a mica substrate has been accomplished by scanning electrochemical microscopy with a tungsten tip. The technique requires the use of a high relative humidity to form a thin film of water on the mica surface that allows electrochemical reactions to take place at the tip and produce a faradaic current (approximately 1 pA) that can be used to control tip position. The effect of relative humidity and surface pretreatment with buffer solutions on the ionic conductivity of a mica surface was investigated to find appropriate conditions for imaging. Resolution of the order of 1 nm was obtained.
Figures


Comment in
-
Varieties of imaging with scanning probe microscopes.Proc Natl Acad Sci U S A. 1999 Dec 21;96(26):14678-80. doi: 10.1073/pnas.96.26.14678. Proc Natl Acad Sci U S A. 1999. PMID: 10611271 Free PMC article. No abstract available.
Similar articles
-
Lateral electrical conductivity of mica-supported lipid bilayer membranes measured by scanning tunneling microscopy.Biophys J. 1995 Aug;69(2):489-97. doi: 10.1016/S0006-3495(95)79922-2. Biophys J. 1995. PMID: 8527663 Free PMC article.
-
Imaging the substructure of antibodies with tapping-mode AFM in air: the importance of a water layer on mica.J Microsc. 2005 Mar;217(Pt 3):193-9. doi: 10.1111/j.1365-2818.2005.01399.x. J Microsc. 2005. PMID: 15725122
-
Mechanism of immonoglobulin G adsorption on mica-AFM and electrokinetic studies.Colloids Surf B Biointerfaces. 2014 Jun 1;118:57-64. doi: 10.1016/j.colsurfb.2014.02.053. Epub 2014 Mar 19. Colloids Surf B Biointerfaces. 2014. PMID: 24727528
-
Humidity effects on atomic force microscopy of gold-labeled DNA on mica.Scanning Microsc. 1993 Sep;7(3):781-8. Scanning Microsc. 1993. PMID: 8146613
-
Deposition of supercoiled DNA on mica for scanning force microscopy imaging.Scanning Microsc. 1996;10(4):953-60; discussion 960-2. Scanning Microsc. 1996. PMID: 9890815 Review.
Cited by
-
Myoglobin immunoassay utilizing directional surface plasmon-coupled emission.Anal Chem. 2004 Nov 1;76(21):6287-92. doi: 10.1021/ac0491612. Anal Chem. 2004. PMID: 15516120 Free PMC article.
-
Real-time mapping of a hydrogen peroxide concentration profile across a polymicrobial bacterial biofilm using scanning electrochemical microscopy.Proc Natl Acad Sci U S A. 2011 Feb 15;108(7):2668-73. doi: 10.1073/pnas.1018391108. Epub 2011 Jan 31. Proc Natl Acad Sci U S A. 2011. PMID: 21282623 Free PMC article.
-
Stabilizing nanometer scale tip-to-substrate gaps in scanning electrochemical microscopy using an isothermal chamber for thermal drift suppression.Anal Chem. 2012 Apr 17;84(8):3489-92. doi: 10.1021/ac300564g. Epub 2012 Apr 5. Anal Chem. 2012. PMID: 22462610 Free PMC article.
-
Insulated conducting cantilevered nanotips and two-chamber recording system for high resolution ion sensing AFM.Sci Rep. 2014 Mar 25;4:4454. doi: 10.1038/srep04454. Sci Rep. 2014. PMID: 24663394 Free PMC article.
-
Electrochemical Sensing and Imaging Based on Ion Transfer at Liquid/Liquid Interfaces.Electrochim Acta. 2013 Nov 1;110:10.1016/j.electacta.2013.03.098. doi: 10.1016/j.electacta.2013.03.098. Electrochim Acta. 2013. PMID: 24363454 Free PMC article.
References
-
- Wickramasinghe H K, editor. Scanned Probe Microscopy, American Institute of Physics Conference Proceedings 241. New York: American Institute of Physics; 1992.
-
- Bard A J, Fan F-R, Mirkin M V. In: Electroanalytical Chemistry. Bard A J, editor. Vol. 18. New York: Dekker; 1994. pp. 243–373.
-
- Guckenberger R, Heim M, Ceve G, Knapp H, Wiegräbe W, Hillebrand A. Science. 1994;266:1538–1540. - PubMed
-
- Fan F-R F, Bard A J. Science. 1995;270:1849–1851. - PubMed
-
- Forouzan F, Bard A J. J Phys Chem. 1997;101:10876–10879.
Publication types
MeSH terms
Substances
LinkOut - more resources
Full Text Sources

