. 2000 Jan;74(1):390-400.
doi: 10.1128/jvi.74.1.390-400.2000.

Correlation between point mutations in NS2 and the viability and cytopathogenicity of Bovine viral diarrhea virus strain Oregon analyzed with an infectious cDNA clone

Affiliations

Correlation between point mutations in NS2 and the viability and cytopathogenicity of Bovine viral diarrhea virus strain Oregon analyzed with an infectious cDNA clone

B M Kümmerer et al. J Virol. 2000 Jan.

Abstract

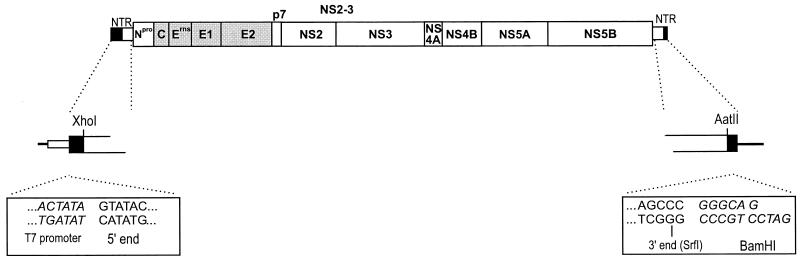
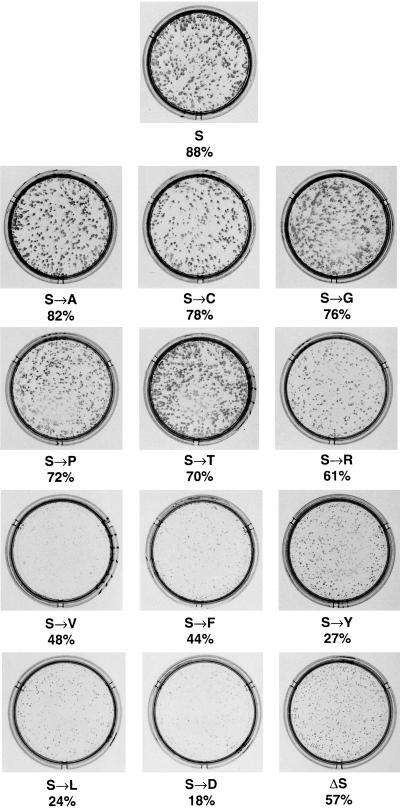
Cytopathogenicity of Bovine viral diarrhea virus (BVDV) is correlated with expression of the nonstructural protein NS3, which can be generated by processing of a fusion protein termed NS2-3. For the cytopathogenic (cp) BVDV strain Oregon, NS2-3 processing is based on a set of point mutations within NS2. To analyze the correlation between NS2-3 cleavage and cytopathogenicity, a full-length cDNA clone composed of cDNA from BVDV Oregon and the utmost 5'- and 3'-terminal sequences of a published infectious BVDV clone was established. After transfection of RNA transcribed from this cDNA clone, infectious virus with similar growth characteristics to wild-type BVDV Oregon could be recovered that also exhibited a cytopathic effect. Based on this cDNA construct and published cp and noncp infectious clones, chimeric full-length cDNA clones were constructed. Analysis of the recovered viruses demonstrated that the presence of the NS2 gene of BVDV Oregon in a chimeric construct is sufficient for NS2-3 processing and a cp phenotype. Since previous studies had revealed that the amino acid serine at position 1555 of BVDV Oregon plays an important role in efficient NS2-3 cleavage, mutants of BVDV Oregon with different amino acids at this position were constructed. Some of these mutants showed NS2-3 cleavage efficiencies in the range of the wild-type sequence and allowed the recovery of viruses that behaved similarly to wild-type virus with regard to growth characteristics and cytopathogenicity. In contrast, other mutants with considerably reduced NS2-3 cleavage efficiencies propagated much more slowly and reverted to viruses expressing polyproteins with sequences allowing efficient NS2-3 cleavage. These viruses apparently induced cytopathic effects only after reversion.


Figures

FIG. 1
FIG. 1
Schematic presentation of the BVDV full-length cDNA clone pOR. The part of the plasmid containing the complete cDNA derived from the BVDV Oregon genome is shown. The upper part indicates the cDNA, with thin bars at the ends representing the nontranslated regions (NTR) and the thick bar in the middle corresponding to the open reading frame coding for the viral proteins, which are also indicated. Solid bars represent the heterologous sequences derived from pA/BVDV, the infectious clone of BVDV CP7 (22). Gray boxes represent the regions coding for the structural proteins, whereas open boxes are indicative of sequences encoding nonstructural proteins. Below the scheme of the genome, blowups of the nontranslated regions and flanking regions containing the T7 RNA polymerase promoter (thin white box) and the SrfI site necessary for runoff transcription are shown. Thin black lines represent plasmid sequences. The XhoI site is located at nt 224 to 229, whereas the AatII site represents nt 12268 to 12273 (numbers refer to BVDV SD1 [8]).
FIG. 2
FIG. 2
Growth curve of BVDV Oregon and the virus derived from construct pOR [V(pOR)]. Cells were infected with the viruses at an MOI of 0.02 and harvested by freezing and thawing at the indicated time points. Titers were determined after infection of new cells by counting the number of plaques 72 h postinfection (p.i.) The results are given as log10 PFU per milliliter.
FIG. 3
FIG. 3
Analysis of transfection experiments carried out with RNA transcribed from the parental plasmids pOR and pC7, as well as the chimeric plasmids pORNS2/C7Ins−, pORNS2/C7, pC7NS2/C7Ins−, and pC7NS2/OR. (A) Detection of cells containing replicating virus resulting from RNA transfection. The rows with three dishes show the result of transfection of RNA derived from different full-length constructs based on pOR (upper row) or pC7 (lower row) at 3 days posttransfection. The exchanges present in the constructs are indicated below the dishes. For pC7NS2/OR, a second dish is shown that was fixed 4 days posttransfection (p.t.). Cells were transfected with equal doses of the in vitro-transcribed RNAs by using the DEAE-dextran method and seeded at a sufficient density that 3 days posttransfection a closed layer of cells was obtained. At this time point, cells were fixed and virus-containing cells were visualized by MAb-mediated peroxidase staining. By this means, the ability of the mutants to spread can be judged by the size of the foci. (B) Crystal violet staining of tissue culture cells transfected with RNA transcribed from the indicated plasmids. The arrangement of the dishes is similar to that in panel A. An in vitro-transcribed RNA derived from the ApaI-linearized plasmid pOR which results in a 3′ terminally truncated BVDV genome served as a negative control. Cells were seeded after transfection and split 3 days later. For pC7, crystal violet staining was done 48 h after the first split. The other cells were split again 96 h after the first split. These cells were stained 48 h (pOR, pC7NS2/OR) or 72 h (pORNS2/C7Ins−, pORNS2/C7, pC7NS2/C7Ins−, and control) after the second split. (C) Northern blot with RNA isolated from the transfected cells. The cells were split 72 h posttransfection, and RNA was prepared 48 h after the split. For the noncp viruses, 5 μg of total RNA of the transfected cells was loaded on the gel, whereas for the cp viruses, only 2 μg of RNA was loaded. Hybridization was performed with a BVDV-specific probe. The panel above the gel describes the plasmids from which the different viruses were derived. Interestingly, the recombinant cp viruses seem to produce more viral RNA than the corresponding noncp viruses. Similar results were obtained for a recombinant pair of cp and noncp BVDV obtained from an infectious cDNA clone based on strain NADL (18). (D) SDS-Page analysis of immunoprecipitates after transfection of MDBK cells with RNA derived from the indicated plasmids. Cells were split 72 h posttransfection and labeled with [35S]methionine-[35S]cysteine for 14 h starting either soon after the split (pC7) or 48 h later (pOR, pORNS2/C7Ins−, pORNS2/C7, pC7NS2/C7Ins−, and pC7NS2/OR). Above the gel, the parental full-length clones are indicated; below this is shown the origin of the NS2 gene for the chimeric viruses (the dashes indicate no exchange of sequences). Precipitation was carried out with an anti-NS3 serum (36), which recognizes NS2-3 and NS3, or with a rabbit preimmune serum (NS). (E) Growth curve of the recombinant viruses with heterologous NS2 genes. Cells were infected with the viruses at an MOI of 0.02 and harvested by freezing and thawing at the indicated time points. Titers were determined after infection of new cells by counting the number of plaques 72 h postinfection (p.i.). The results are given as log10 PFU per milliliter.
FIG. 3
FIG. 3
Analysis of transfection experiments carried out with RNA transcribed from the parental plasmids pOR and pC7, as well as the chimeric plasmids pORNS2/C7Ins−, pORNS2/C7, pC7NS2/C7Ins−, and pC7NS2/OR. (A) Detection of cells containing replicating virus resulting from RNA transfection. The rows with three dishes show the result of transfection of RNA derived from different full-length constructs based on pOR (upper row) or pC7 (lower row) at 3 days posttransfection. The exchanges present in the constructs are indicated below the dishes. For pC7NS2/OR, a second dish is shown that was fixed 4 days posttransfection (p.t.). Cells were transfected with equal doses of the in vitro-transcribed RNAs by using the DEAE-dextran method and seeded at a sufficient density that 3 days posttransfection a closed layer of cells was obtained. At this time point, cells were fixed and virus-containing cells were visualized by MAb-mediated peroxidase staining. By this means, the ability of the mutants to spread can be judged by the size of the foci. (B) Crystal violet staining of tissue culture cells transfected with RNA transcribed from the indicated plasmids. The arrangement of the dishes is similar to that in panel A. An in vitro-transcribed RNA derived from the ApaI-linearized plasmid pOR which results in a 3′ terminally truncated BVDV genome served as a negative control. Cells were seeded after transfection and split 3 days later. For pC7, crystal violet staining was done 48 h after the first split. The other cells were split again 96 h after the first split. These cells were stained 48 h (pOR, pC7NS2/OR) or 72 h (pORNS2/C7Ins−, pORNS2/C7, pC7NS2/C7Ins−, and control) after the second split. (C) Northern blot with RNA isolated from the transfected cells. The cells were split 72 h posttransfection, and RNA was prepared 48 h after the split. For the noncp viruses, 5 μg of total RNA of the transfected cells was loaded on the gel, whereas for the cp viruses, only 2 μg of RNA was loaded. Hybridization was performed with a BVDV-specific probe. The panel above the gel describes the plasmids from which the different viruses were derived. Interestingly, the recombinant cp viruses seem to produce more viral RNA than the corresponding noncp viruses. Similar results were obtained for a recombinant pair of cp and noncp BVDV obtained from an infectious cDNA clone based on strain NADL (18). (D) SDS-Page analysis of immunoprecipitates after transfection of MDBK cells with RNA derived from the indicated plasmids. Cells were split 72 h posttransfection and labeled with [35S]methionine-[35S]cysteine for 14 h starting either soon after the split (pC7) or 48 h later (pOR, pORNS2/C7Ins−, pORNS2/C7, pC7NS2/C7Ins−, and pC7NS2/OR). Above the gel, the parental full-length clones are indicated; below this is shown the origin of the NS2 gene for the chimeric viruses (the dashes indicate no exchange of sequences). Precipitation was carried out with an anti-NS3 serum (36), which recognizes NS2-3 and NS3, or with a rabbit preimmune serum (NS). (E) Growth curve of the recombinant viruses with heterologous NS2 genes. Cells were infected with the viruses at an MOI of 0.02 and harvested by freezing and thawing at the indicated time points. Titers were determined after infection of new cells by counting the number of plaques 72 h postinfection (p.i.). The results are given as log10 PFU per milliliter.
FIG. 4
FIG. 4
Analyses following the transfection of RNA derived from pOR with the S codon at position 1555 of the ORF exchanged for an F codon. (A) Detection of cells containing replicating virus resulting from RNA transfection. Cells were transfected with equal doses of the in vitro-transcribed RNAs by the DEAE-dextran method and seeded at a sufficient density that 3 days posttransfection a closed layer of cells was obtained. At this time point, cells were fixed and virus-containing cells were visualized by MAb-mediated peroxidase staining. Below the dishes, the NS2-3 cleavage efficiency determined for the respective polyprotein after transient expression is indicated. (B) Analysis of part of the NS2 sequence from RNA obtained at different time points after transfection of RNA derived from pOR/S-F. Cells were split every 3 to 4 days after transfection, and total RNA was prepared from each passage and used as starting material for RT-PCR. RNA from passage 0 was isolated 3 days posttransfection. The amplified fragments were directly sequenced to look for the mutation introduced into pOR/S-F (arrowhead). In lanes C, the sequence of the RT-PCR product derived from the in vitro-transcribed RNA is shown as a control.
FIG. 5
FIG. 5
Analysis of transfection experiments carried out with RNA transcribed from plasmid pOR encoding the wild-type serine at position 1555, or plasmids where the codon at position 1555 had been changed, leading to the point mutation indicated below each dish. In addition, the NS2-3 cleavage efficiency of each mutated polyprotein is given. Cells containing replicating virus were detected 3 days posttransfection as described in the legend to Fig. 4A.

References

    1. Baker J C. Bovine viral diarrhea virus: a review. J Am Vet Med Assoc. 1987;1990:1449–1458. - PubMed
    1. Becher P, Shannon A D, Tautz N, Thiel H-J. Molecular characterization of border disease virus, a pestivirus from sheep. Virology. 1994;198:542–551. - PubMed
    1. Behrens S-E, Grassmann C W, Thiel H-J, Meyers G, Tautz N. Characterization of an autonomous subgenomic pestivirus RNA replicon. J Virol. 1998;72:2364–2372. - PMC - PubMed
    1. Bolin S R, McClurkin A W, Cutlip R C, Coria M F. Severe clinical disease induced in cattle persistently infected with noncytopathic bovine viral diarrhea virus by superinfection with cytopathic bovine viral diarrhea virus. Am J Vet Res. 1985;46:573–576. - PubMed
    1. Brown E A, Zhang H, Ping L-H, Lemon S M. Secondary structure of the 5′ nontranslated regions of hepatitis C virus and pestivirus genomic RNAs. Nucleic Acids Res. 1992;20:5042–5045. - PMC - PubMed

Publication types

LinkOut - more resources